Carbanions are ions containing a negatively charged carbon atom.
They are formed by the heterolytic cleavage of a covalent bond between a carbon atom and another atom or group.[7]
Having an unshared electron pair, they are powerful nucleophiles, and strong bases, and attack, in order to form a covalent bond, a proton or an electrophilic center, such as a polarized or positively charged center.[8]
Carbanions are extremely reactive. Therefore, they must be stabilized in order to allow their attack to the electrophilic centers.[9] Stabilization may occur by inductive effect, resonance, and may also depend on the hybridization of the carbon atom carrying the negative charge.[7][8]
They are intermediates in many enzyme-catalyzed reactions.
Considering two atoms or group, indicated as A and B, joined by a covalent bond, there are two ways to break the bond: heterolysis and homolysis.
In heterolysis, the breaking of the covalent bond leads to the formation of two charged atoms, namely two ions, a cation and an anion, as both bonding electrons are taken by only one of the two previously bonded atoms, the more electronegative.
A:B → :A– + B+, if A is more electronegative than B;
A:B → A+ + :B–, if B is more electronegative than A.
In the heterolysis of a covalent bond involving a carbon atom, if both electrons are retained by the carbon atom, it will have a negative charge, therefore it is an anion, and is defined as a carbanion. On the contrary, if the carbon loses both electrons, it will have a positive charge, therefore it is a cation, and is defined as a carbocation.[5]
In homolysis, the breaking of the covalent bond between A and B leads to the formation of two free radicals, as each atom or group takes one of the two bonding electrons.[6]
Stabilization of carbanions
Carbanions are extremely reactive chemical species, and, like carbocations and free radicals, they are almost always transient intermediates in organic reactions. In order to allow their attack to the electrophilic centers, they must be stabilized. Their stabilization depends on the dispersion of the negative charge, which may occur by inductive effect, resonance, and may also depend on the s character of the hybrid orbitals of the negatively charged carbon atom.
The inductive effect is due to the presence in the molecule of one or more permanent dipoles in one or more bonds, dipoles which in turn arise from the difference in electronegativity between two groups. This difference leads to a non-uniform distribution of the bonding electrons. The inductive effect can be positive, also known as +I effect, feature of atoms or groups that tend to repel electrons, or negative, also known as –I effect, feature of atoms or groups that tend to attract electrons. The atoms or groups with the +I effect tend to decrease the stability of the carbanions, whereas those with the –I effect, therefore more electronegative, tend to stabilize them.[7]
The stability of carbanions increases when they are bound to an electrophilic structure where the unshared electron pair can delocalize by resonance, therefore a structure that acts as an electron trap or electron sink. Aromatic structures, such as the phenyl group, are particularly effective.[8]
Finally, the stability is also a function of the s character of hybrid orbitals of the negatively charged carbon atom, increasing as the percentage s character increases. Therefore it will increase going from sp3 hybridization, which has 25% s character, to sp2, with 33% s character, to sp, with 50% s character.[7]
R-CH2– < R1R2C=CH– < RC≡C–
Carbanions in enzymatic reactions
Examples of enzymatic reactions that proceed with the formation of carbanions are those catalyzed by three multienzyme complexes belonging to the family of 2-oxoacid dehydrogenases or alpha-ketoacid dehydrogenases, which are involved in the oxidative decarboxylation of ketoacids, in particular of alpha-ketoacids, briefly described below.
The pyruvate dehydrogenase complex, which catalyzes the oxidative decarboxylation of pyruvate into acetyl-CoA, thus acting as a bridge between glycolysis and the citric acid cycle;
The oxoglutarate dehydrogenase or alpha-ketoglutarate dehydrogenase complex, which catalyzes the oxidative decarboxylation of alpha-ketoglutarate to succinyl-CoA in step 4 of the citric acid cycle;
The branched-chain alpha-ketoacid dehydrogenase complex, which catalyzes the oxidative decarboxylation of the branched amino acids valine, leucine and isoleucine into acetyl-CoA and succinyl-CoA. The remaining carbon skeleton can then enter the citric acid cycle.[9]
The three multienzyme complexes have very similar structures and reaction mechanisms, and their E1 subunits, which are thiamine pyrophosphate dependent enzymes, catalyze a reaction in which a carbanion intermediate is formed, whose formation and stabilization by resonance involves thiamine.[1]
Transketolase (EC 2.2.1.1) also catalyzes a reactions that involves the formation of a carbanion intermediate. This enzyme, which catalyzes steps 6 and 8 of the pentose phosphate pathway, requires thiamine pyrophosphate as a cofactor, and has a reaction mechanism similar to that of the E1 subunits of multienzyme complexes seen previously.[6]
Acetyl-CoA carboxylase (EC 6.4.1.2) is another enzyme that catalyzes a reaction that involve the formation of a carbanion intermediate. The enzyme catalyzes the committed step of de novo synthesis of fatty acids, namely, the carboxylation of acetyl-CoA to malonyl-CoA.[2]
References
^ Berg J.M., Tymoczko J.L., and Stryer L. Biochemistry. 5th Edition. W. H. Freeman and Company, 2002
^ Heterolysis, in IUPAC Compendium of Chemical Terminology, 3rd ed. International Union of Pure and Applied Chemistry; 2006. Online version 3.0.1, 2019. doi:1351/goldbook.H02809
^ Homolysis, in IUPAC Compendium of Chemical Terminology, 3rd ed. International Union of Pure and Applied Chemistry; 2006. Online version 3.0.1, 2019. doi:1351/goldbook.H02851
^ Moran L.A., Horton H.R., Scrimgeour K.G., Perry M.D. Principles of Biochemistry. 5th Edition. Pearson, 2012
^ ab Nelson D.L., Cox M.M. Lehninger. Principles of biochemistry. 6th Edition. H. Freeman and Company, 2012
^ abcd Soderberg T. Organic chemistry with a biological emphasis. Volume I. Chemistry Publications. 2019
^ abc Solomons T. W.G., Fryhle C.B., Snyder S.A. Solomons’ organic chemistry. 12th Edition. John Wiley & Sons Incorporated, 2017
^ ab Voet D. and Voet J.D. Biochemistry. 4th Edition. John Wiley J. & Sons, Inc. 2011
Keto acids or ketoacids are organic compounds containing two functional groups: a carboxyl acid group (−COOH) and a carbonyl group (˂C=O).
Based on the position of the carbonyl group relative to the carboxylic acid group, to which the IUPAC nomenclature rules assign the highest priority, ketoacids are classified as alpha-keto acids, beta-keto acids, and gamma-keto acids.[2]
Keto acids, and in particular alpha-keto acids, are very important in biochemistry, being involved in many metabolic pathways.[4]
Alpha-keto acids
They have the carbonyl group at the first carbon from the carboxylic acid. Many of these compounds, in the form of their conjugate bases, have important biological functions. Below are some examples.
Pyruvic acid, the simplest alpha-keto acid, is the end metabolic product of glycolysis.
Oxaloacetic acid and alpha-ketoglutaric acid are intermediates of the citric acid cycle.
Alpha-keto acids can arise from transamination and oxidative deamination reactions of amino acids. In transamination reactions, the alpha amino group of the amino acid is transferred to an alpha-keto acid, usually alpha-ketoglutarate, with the formation of a new amino acid and an new alpha-keto acid. These reactions are catalyzed by enzymes called aminotransferases or transaminases (EC6.1.-).
alpha-Keto acid + Amino acid ⇄ New amino acid + New alpha-keto acid
In oxidative deaminations, amino acids are converted into the corresponding alpha-keto acids by removing the amino group, which is converted to ammonia and replaced by a carbonyl group. Since the reaction is reversible, ketoacids are also precursors of amino acids.
Note: ammonia is a toxic compound, and is converted into the safer compound urea via the urea cycle in the liver.[4]
Pyruvate, oxaloacetate and alpha-ketoglutarate, the latter via oxaloacetate, are the entry points into gluconeogenesis of the carbon skeleton of many glucogenic amino acids.[4]
It has also been observed that, in vitro, murine and human tumor cell lines secrete 2-chetoacids into the tumor microenvironment, such as α-ketoisocaproate, α-keto-β-methylvalerate and α-ketoisovalerate, which are capable to influence the anti-tumor activity of macrophages.[1]
Beta-keto acids
They have the carbonyl group at the second carbon from the carboxylic acid.
Examples of beta-keto acids are acetoacetic acid, the simplest one, and beta-hydroxybutyric acid, which are two of the three ketone bodies, together with acetone, produced by the hepatocyte when acetyl-CoA is produced in excess of the capacity of citrate synthase (EC 2.3.3.1), namely, of citric acid cycle to oxidize it fully, as during prolonged fasting or diets very low in carbohydrates.
Note that acetoacetyl-CoA and beta-hydroxybutyryl-CoA, namely, the activated forms of these beta-keto acids, are also intermediates in the butyric acid synthesis pathway which occurs in most butyrate-producing bacteria of the gut microbiota.[3][5][6]
Gamma-keto acids
They have the carbonyl group at the third carbon from the carboxylic acid.
An example is levulinic acid, the simplest one, which arises from the catabolism of cellulose.
References
^ Cai Z., Li W., Brenner M., Bahiraii S., Heiss E.H., Weckwerth W. Branched-chain ketoacids derived from cancer cells modulate macrophage polarization and metabolic reprogramming. Front Immunol 2022;13:966158. doi:10.3389/fimmu.2022.966158
^ Miller T.L., Wolin M.J. Pathways of acetate, propionate, and butyrate formation by the human fecal microbial flora. Appl Environ Microbiol 1996;62(5):1589-92. doi:10.1128/aem.62.5.1589-1592
^ abc Nelson D.L., Cox M.M. Lehninger. Principles of biochemistry. 6th Edition. W.H. Freeman and Company, 2012
^ Portincasa P., Bonfrate L.,Vacca M., De Angelis M., Farella I., Lanza E., Khalil M.,Wang D.Q.-H., Sperandio M., Di Ciaula A. Gut microbiota and short chain fatty acids: implications in glucose homeostasis. Int J Mol Sci 2022;23:1105. doi:10.3390/ijms23031105
^ Pryde S.E., Duncan S.H., Hold G.L., Stewart C.S., Flint H.J. The microbiology of butyrate formation in the human colon. FEMS Microbiol Lett 2002;217(2):133-9. doi:10.1111/j.1574-6968.2002.tb11467.x
A futile cycle, or substrate cycle, occurs when two non-equilibrium opposing reactions, catalyzed by different enzymes, or two opposite metabolic pathways run simultaneously with no other overall effect than the dissipation of energy.[4]
The name of futile cycle was coined because apparently these cycles seemed to confer no benefit to the cell, a sort of metabolic imperfection leading to energy expenditure.[1][3] However, recently, they have been recognized as important for the generation of heat, the amplification of metabolic signals,[1] the redistribution of the energy, in form of triglycerides, between adipocytes and hepatocytes,[5][6] and the modification of fatty acids stored as triglycerides in adipose tissue.[7]
In order to avoid uncontrolled dissipation of energy, futile cycles are strictly regulated.
Examples of futile cycles are glycolysis and gluconeogenesis when they proceed simultaneously at a high rate in the same cell, the Cori cycle,[2] and the triglyceride/fatty acid cycle.
Let us consider the conversion of A into B, which proceeds at a rate of 100, and B into A, which proceeds at a rate of 90. This results in a net flow of 10. Suppose that an effector increases the rate of conversion of A into B by 30 percent, to 130 percent, and reduces the rate of conversion of B into A by 30 percent, to 63 percent. The resulting net flux is equal to 130-63 = 67, namely, a 30 percent change in the rates of the opposing reactions has led to a 570 percent increase in the net flux.[1]
A mechanism of this type could, at least in part, explain the even 1000-fold increase in carbon flux down the glycolysis in the initial phase of intense exercise.
Regulation
In the course of evolution, the selection of different enzymes to catalyze irreversible and opposing reactions has made possible to avoid or put under strict control futile cycles. How? The selection of one enzyme that catalyzes the conversion of A into B, and another enzyme that catalyzes the opposing reaction, whose activities are regulated separately, allows the control of the net flux.[3][4] Enzymatic activities are controlled by:
allosteric mechanisms;
covalent modifications;
modifications in the concentration of the enzymes, due to variations in the ratio between their synthesis and/or degradation. A different mechanism regulates hepatic glucokinase (EC 2.7.1.2). During fasting, the enzyme is reversibly bound to GKPR, one of the liver-specific proteins, which anchors it inside the nucleus, separating it from the other glycolytic enzymes, and thus preventing the futile cycle between glycolysis and gluconeogenesis.
In this way, it is possible to obtain a coordinated regulation of the two opposing pathways, thus avoiding an uncontrolled futile cycle. Obviously, such a fine regulation could not be achieved if a single enzyme would operate in both directions.
Glycolysis and gluconeogenesis
If glycolysis, which converts glucose into pyruvate with the production of ATP, and gluconeogenesis, which converts pyruvate into glucose with the consumption of ATP, run simultaneously at high rate in the same cell, the net result would be a net consumption of ATP, therefore a futile cycle. This is avoided by the control of the irreversible steps of the two metabolic pathways, in particular the reactions catalyzed by phosphofructokinase-1 or PFK-1 (EC 2.7.1.11), and by fructose-1,6-bisphosphatase or FBPase (EC 3.1.3.11), mainly by the allosteric effector fructose 2,6-bisphosphate.[3][4]
It should be noted that in glycolysis, the control involves all the irreversible reactions, whereas in gluconeogenesis, the key regulatory points are the reactions catalyzed by pyruvate carboxylase (EC 6.4.1.1) and fructose 1,6-bisphosphatase.
Cori Cycle
In the Cori cycle, lactic acid produced from glucose in the muscle and other extrahepatic tissues reaches the liver, where it is converted back into glucose, which, released into the circulation, returns to the muscle and other extrahepatic tissues, thereby closing the cycle. From an energetic point of view, the Cori cycle can be considered a futile cycle because it results in a net consumption of 4 ATP with no other overall effect.[2] However, it allows many different types of extrahepatic cells to work at the expense of the liver.
Triglyceride/fatty acid cycle
In the triglyceride/fatty acid cycle, triglycerides in adipose tissue are partially or completely hydrolyzed to free fatty acids and glycerol, in a process called lipolysis; the released fatty acids are then used to resynthesize new molecules of triglycerides.[2][4][5] Four moles of ATP are consumed for every mole of triglycerides that completes the cycle.
This futile cycle can take place:
between adipose tissue, which releases fatty acids, and the liver, which re-esterified them to triglycerides, leading to a redistribution of stored energy;[6]
in adipocytes, where it may contribute to thermogenesis and modifications of the stored fatty acids.
Regarding the modifications, the cycle renders fatty acids accessible for re-arrangements such as elongations and desaturations, which allow saturated fatty acids to be converted to unsaturated fatty acids. However, the efficiency of the process seem to depend on the type of fatty acids.[7] For example, the metabolism of the released medium-chain fatty acids is faster than the conversion of palmitic acid, one of the long-chain fatty acids, to palmitoleic acid, oleic acid, and then, in hepatocytes, to arachidonic acid.
Note that the conversion of medium-chain fatty acids and palmitic acid to long-chain unsaturated fatty acids reduces the health risk associated to their accumulation in stored triglycerides.
Generation of heat
In some cases a futile cycle has the only function of producing heat through the hydrolysis of ATP. This occurs, for example, in the flight muscles of bumblebees, which, in order to fly, must maintain a thoracic temperature of about 30 °C, even when the external temperature is 10 °C.[1] The thoracic temperature is maintained at the optimal levels for flight thanks to the futile cycle between the reactions catalyzed by PFK-1 and FBPase. In fact, flight muscle FBAase is not inhibited by AMP, which suggests that, during evolution, this protein has been selected for the generation of heat.
Unlike bumblebees, flight muscles of honeybees contain almost no FBPase, and therefore these insects cannot fly when the external temperature is low.
References
^ abcd Berg J.M., Tymoczko J.L., and Stryer L. Biochemistry. 5th Edition. W. H. Freeman and Company, 2002
^ abc Brownstein A.J., Veliova M., Acin-Perez R., Liesa M., Shirihai O.S. ATP-consuming futile cycles as energy dissipating mechanisms to counteract obesity. Rev Endocr Metab Disord 2022;23(1):121-131. doi:10.1007/s11154-021-09690-w
Short-chain fatty acids or SCFAs are saturated fatty acids with a straight or branched carbon-chain made of 2-5 carbon atoms, and are acetic acid, propionic acid, butyric acid, isobutyric acid, valeric acid, isovaleric acid, and 2-methylbutyric acid.[1]
In humans, they are, along with secondary bile salts, the main metabolites produced by bacteria of the gut microbiota in the cecum and colon, and derive almost entirely from the anaerobic fermentation of non-digestible carbohydrates.[11] The most abundant are acetic acid, propionic acid and butyric acid, which represent 90-95 percent of the produced SCFAs.[6] The remaining percentage is made of the branched SCFAs.
They are the major anions present in the colon. Their concentration is higher in the cecum and in the proximal colon than in the distal part, where the substrates for their synthesis are depleted.[1][2][4] They are able to reduce colonic pH value and thus acidify the stool.
About 90-95 percent of the SCFAs are absorbed in the cecum and colon, whereas 5-10 percent are excreted with the feces.[13]
They are thought to provide about 70 percent of the energy needs of colonocytes.[4]
Short-chain fatty acids are able to modulate the physiology and composition of the gut microbiota.[7] Furthermore, a growing body of research suggests that they play a important role in maintaining human health.[4]
Like medium-chain fatty acids and long-chain fatty acids, short-chain fatty acids are present in animal and plant tissues mostly in the form of triglycerides, although in much lower amounts than long-chain ones.
In adults, the main food source is milk and dairy products, where butyric acid is the SCFA present with the highest concentration. Other sources are some vegetable oils, such as palm kernel oil and coconut oil.
In breastfed infants, the main source is breast milk.[10]
However, for humans, and most mammals, the most important source is the anaerobic fermentation of fibers and resistant starch, namely, indigestible carbohydrates, by the bacteria of the gut microbiota.[6] Approximately 500-600 mM of SCFAs are produced through this pathway per day. Acetic, propionic and butyric acids are present in a molar ratio of about 60:20:20, respectively, although the relative proportion of each depends on the microbiota composition, the substrate, and the intestinal transit time.[7][11]
Properties
Short-chain fatty acids have carbon chains made of 2-5 carbon atoms, a characteristic that strongly affects the physical properties.[9]
Acetic acid, propionic acid, butyric acid and valeric acid are straight-chain fatty acids, whereas isobutyric acid, isovaleric acid and 2-methylbutyric acid are branched-chain fatty acids.
They are small molecules, and are the smallest among all lipids.
They are liquid at room temperature, and are soluble in polar solvents such as water, unlike saturated fatty acids with longer carbon chains, whose solubility in polar solvents, considering those with straight chain, decreases as the length of the chain increases, as the hydrophobic part of the molecule is the carbon chain, whereas the carboxyl group is polar.[10]
Finally, it should also be noted that butyric acid and isobutyric acid, which have the molecular formula C4H8O2, are an example of chain isomerism, as well as valeric acid, isovaleric acid and 2-methylbutyric acid, which have the formula molecular C5H10O2.
Health effects
Short-chain fatty acids appear to play a crucial role in maintaining human health.[4] Their activity seems to occur through direct and/or indirect effects on cellular processes such as proliferation, differentiation and gene expression, thus contributing to the regulation of processes such as glucose homeostasis, intestinal and immune function, and the regulation of the gut-brain axis.[6] Their health effects seem to be confirmed also by studies showing that intestinal dysbiosis appears to be implicated in metabolic pathologies, such as disorders involving glucose homeostasis, and behavioral and neurological pathologies, such as depression, and Alzheimer’s and Parkinson’s.[11]
Synthesis
In humans, the enzyme equipment carrying out carbohydrate digestion lacks the enzymes capable of digesting fiber and resistant starch, the latter so called precisely because it resists the action of alpha-amylase. On the contrary, the bacteria of the gut microbiota code for a large number of different glycoside hydrolases, more than 260, which also hydrolyze fibers and resistant starch, releasing the constituent monosaccharides.[7] Hexoses and deoxyhexoses enter glycolysis, and pentoses enter the pentose phosphate pathway, to give pyruvate which is the main precursor for the synthesis of short-chain fatty acids.[2][4][5]
The synthesis of SCFAs is affected by several factors; below are some examples.[4][11][13]
The fiber content of the diet. For example, a diet rich in fibers, such as the Mediterranean diet may influence their synthesis.
The composition of the gut microbiota.
The pH of the intestinal lumen, as the bacteria that produce butyric acid dominate at pH value around 5.5, while the bacteria that produce acetic and propionic acids dominate at pH value around 6.5.
The gut transit time.
The amount of oxygen in the intestinal lumen.
Acetic acid and propionic acid are mainly produced by species of the phylum Bacteroides, while butyric acid, for whose synthesis resistant starch is particularly important, by species of the phylum Firmicutes.[6]
Synthesis of acetic acid
Acetic acid, the most abundant SCFA in the colon, can be synthesized via the Wood-Ljungdahl pathway in the reductive direction, through the reduction of CO2 to acetate, or from acetyl-CoA, the most important metabolic pathway, responsible of the production of about two thirds of butyric acid present in the intestinal lumen.[4]
Synthesis of propionic acid
Propionic acid can be synthesized through three different metabolic pathways: the acrylate and succinate pathways, which use lactic acid produced by other bacteria, and the propanediol pathway, in which the precursors are deoxyhexoses.[2][3][10]
The acrylate pathway converts lactic acid to propionyl-CoA, via lactoyl-CoA. In the final step, propionyl-CoA is hydrolyzed to propionic acid.
In the succinate pathway, lactate is reduced to pyruvate, which is carboxylated to oxaloacetate, which, through a pathway that has malate, fumarate, succinate, and methylmalonyl-CoA as intermediates, is converted to propionyl-CoA, which in turn is hydrolyzed to propionic acid. The succinate pathway is thought to be the dominant pathway for propionic acid synthesis in the gut.
In the propanediol pathway, some deoxyhexoses, such as fucose and rhamnose, are converted via 1,2-propanediol to propionyl-CoA and then propionic acid.
Synthesis of butyric acid
The synthesis of butyric acid can follow two routes.[7][10]
In most butyric acid-producing bacteria, the short-chain fatty acid is synthesized through a pathway that begins with the condensation of two acetyl-CoA to acetoacetyl-CoA, which, through a pathway that has beta-hydroxybutyryl-CoA and crotonyl-CoA as intermediates, is converted to butyryl-CoA. The final step is the release of butyric acid from butyryl-CoA.[8]
In a small number of bacterial species, butyryl-CoA is converted to butyryl phosphate, from which butyric acid is released.[2]
Synthesis from amino acids
Acetic acid, propionic acid and butyric acid can also be produced from amino acids obtained from peptide and protein degradation, although the amount produced by these pathways is small.[7]
These synthesis occur in the distal part of the colon, often by non-commensal bacteria, as in the case of glutamate and lysine fermentation.[3] Different short-chain fatty acids are produced by the metabolism of different amino acids; below are some examples.[4]
Glutamic acid mainly produces acetic acid and butyric acid.
Aspartic acid mainly produces acetic acid and propionic acid.
The basic amino acids lysine, arginine and histidine produce acetic acid and butyric acid.
Cysteine produces acetic, propionic and butyric acids.
Methionine mainly produce propionic acid and butyric acid.
Branched-chain fatty acids derive from the branched-chain amino acids leucine, isoleucine and valine.
The pH of the intestinal lumen influences the metabolism of proteins by the gut microbiota; for example, their breakdown into amino acids is more likely at neutral or weakly alkaline pH.
It should be noted that potentially toxic compounds, such as ammonia, sulphites and phenols, are also produced from the intestinal metabolism of amino acids.
Endogenous synthesis
Mammals, and therefore humans, have the enzymatic equipment for the endogenous synthesis of short-chain fatty acids. The synthesis occurs mainly in the liver, by beta-oxidation cycles which lead to the formation of acyl-CoA with a shorter carbon chain than the starting fatty acid. The acil-CoA is then hydrolyzed to fatty acid and CoA by an acyl-CoA thioesterases (EC 3.1.2.20).[10][12]
Membrane receptors
Short-chain fatty acids can bind to specific receptors on the plasma membrane, the G protein-coupled receptors, including GPR41, GPR43 and GPR109A.[6]
The effects produced by the binding of the SCFAs on the receptors depend on the cell type. For example, binding to receptors on intestinal L cells is associated with the release of glucagon-like peptide-1, or GLP-1, and peptide YY, hormones that affect appetite and food intake. The binding to enterochromaffin cells induces the release of serotonin, which may affect intestinal motility. Finally, binding to receptors on pancreatic beta-cells increases insulin release.[11]
The different short-chain fatty acids have different ability to activate the receptors: GPR43 is more likely to be activated by acetic and propionic acids, GPR41 by propionic and butyric acids, while GPR109A by butyric acid.[4]
Absorption
About 90 percent of the short-chain fatty acids present in the intestinal lumen are absorbed by colonocytes. The passage across the plasma membrane can occur by passive diffusion or by active transport mediated by two types of membrane transporters: the H+-dependent and Na+-dependent monocarboxylate transporters, or MCTs and SMCTs, respectively.[6][7]
Passive transport affects protonated forms of SCFAs, so it is influenced by colonic pH value. A weak acidification of the intestinal lumen, which can be due to the metabolic activity of the microorganisms, increases the prevalence of the protonated form and therefore of passive transport.[10]
Role in colonocytes
In colonocytes, short-chain fatty acids have energy and regulatory function.
When used for energy purposes, acetic acid and butyric acid are converted to acetyl-CoA, and propionic acid to propionyl-CoA. Through the production of ATP, SCFAs contribute to the maintenance of cellular homeostasis, but also, for example, to the maintenance of the integrity of the tight junctions at the cell apex, and therefore of the integrity of the intestinal barrier.[11] Of the three major short-chain fatty acids produced by gut microbiota, butyric acid is the major source of energy for colonocytes, while acetic and propionic acids are poorly metabolized and mostly drained by the portal vein.[2][13]
Considering the regulatory role, SCFAs are, for example, capable of inhibiting histone deacetylases (EC 3.5.1.98), enzymes that catalyze the removal of acetyl groups from lysine residues of histone proteins, acetyl groups previously inserted by histone acetyltransferase (EC 2.3.1.48).[7] The R groups of deacetylated lysines have positive charges, which allows histone proteins to wrap the DNA more tightly. This makes the nucleosome more compact, and consequently more difficult to carry out transcription and gene expression. The different short-chain fatty acids have different abilities to inhibit histone deacetylases:
This mode of action on histone deacetylases has been observed not only in the gut and associated immune tissue, but also in the central and peripheral nervous systems.[11]
Transport
Short-chain fatty acids that have not been utilized by colonocytes leave the cell by passive diffusion and active transport across the basolateral membrane, and enter the portal circulation where acetic acid reaches the highest concentration, about 260 mM/L, while propionic and butyric acids reach concentrations of about 30 mM/L.[2]
In the rectum, a small amount of these lipids can pass directly into the systemic circulation, thus bypassing the liver, via the internal iliac vein.[13]
Unlike long-chain fatty acids, short- and medium-chains fatty acids are present in the circulation in free form, namely, as non-esterified fatty acids, and, bound to albumin, reach the liver. Subsequent cell uptake and intracellular transport do not require fatty acid transport proteins, plasma membrane fatty acid translocases, or cytosolic fatty acid binding proteins. Therefore, their oxidation may be much faster than that of long-chain fatty acids and the longest members of medium-chain fatty acids, namely, fatty acid with carbon chains longer than 8 carbon atoms.[10]
Hepatic and extrahepatic metabolism
The liver is an important site for short-chain fatty acids metabolism.[13]
It can to absorb about 40 percent of the acetic acid and 80 percent of the propionic acid from the portal vein. Propionic acid is mostly metabolized in the liver, where it can also be used as a substrate for gluconeogenesis.[7]
A small amount of the gut derived SCFAs, about 36 percent for acetic acid, 9 percent for propionic acid and only 2 percent for butyric acid, reach, through the systemic circulation, the peripheral tissues. In muscle, acetic acid can be used for lipid synthesis or be oxidized for energy production. Furthermore, it is thought that SCFA concentrations in the systemic circulation, even if small, are capable of influencing the metabolism and physiology of peripheral cells and tissues.
References
^ ab Abdul Rahim M.B.H., Chilloux J., Martinez-Gili L., Neves A.L., Myridakis A., Gooderham N., Dumas M.-E. Diet-induced metabolic changes of the human gut microbiome: importance of short-chain fatty acids, methylamines and indoles. Acta Diabetol 2019;56:493-500. doi:10.1007/s00592-019-01312-x
^ abcde Deleu S., Machiels K., Raes J., Verbeke K., Vermeire S. Short chain fatty acids and its producing organisms: an overlooked therapy for IBD? EBioMedicine 2021;66:103293. doi:10.1016/j.ebiom.2021.103293
^ ab Koh A., De Vadder F., Kovatcheva-Datchary P., Bäckhed F. From dietary fiber to host physiology: short-chain fatty acids as key bacterial metabolites. Cell 2016;165(6):1332-1345. doi:10.1016/j.cell.2016.05.041
^ abcdefghij Liu X.F., Shao J.H., Liao Y.T., Wang L.N., Jia Y., Dong P.J., Liu Z.Z., He D.D., Li C., Zhang X. Regulation of short-chain fatty acids in the immune system. Front Immunol 2023;14:1186892. doi:10.3389/fimmu.2023.1186892
^ Miller T.L., Wolin M.J. Pathways of acetate, propionate, and butyrate formation by the human fecal microbial flora. Appl Environ Microbiol 1996;62(5):1589-92. doi:10.1128/aem.62.5.1589-1592
^ abcdef Parada Venegas D., De la Fuente M.K., Landskron G., González M.J., Quera R., Dijkstra G., Harmsen H.J.M., Faber K.N., Hermoso M.A. Short chain fatty acids (SCFAs)-mediated gut epithelial and immune regulation and its relevance for inflammatory bowel diseases. Front Immunol 2019;10:1486. doi:10.3389/fimmu.2019.00277
^ abcdefgh Portincasa P., Bonfrate L., Vacca M., De Angelis M., Farella I., Lanza E., Khalil M.,Wang D.Q.-H., Sperandio M., Di Ciaula A. Gut microbiota and short chain fatty acids: implications in glucose homeostasis. Int J Mol Sci 2022;23:1105. doi:10.3390/ijms23031105
^ Pryde S.E., Duncan S.H., Hold G.L., Stewart C.S., Flint H.J. The microbiology of butyrate formation in the human colon. FEMS Microbiol Lett 2002;217(2):133-9. doi:10.1111/j.1574-6968.2002.tb11467.x
^ abcdefg Schönfeld P., Wojtczak L. Short- and medium-chain fatty acids in energy metabolism: the cellular perspective. J Lipid Res 2016;57(6):943-54. doi:10.1194/jlr.R067629
^ abcdefg Silva Y.P., Bernardi A., Frozza R.L. The role of short-chain fatty acids from gut microbiota in gut-brain communication. Front Endocrinol (Lausanne) 2020;11:25. doi:10.3389/fendo.2020.00025
^ abcde Xiong R.G., Zhou D.D., Wu S.X., Huang S.Y., Saimaiti A., Yang Z.J., Shang A., Zhao C.N., Gan R.Y., Li H.B. Health benefits and side effects of short-chain fatty acids. Foods 2022;11(18):2863. doi: 10.3390/foods11182863
Starch phosphorylase or alpha-glucan phosphorylase (EC 2.4.1.1) is a multimeric protein, with enzymatic and regulatory activity, that plays an important role in carbohydrate metabolism, both in prokaryotes and eukaryotes.[10]
The enzyme catalyzes the transfer of a glucosyl unit from glucose 1-phosphate to the non-reducing end of a nascent α-(1→4)-glucan, to which glucose is linked by an α-(1→4) glycosidic linkage.[6][8]The reaction is reversible and the direction depends on the phosphate/glucose-1-phosphate ratio present in vivo.[2] The enzyme, like starch synthase (EC 2.4.1.21), which is involved in the synthesis of amylose and amylopectin, the polysaccharides which make up starch granules, glycogen phosphorylase (EC 2.4.1.1), an enzyme involved in glycogenolysis, and glycogen synthase (EC 2.4.1.11), which is involved in glycogen synthesis, belongs to the family of glucosyltransferases (EC 2.4).[6]
Note that, while starch synthase uses ADP-glucose as glucosyl donor, and glycogen synthase uses UDP-glucose, starch phosphorylase uses glucose 1-phosphate.[2]
Starch phosphorylase appears to be involved in both the synthesis and degradation of amylose and amylopectin.[9]
Industrially, the phosphorolytic action of starch phosphorylase is used in the production of glucose-1-phosphate and in the preparation of carbohydrates such as glucans and modified starches.[6]
At least two isoforms of starch phosphorylase are present in plants, one in the stroma of plastids, named Pho1, and Pho2, with cytosolic localization. Both isoforms play a critical role in the synthesis and degradation of starch.[6][8]
Starch degradation
Although alpha-amylase (EC 3.2.1.1) is the first enzyme to intervene in the polysaccharide degradation during the early stages of germination, and beta-amylase (EC 3.2.1.2) is the first enzyme to intervene in the transient starch degradation in chloroplasts, other enzyme activities have also been implicated, such as alpha-glucan water dikinase (EC 2.7.9.4) and phospho-glucan water dikinase (EC 2.7.9.5), and the debranching enzyme.[10]
Of the two isoenzymes of starch phosphorylase, Pho1 seems to have an indirect or regulatory action capable of influencing the activity of the other enzymes involved in starch degradation, while Pho2 is capable of degrading starch granules and other branched glucans.
Starch synthesis
During starch biosynthesis, starch phosphorylase, particularly Pho1, appears to perform both an enzymatic and regulatory action.
Pho1 seems to be involved in the initial steps of starch synthesis, contributing to the elongation of the nascent chain.[1][8]
Starch synthesis involves a set of at least five classes of enzymes, namely ADP-glucose pyrophosphorylase (EC 2.7.7.27), starch synthases, starch branching enzymes (EC 2.4.1.18), starch debranching enzymes (EC 3.2.1.41) and starch phosphorylases.[5][10] To these must be added proteins with no catalytic activity but needed for the correct synthesis of the starch granule. In the endosperm of cereals, the formation of multienzyme complexes between starch synthases and branching enzymes depends not only on specific phosphorylations of the proteins, but also on the presence of Pho1.[1][3]
Starch phosphorylase is capable of forming a complex with disproportionating enzyme (EC 2.4.1.25).[1][10] Such complex seems capable of synthesizing short malto-oligosaccharides or MOS, which are α-(1→4)-glucans with a degree of polymerization between 2 and 7.[7] MOS act as primers for starch synthase IV and granule-bound starch synthase in the initial steps of amylopectin and amylose synthesis, respectively, a role which resembles that of glycogenin in glycogen synthesis.[4] MOS can also originate from the activity of starch debranching enzymes during the trimming of amylopectin molecules.
References
^ abc Crofts N., Abe N., Oitome N.F., Matsushima R., Hayashi M., Tetlow I.J., Emes M.J., Nakamura Y., Fujita N. Amylopectin biosynthetic enzymes from developing rice seed form enzymatically active protein complexes. J Exp Bot 2015;66(15):4469-82. doi:10.1093/jxb/erv212
^ ab Orzechowski S. Starch metabolism in leaves. Acta Biochim Pol 2008;55(3):435-45. doi:10.18388/abp.2008_3049
^ Pfister B., Zeeman S.C., Rugen M.D., Field R.A., Ebenhöh O., Raguin A. Theoretical and experimental approaches to understand the biosynthesis of starch granules in a physiological context. Photosynth Res 2020;145:55-70. doi:10.1007/s11120-019-00704-y
^ Qu J., Xu S., Zhang Z., Chen G., Zhong Y., Liu L., Zhang R., Xue J., Guo D. Evolutionary, structural and expression analysis of core genes involved in starch synthesis. Sci Rep 2018;8(1):12736. doi:10.1038/s41598-018-30411-y
^ abcd Rathore R.S., Garg N., Garg S., Kumar A. Starch phosphorylase: role in starch metabolism and biotechnological applications. Crit Rev Biotechnol 2009;29(3):214-24. doi:10.1080/07388550902926063
^ Tetlow I.J., Bertoft E. A review of starch biosynthesis in relation to the building block-backbone model. Int J Mol Sci 2020;21(19):7011. doi:10.3390/ijms21197011
^ abc Tickle P., Burrell M.M., Coates S.A., Emes M.J., Tetlow I.J., Bowsher C.G. Characterization of plastidial starch phosphorylase in Triticum aestivum L. endosperm. J Plant Physiol 2009;166(14):1465-78. doi:10.1016/j.jplph.2009.05.004
^ Voet D. and Voet J.D. Biochemistry. 4th Edition. John Wiley J. & Sons, Inc. 2011
^ abcd Yu G., Shoaib N., Xie Y., Liu L., Mughal N., Li Y., Huang H., Zhang N., Zhang J., Liu Y., Hu Y., Liu H., Huang Y. Comparative study of starch phosphorylase genes and encoded proteins in various Monocots and Dicots with emphasis on maize. Int J Mol Sci 2022;23:4518. doi:doi.org/10.3390/ijms23094518
Amylopectin is a highly branched polysaccharide made up of alpha-D-glucose units. Together with amylose, it is one of the two main constituents of starch granules, the means by which plants store energy and the most widespread and abundant form of carbohydrate storage on Earth.[12]
Glucose monomers are linked by α-(1→4) glycosidic bonds to form chains to which the branches are linked by α-(1→6) glycosidic bonds.[2]
Its synthesis requires the coordinated action of at least four distinct classes of enzymes: starch synthases (EC 2.4.1.21), starch branching enzymes (EC 2.4.1.18), starch debranching enzymes, and starch phosphorylase (EC 2.4.1.1).[17]
In starch granules, amylopectin is present in greater amount than amylose, and forms a semi-crystalline matrix within which amylose seems to be stored.
The amylose/amylopectin ratio significantly influences the physicochemical properties of starch, and consequently both its industrial applications, such as the production of food additives, and the possible health effects.[3]
Amylopectin is a highly branched polysaccharide, and has a molecular weight in the order of 107-108 Daltons, therefore much larger than amylose. It is formed of 104-105 glucose molecules which are linked by α-1,4 glycosidic bonds to form many relatively short chains, whose degree of polymerization is of 18-25 molecules.[17] The length of the chains vary depending on the source of the starch as well as the environmental and nutrient conditions during plant growth and seed formation.
The chains are interconnected by α-1,6 glycosidic bonds to form a tree-like architecture, with neighboring chains forming cluster-like structures.[1]
In most starches, α-1,6 glycosidic bonds account for about 5 percent of all glycosidic bonds, a lower percentage than that found in glycogen molecule, about 9 percent, where the branches are more evenly distributed. The length and distribution of the branches directly affect the physicochemical properties of amylopectin, such as solubility, viscosity, ease of retrogradation, and gelatinization and pasting temperature.[3] For example, glycogen is water soluble whereas amylopectin and starch are not.
Amylopectin chains
Amylopectin chains can be classified on the basis of their length or the presence or absence of branches.
The classification according to the length identifies two main types of chains: short and long chains. Short chains have a degree of polymerization of 6-36 glucosyl units, although the upper limit depends on the source of amylopectin, whereas long chains have a degree of polymerization greater than or equal to 36. In most starches, the molar distribution of long to short chains is about 19-6, and is generally higher in A-crystalline starches, such as cereal endosperm starches, than in B-crystalline starches, such as those in potatoes.[17]
The classification on the basis of their connections to other chains identifies three categories: A-chains, B-chains and C-chains.[7]
A-chains carry no branches, are short chains, with a degree of polymerization of about 13, and are the external chains.
B-chains contain at least one branch, namely, A- and/or B-chain, are longer than A-chains, and are present in the inner part of the molecule. B-chains are in turn divided into B1-chains, with a polymerization degree of about 22, B2-chains, with a polymerization degree of about 42, B3-chains, with a polymerization degree of about 69, B4 and so on.
C-chain is the B-chain which carries the sole reducing end.
A-chains and B1-chains participate in the formation of the clusters, while B2-, B3-, and B4-chains are thought to extend through two, three, and four clusters, respectively.[7][11]
A-type, B-type and C-type polymorphs
Within the clusters, neighboring linear chain segments form double helices, which run parallel to each other, with a period of 2.1 nm, and where each turn has six glucose molecules per chain.[10] The double helices form two types of crystalline structures called A-type polymorph, more dense and typical of cereal grains, and B-type polymorph, with a hexagonal structure, less dense, more hydrated, and typical of tuber and high amylose starches. Finally, C-type polymorph is a mixture of A-type and B-type polymorphs, and is found in the starches of root, legume and some fruits.[2]
This organization underlies the semi-crystalline nature of starch granules.
Growth rings
Although starch granules have different shapes, their internal architecture is remarkably conserved between different species. In fact, when viewed under a microscope, most starches exhibit a regular pattern of light and dark rings known as growth rings, so called because they resemble the growth rings of trees.[10]
The growth rings surround the hilum of the granule, namely, the core of the granule, whose exact structure is not known, although it appears to be formed by a relatively disordered alpha-glucan structure. The rings have a thickness of 200-400 nm, and are the result of alternating amorphous regions, less dense, and semi-crystalline regions, more dense.[10]
According to the cluster model, the semi-crystalline regions are due to the alternation of crystalline and amorphous lamellae, stacked with a periodicity of about 9-10 nm.[11] The crystalline lamellae are made up by the linear chains of amylopectin arranged to form the A-type, B-type or C-type polymorphs, and extend for about 6-7 nm, while the amorphous lamellae contain most of the branch points and extend for about 3nm.[5]
Amylopectin synthesis
The synthesis of amylopectin is believed to start from the hilum.[22]
The synthesis requires the coordinated activities of at least four distinct groups of enzymes: starch synthases, starch phosphorylase, starch branching enzymes and starch debranching enzymes.[12] Each group consists of several isoforms with distinct biochemical properties.
Like amylose synthesis, amylopectin synthesis requires short malto-oligosaccharides or MOS, α-(1→4)-glucans with a degree of polymerization of 2 to 7, which, acting as primers, are elongated by starch synthase, similarly to what happen with glycogenin in the initial steps of glycogen synthesis.[16]
MOS seem to have different origins, all of which require the activity of some enzymes involved in the synthesis of starch granules, namely:
starch synthase III and starch phosphorylase, the latter in combination with the disproportionating enzyme (EC 2.4.1.25), which use ADP-glucose and glucose-1-phosphate as substrates, respectively;
starch debranching enzymes, during the trimming of other amylopectin molecules.[16]
As MOS are poor solubility in aqueous environments, they seem to be able to evade the hydrolytic action of alpha-amylase (EC 3.2.1.1) and beta-amylase (EC 3.2.1.2).
The coordination, both spatial and temporal, of the involved enzymes, which in many cases also physically interact to form multienzyme complexes, is essential to allow the conversion of photosynthetic reaction products into the organized and insoluble structure of the polysaccharide. And, as in the case of amylose and glycogen synthesis, the polymerization of glucose into amylopectin, and more generally of osmotically active monosaccharides into osmotically inactive polysaccharides allows the storage of large amounts of monosaccharides inside the cell without any substantial increase in osmotic pressure.
Starch synthase
Six isoforms of starch synthase are known, all structurally related, of which five are involved in amylopectin synthesis, isoforms referred to as starch synthase I, II, III, IV and V or SSI, SSII, SSIII, SSIV and SSV, respectively, present in the stroma of plastids or portioned between the stroma and starch granules, whereas the sixth, the granule-bound starch synthase or GBSS (EC 2.4.1.242), is almost exclusively bound to granules and is involved in the synthesis of amylose.[10]
The first four isoforms have catalytic activity and belong, like GBSS, glycogen phosphorylase (EC 2.4.1.1) and glycogen synthase (EC 2.4.1.11), enzymes involved in glycogenolysis and glycogen synthesis, respectively, to the family of glycosyltransferases (EC 2.4). Conversely, starch synthase V has no catalytic activity.
During amylopectin synthesis, starch synthase catalyzes the adding of one glucose residue to the non-reducing end of a pre-existing α-(1→4) linked glucan chain. The monosaccharide is linked by a α-(1→4) glycosidic bond.[5]
Note that, unlike glycogen synthase, starch synthase uses ADP-glucose and not UDP-glucose as the glucosyl donor.
The mode of action of starch synthase I, II, III, and IV is different from that of GBSS in that they are able to catalyze the addition of only one glucose unit per substrate encounter, a mode of action defined as distributive, whereas GBSS is able to catalyze the addition of more than one glucose unit per substrate encounter, a mode of action defined as processive.[17]
Roles of starch synthases
The initial steps of amylopectin synthesis, as well as the formation of a normal starch granule, require the presence of SSIV, although SSIII also appears to play a role, overlapping its action with that of SSIV.[16]
Like GBSS, SSIV requires the presence of a protein of the PTST family, PTST2, which has no catalytic activity, but is able, thanks to the presence of a specific domain able to bind carbohydrates, to facilitate the binding of the enzyme to alpha-glucans. SSIV is also able to dimerize, an important feature both for the catalytic activity and the ability to interact with other proteins.
According to a model of PTST2 action, the protein, by means of the domain able to bind to carbohydrates, recognizes and forms a complex with MOS having a specific three-dimensional helical shape. In turn, the protein-MOS complex interacts with a SSIV dimer, which is now able to catalyze the elongation of the alpha-glucan, while PTST2 is released so as to allow it to bind another malto-oligosaccharide and facilitate its subsequent interaction with another SSIV dimer.[15]
The action of SSIV is followed by that of the other isoforms of starch synthase. SSI catalyzes the elongation of malto-oligosaccharides with a degree of polymerization of 6 to 7, to form oligosaccharides with a degree of polymerization of 8 to 12, which, in turn, are excellent substrates for SSII, which catalyzes the synthesizes of chain with a degree of polymerization of 12 to 30. These alpha-glucans are further elongated by SSIII, to give linear chains with a degree of polymerization greater than 30.[12] Thus, SSIII appears to act not only in the initial steps of starch granule synthesis, but also in the later steps.
SSIV and SSV appear to be necessary for the synthesis of a regular number of starch granules of normal morphology.[1][16]
Starch branching enzymes
Starch branching enzymes catalyze the formation of α-(1→6) glycosidic bonds, therefore creating branch points in the linear chain of alpha-glucans, of which the main ones are glycogen and amylopectin.[20] Their action increase the number of non-reducing ends, which act as acceptors of glucose units in the elongation reactions.[14]
SBEs catalyze the hydrolytic cleavage of an α-(1→4) bond within an alpha-glucan chain, releasing an oligosaccharide whose reducing end is then linked to the hydroxyl group at C6 position of a glucosyl unit of a alpha-glucan chain. Therefore, the two chains are linked by α-(1→6)-glycosidic bond.
The chain to which the oligosaccharide is linked can be the same one from which it was detached, and in this case we speak of intra-chain transfer, or a different chain, and in this case we speak of inter-chain transfer. Among the factors determining the type of transfer there seems to be the relative concentration of the linear α-(1→4) chains. In particular, it appears that closely associated chains, such as in the double helices in the clusters, promote inter-chain transfer.[19] Finally, it seems that the interaction between starch synthase I and starch branching enzyme is crucial in determining the bimodal chain length distribution observed in plant starches.
Starch branching enzyme isoforms
Two isoforms of the starch branching enzyme are present in plants, referred to as SBEI and SBEII.
Encoded by different genes, they have distinct biochemical properties, which suggests that they play different roles in determining the structure of amylopectin and amylose.[17]
SBEI appears to be expressed more in storage tissues, suggesting a significant role in determining the structural properties of storage starches, shows a substrate preference for amylose, and is able to transfer oligosaccharides with a degree of polymerization greater than 30, although most are between 10 and 13.[6] It also appears to be involved in the synthesis of super-long, or extra long, chains of amylopectin, whereas its other contributions to the structure of amylopectin appear to be less important. Not all plants express SBEI; for example, Arabidopsis and Canola (Brassica napus L.), which are oil-storing plants, have only SBEII and starch is present only in photosynthetic tissues.
SBEII is mostly expressed in grasses and cereals, and many other plants. Its loss causes important alterations in the architecture of amylopectin and reduce starch content. The enzyme shows a substrate preference for amylopectin and transfers oligosaccharides with a degree of polymerization of 6 to 14. In cereals and grasses, there are two tissue-specific isoforms encoded by distinct genes, termed SBEIIa, mainly present in the leaves, and SBEIIb, mainly present in the endosperm.[17]
Starch debranching enzymes
Starch debranching enzymes catalyze the hydrolysis of α-(1→6) glycosidic bonds, and are member of the alpha-amylase superfamily.
Two types of debranching enzymes are present in plants: isoamylases (EC 3.2.1.68) and pullulanases (EC 3.2.1.41).[8] Isoamylases acts on amylopectin and other polyglucans, whereas pullulanases debranch amylopectin and pullulan, a fungal polysaccharide. Isoamylase and pullulanase differ in substrate specificity as well, as they act on branches composed of at least three and two glycosidic residues, respectively.[18]
During starch granule formation, starch debranching enzymes play a crucial role in determining the water-insoluble properties and fine structure of amylopectin. Indeed, the enzyme activity is thought to allow the clustering of remaining branches, thus promoting interactions between adjacent chains and alpha-helix formation, which in turn appears to be important for the formation of the semi-crystalline structures of amylopectin, and then of starch.[17] In the semi-crystalline structure, the branches are presumably inaccessible to the action of starch debranching enzymes, alpha-amylase and beta-amylase.
Starch debranching enzymes are used industrially in the production of resistant starch and cyclodextrins, which are cyclic oligosaccharides.
Starch phosphorylase
The enzyme belongs, like starch synthases, to the family of glycosyltransferases, and is a phosphorylase which resembles glycogen phosphorylase. In plants, it is present in at least two isoenzymatic forms, Pho1, which is found in the stroma of plastids, and is thought to be the true starch phosphorylase involved in starch synthesis, and Pho2, isoform with cytosolic localization.[4]
Starch phosphorylase is thought to be involved in the initial steps of starch synthesis, catalyzing the reversible transfer of glucosyl units to an alpha-glucan, to which they are linked by a α-(1→4) glycosidic bond.[3] Unlike starch synthases, starch phosphorylase uses glucose-1-phosphate and not ADP-glucose as the glucosyl donor.[4]
Phosphorylation of amylopectin
Amylopectin, similarly to glycogen, binds phosphate groups in variable amounts depending on the botanical origin of the starch. For example, potato starch has a relatively high content of phosphate groups, with a degree of substitution of about 0.1 to 0.3 percent, whereas cereal endosperm starches have a phosphate content generally lower than 0.01 percent.[9]
The phosphorylations of amylopectin are catalyzed by two dikinases present in plastids: alpha-glucan water dikinase (EC 2.7.9.4) and phospho-glucan water dikinase (EC 2.7.9.5). These enzymes transfer the beta-phosphate group of ATP to a glucosyl unit of an alpha-glucan chain, while the gamma-phosphate group is transferred to water. Specifically, alpha-glucan water dikinase catalyzes the phosphorylation of the hydroxyl group at C6 position, whereas phospho-glucan water dikinase catalyzes the phosphorylation of the hydroxyl group at C3 position, generally of a prephosphorylated glucan chain.[13] About two thirds of the phosphate groups are bound at the C6 position, while about 20-30% at the C3 position. Phosphate groups are also present at the C2 position, although in a small percentage compared to the other positions. The enzyme which catalyze this phosphorylation in not known.
With regard to substrate specificity, it seems that phosphorylations accumulate more easily on longer chains. Furthermore, it seems to exist an inverse correlation between the total phosphate content and the frequency of amylopectin branching.
The negative charges carried by the phosphate groups cause the mutual repulsion between neighboring phosphorylated oligosaccharides. These repulsions appear to allow the opening and hydration of the chains, thus affecting the activity of the biosynthesis enzymes and making the chains more susceptible to attack by amylases as well.[21]
Amylose/amylopectin ratio
Starch granules are made up mostly of amylopectin and amylose.[12] The two polysaccharides are present in varying percentages, with amylose making up no more than 35 percent of the dry weight of the granule.[5] However, there are plants whose starch granules consist mostly, or almost exclusively, of amylopectin, and whose starches are defined as waxy starches, and plants whose starch granules consist mostly, or almost exclusively, of amylose.[19]
The amylose/amylopectin ratio influences the physicochemical properties of starch, such as the ability to absorb water, gelatinization, retrogradation, or resistance to enzymatic hydrolysis, the latter important in establishing the rate with which, during carbohydrate digestion, amylose and amylopectin are hydrolyzed to maltose and maltotriose by alpha-amylase.[3] Therefore, the amylose/amylopectin ratio influences the effects of the different types of starch on health, as well as their industrial uses.
References
^ ab Abt M.R., Pfister B., Sharma M., Eicke S., Bürgy L., Neale I., Seung D., Zeeman S.C. STARCH SYNTHASE5, a noncanonical starch synthase-like protein, promotes starch granule initiation in Arabidopsis. Plant Cell 2020;32(8):2543-2565. doi:10.1105/tpc.19.00946
^ ab Cornejo-Ramírez Y.I., Martínez-Cruz O., Del Toro-Sánchez C.L., Wong-Corral F.J., Borboa-Flores J. & Cinco-Moroyoqui F.J. The structural characteristics of starches and their functional properties. CYTA J Food 2018;16(1):1003-1017. doi:10.1080/19476337.2018.1518343
^ abcd Crofts N., Abe N., Oitome N.F., Matsushima R., Hayashi M., Tetlow I.J., Emes M.J., Nakamura Y., Fujita N. Amylopectin biosynthetic enzymes from developing rice seed form enzymatically active protein complexes. J Exp Bot 2015;66(15):4469-82. doi:10.1093/jxb/erv212
^ ab Cuesta-Seijo J.A., Ruzanski C., Krucewicz K., Meier S., Hägglund P., Svensson B., Palcic M.M. Functional and structural characterization of plastidic starch phosphorylase during barley endosperm development. PLoS One 2017;12(4):e0175488. doi:10.1371/journal.pone
^ abc Gous P.W., Fox G.P. Review: Amylopectin synthesis and hydrolysis – Understanding isoamylase and limit dextrinase and their impact on starch structure on barley (Hordeum vulgare) quality. Trends Food Sci Technol 2017;62:23-32. doi:10.1016/j.tifs.2016.11.013
^ Guan H.P., Preiss J. Differentiation of the properties of the branching isozymes from maize (Zea mays). Plant Physiol 1993;102(4):1269-1273. doi:10.1104/pp.102.4.1269
^ ab Li G., Yacine Y., Zhu F. Relationships between supramolecular organization and amylopectin fine structure of quinoa starch. Food Hydrocoll 2021;117:106685. doi:10.1016/j.foodhyd.2021.106685
^ Møller M.S., Henriksen A., Svensson B. Structure and function of α-glucan debranching enzymes. Cell Mol Life Sci. 2016;73(14):2619-41. doi:10.1007/s00018-016-2241-y
^ Nitschke F., Wang P., Schmieder P., Girard J.M., Awrey D.E., Wang T., Israelian J., Zhao X., Turnbull J., Heydenreich M., Kleinpeter E., Steup M., Minassian B.A. Hyperphosphorylation of glucosyl C6 carbons and altered structure of glycogen in the neurodegenerative epilepsy Lafora disease. Cell Metab 2013;17(5):756-67. doi:10.1016/j.cmet.2013.04.006
^ abcd Pfister B., Zeeman S.C. Formation of starch in plant cells. Cell Mol Life Sci 2016;73(14):2781-807. doi:10.1007/s00018-016-2250-x
^ ab Pfister B., Zeeman S.C., Rugen M.D., Field R.A., Ebenhöh O., Raguin A. Theoretical and experimental approaches to understand the biosynthesis of starch granules in a physiological context. Photosynth Res 2020;145:55-70. doi:10.1007/s11120-019-00704-y
^ abcd Qu J., Xu S., Zhang Z., Chen G., Zhong Y., Liu L., Zhang R., Xue J., Guo D. Evolutionary, structural and expression analysis of core genes involved in starch synthesis. Sci Rep 2018;8(1):12736. doi:10.1038/s41598-018-30411-y
^ Ritte G., Heydenreich M., Mahlow S., Haebel S., Kötting O., Steup M. Phosphorylation of C6- and C3-positions of glucosyl residues in starch is catalysed by distinct dikinases. FEBS Lett 2006;580(20):4872-6. doi:10.1016/j.febslet.2006.07.085
^ Sawada T., Nakamura Y., Ohdan T., Saitoh A., Francisco P.B. Jr, Suzuki E., Fujita N., Shimonaga T., Fujiwara S., Tsuzuki M., Colleoni C., Ball S. Diversity of reaction characteristics of glucan branching enzymes and the fine structure of α-glucan from various sources. Arch Biochem Biophys 2014;562:9-21. doi:10.1016/j.abb.2014.07.032
^ Seung D., Boudet J., Monroe J., Schreier T.B., David L.C., Abt M., Lu K.J., Zanella M., Zeeman S.C. Homologs of PROTEIN TARGETING TO STARCH control starch granule initiation in Arabidopsis leaves. Plant Cell 2017;29(7):1657-1677. doi:10.1105/tpc.17.00222
^ abcd Szydlowski N., Ragel P., Raynaud S., Lucas M.M., Roldán I., Montero M., Muñoz F.J., Ovecka M., Bahaji A., Planchot V., Pozueta-Romero J., D’Hulst C., Mérida A. Starch granule initiation in Arabidopsis requires the presence of either class IV or class III starch synthases. Plant Cell 2009;21(8):2443-57. doi:10.1105/tpc.109.066522
^ abcdefg Tetlow I.J., Bertoft E. A review of starch biosynthesis in relation to the building block-backbone model. Int J Mol Sci 2020;21(19):7011. doi:10.3390/ijms21197011
^ Xia W., Zhang K., Su L., Wu J. Microbial starch debranching enzymes: developments and applications. Biotechnol Adv 2021;50(3):107786. doi:10.1016/j.biotechadv.2021.107786
^ ab Wang J., Hu P., Lin L., Chen Z., Liu Q., Wei C. Gradually decreasing starch branching enzyme expression is responsible for the formation of heterogeneous starch granules. Plant Physiol 2018;176(1):582-595. doi:10.1104/pp.17.01013
^ Wilkens C., Svensson B., Møller M.S. Functional roles of starch binding domains and surface binding sites in enzymes involved in starch biosynthesis. Front Plant Sci 2018;9:1652. doi:10.3389/fpls.2018.01652
^ Zhou W., He S., Naconsie M., Ma Q., Zeeman S.C., Gruissem W. & Zhang P. Alpha-glucan, water dikinase 1 affects starch metabolism and storage root growth in Cassava (Manihot esculenta Crantz). Sci Rep 2017;7:9863 doi:10.1038/s41598-017-10594-6
^ Ziegler G.R., Creek J.A., Runt J. Spherulitic crystallization in starch as a model for starch granule initiation. Biomacromolecules 2005;6(3):1547-54. doi:10.1021/bm049214p
Hypertension is defined as a mean resting arterial pressure of 140/90 mm Hg or higher and/or current use of antihypertensive drugs.
It is the most common public health problem in developed countries.
Often referred to as the “silent killer”, as affected individuals may be asymptomatic for many years and then suffer a fatal heart attack, it is a major risk factor for developing coronary artery disease, myocardial infarction, heart failure, stroke, and a leading cause of morbidity and mortality. However, among the risk factors for cardiovascular disease, it is the most modifiable.
It is often classified as primary or essential hypertension and secondary hypertension.
Primary hypertension, responsible for about 95 percent of cases, is probably the consequence of environmental factors, genetic factors, and their interaction. Among the environmental factors, diet plays a central role. Among the genetic factors, interest has focused on factors influencing the blood pressure response to salt intake, and several genotypes have been identified, many of which influence the renin-angiotensin-aldosterone system or renal salt handling.
Secondary hypertension is due to other diseases, usually endocrine, such as hyperthyroidism, hyperaldosteronism, and Cushing’s syndrome.
Above-optimal blood pressure levels, not yet in the hypertensive or prehypertensive range, confers an increased risk of cardiovascular disease, as shown by the fact that nearly one-third of blood pressure-related deaths from coronary heart disease are estimated to occur in non-hypertensive individuals with systolic blood pressure of 120-139 mm Hg, or diastolic blood pressure of 80-89 mm Hg. This means that the risk of cardiovascular disease increases throughout the blood pressure range, starting from 115/75 mm Hg.
Category
Blood pressure (mm Hg)
Systolic
Diastolic
Optimal
< 120
< 80
Normal
< 130
< 85
Normal Hight
130 – 139
85 – 89
Grade 1 hypertension
140 – 159
90 – 99
Grade 2 hypertension
160 – 179
100 – 109
Grade 3 hypertension
≥180
≥110
Isolated systolic hypertension
≥140
≤ 90
Finally, pre-hypertensive individuals have a high risk, about 90%, of developing hypertension over time, although the transition is not inevitable.
Age-related hypertension
The prevalence of hypertension increases with increasing age, as shown by the fact that more than half of the adult population over 60 years old is hypertensive. Age-related risk is a function of variables such as weight gain, low physical activity, excessive use of salt, fats and saturated fatty acids, alcohol, hypercholesterolemia, and low intake of fruits and vegetables, rather than of aging per se. For example, studies of vegetarians living in industrialized countries have shown that such dietary habits are associated with a lower increase in blood pressure with increasing age, and with a markedly lower blood pressure compared to non-vegetarians.
Hypertension and childhood
According to a study conducted by a team of researchers from Johns Hopkins University, prevention of hypertension starts in childhood.
Furthermore, a meta-analysis on studies from diverse populations, studies published between January 1970 and July 2006, have examined the tracking of blood pressure from childhood to adulthood showing that childhood blood pressure is associated with blood pressure in later life, and that a high values in childhood are likely to help predict hypertension in adulthood.
Finally, other studies have also shown that increased blood pressure among children is related to the growing obesity epidemic.
How to prevent hypertension
A downward trend in blood pressure has been documented in the USA over the last two decades, and the adoption of healthy lifestyle have contributed to this trend.
Lifestyle modifications that effectively lower blood pressure are:
reduce the intake of salt and other forms of sodium;
follow a diet rich in fresh fruit, vegetables, complex carbohydrates and low-fat dairy products;
increase potassium intake by consuming fruit, vegetables and legumes;
lose body weight if overweight, or prevent weight gain among those who are thin;
increase physical activity of low or moderate intensity;
stop smoking;
These changes are the first line of defense in preventing high blood pressure, and need not be made one at a time: the best results are achieved when they occur simultaneously, as demonstrated by two studies in which multicomponent interventions lowered blood pressure in hypertensive and nonhypertensive individuals.
Finally, it has been demonstrated that there is also a relationship between alcohol and hypertension.
Role of potassium intake
Potassium, an essential nutrient for humans, is the most abundant cation in intracellular fluids. It is therefore widely distributed in foods that come from living tissues, both animal and vegetable, but which have not undergone salting and/or drying. Cooking methods tend to lower the amount of potassium, as well.
Considering vegetables, the worst cooking method is boiling in plenty of water, for more than an hour, whereas the best is microwave cooking.
Potassium
Content
>250 mg/100 g
Legumes
Dried legumes, such as chickpeas, beans, lentils, peas, and soybeans, and fresh beans.
Meat and fish products, both fresh and preserved; the latter should be avoided because of their high sodium content.
A high dietary potassium intake and blood pressure are inversely correlated, as demonstrated by animal studies, observational epidemiological studies, clinical trials, controlled feeding studies, such as the DASH Study and the OmniHeart trial, and meta-analysis. Furthermore, a high potassium intake also increases urinary sodium excretion.
The optimal strategy for increasing potassium intake is to consume foods naturally rich in the mineral, such as seasonal fruit and vegetables, and legumes, typical foods of the Mediterranean diet. It is therefore not difficult to reach the recommended daily intake, for the healthy population, equal to 4.7 g per day.
Role of sodium intake
Sodium is the most abundant cation in extracellular fluids, of which it strongly affects the osmotic pressure values.
There are three main source of sodium.
The most intuitive source is table salt, which represents up to 20 percent of the daily intake. It is important to note the terms salt and sodium are often used interchangeably, but this is incorrect. On a weight basis, salt is 40 percent sodium and 60 percent chlorine.
A second source is salt or sodium compounds added during food preparation or processing. Between 35 to 80 percent of the daily sodium intake comes from processed foods such as:
processed, smoked or cured meat and fish;
meat extracts, savory snacks, soy and hot sauce;
pre-package frozen foods;
canned soups and legumes;
cheeses, especially long-ripened cheeses.
There are also many sodium-based food additives, often used as preservatives and flavour enhancers.
The third source is negligible, namely, the sodium naturally present in foods, generally low in fresh foods.
A high sodium intake contributes to the increase in blood pressure and the development of hypertension. This is supported by many epidemiological, animal, and migration studies, and meta-analysis, with the final evidence coming from carefully controlled dose-response studies. Furthermore, in primitive societies, where sodium intake is very low, people rarely develop hypertension, and blood pressure does not increase with increasing age.
Therefore, a reduction in sodium intake is recommended to prevent the development of hypertension. In view of the available food supply and the high daily sodium intake, a reasonable recommendation may be to limit its intake to 2.3 g per day, equal to 5.8 g per day of salt. How can this level be achieved?
Using as little salt as possible when preparing food.
Avoiding adding salt at the table.
Avoiding highly salted, processed foods.
Clinical studies have documented that a reduced sodium intake is able to lower blood pressure even the setting of antihypertensive therapy, and can facilitate hypertension control.
Some components of the diet may modify the blood pressure response to sodium. A high dietary intake of foods rich in potassium and calcium may prevent or attenuate the increase in blood pressure for a given increase in sodium intake. Conversely, some data, mainly observed in animal models, suggest that a high sucrose intake could enhance salt sensitivity of blood pressure.
Note: high sodium intakes may contribute to the development of osteoporosis by increasing renal calcium excretion, particularly if daily calcium intake is low.
Role of body weight
Body weight, especially overweight and obesity, is a determinant of blood pressure at any age. Indeed:
it has been estimated that the risk of developing high blood pressure is two to six times greater in overweight people than in normal weight people;
there is a linear correlation between blood pressure and body weight or body mass index, which, if greater than 27, correlates with an increase in blood pressure;
even when sodium intake is held constant, the correlation between change in weight and change in blood pressure is linear;
60 percent of hypertensive subjects are more than 20 percent overweight;
the central distribution of body fat, as a determinant of blood pressure, with a waist circumference greater than 88 cm in women and 102 in men, is more important than the peripheral distribution of fat, both in men and women;
weight loss, in both hypertensive and normotensive subjects, may reduce blood pressure, and the reduction occurs before, and without, achieving a desirable body weight.
Role of physical activity
Physical activity produces a drop in systolic and diastolic blood pressure. Therefore, for the primary prevention of hypertension, it is important to increase physical activity of low or moderate intensity for 30-45 minutes 3-4 times a week up to an hour most days, as recommended by the World Health Organization. Conversely, less active people are 30 to 50 percent more likely to develop hypertension than active people.
References
Appel L.J., Brands M.W., Daniels S.R., Karanja N., Elmer P.J. and Sacks F.M. Dietary approaches to prevent and treat HTN: a scientific statement from the American Heart Association. Hypertension 2006;47:296-08. doi:10.1161/01.HYP.0000202568.01167.B6
Bibbins-Domingo K., Chertow G.M., Coxson P.G., Moran A., Lightwood J.M., Pletcher M.J., and Goldman L. Projected effect of dietary salt reductions on future cardiovascular disease. N Engl J Med 2010;362:590-9. doi:10.1056/NEJMoa0907355
Cappuccio FP. Overview and evaluation of national policies, dietary recommendtions and programmes around the world aiming at reducing salt intake in the population. World Health Organization. Reducing salt intake in populations: report of a WHO forum and technical meeting. WHO Geneva 2007;1-60.
Chen J, Gu D., Jaquish C.E., Chen C., Rao D.C., Liu D., Hixson J.E., Lee Hamm L., Gu C.C., Whelton P.K. and He J. for the GenSalt Collaborative Research Group. Association between blood pressure responses to the cold pressor test and dietary sodium intervention in a chinese population. Arch Intern Med. 2008;168:1740-1746. doi:10.1001/archinte.168.16.1740
Chen X. and Wang Y. Tracking of blood pressure from childhood to adulthood. A systematic review and meta-regression analysis. Circulation 2008;117:3171-80. doi:10.1161/CIRCULATIONAHA.107.730366
Denton D., Weisinger R., Mundy N.I., Wickings E.J., Dixson A., Moisson P., Pingard A.M., Shade R., Carey D., Ardaillou R., Paillard F., Chapman J., Thillet J. & Michel J.B. The effect of increased salt intake on blood pressure of chimpanzees. Nature Med 1995;10:1009-1016. doi:10.1038/nm1095-1009
Ford E.S., Ajani U.A., Croft J.B., Critchley J.A., Labarthe D.R., Kottke T.E., Giles W.H, and Capewell S. Explaining the decrease in U.S. deaths from coronary disease, 1980-2000. N Engl J Med 2007;356:2388-98. doi:10.1056/NEJMsa053935
Geleijnse J.M., Witteman J.C., den Breeijen J.H., Hofman A., de Jong P., Pols H.A. and Grobbee D.E. Dietary electrolyte intake and blood pressure in older subjects: the Rotterdam Study. J Hyperten 1996;14:73741. doi:10.1097/00004872-199606000-00009
Gutiérrez O.M. Sodium- and phosphorus-based food additives: persistent but surmountable hurdles in the management of nutrition in chronic kidney disease. Adv Chronic Kidney Dis 2013;20(2):150-6. doi:10.1053/j.ackd.2012.10.008
Harlan W.R. and Harlan L.C. Blood pressure and calcium and magnesium intake. In: Laragh J.H., Brenner B.M., eds. Hypertension: pathophysiology, diagnosis and management. 2end ed. New York: Raven Press 1995;1143-1154
He F.J., Tan M., Ma Y., MacGregor G.A. Salt reduction to prevent hypertension and cardiovascular disease: JACC state-of-the-art review. J Am Coll Cardiol 2020;75(6):632-647. doi:10.1016/j.jacc.2019.11.055
Holmes E., Loo R.L., Stamler J., Bictash M., Yap I.K.S., Chan Q., Ebbels T., De Iorio M., Brown I.J., Veselkov K.A., Daviglus M.L., Kesteloot H., Ueshima H., Zhao L., Nicholson J.K. and Elliott P. Human metabolic phenotype diversity and its association with diet and blood pressure. Nature 2008;453:396-400. doi:10.1038/nature06882
Nugroho P., Andrew H., Kohar K., Noor C.A., Sutranto A.L. Comparison between the world health organization (WHO) and international society of hypertension (ISH) guidelines for hypertension. Ann Med 2022;54(1):837-845. doi:10.1080/07853890.2022.2044510
Sesso H.D., Cook N.R., Buring J.E., Manson J.E. and Gaziano J.M. Alcohol consumption and the risk of hypertension in women and men. Hypertension 2008;51:1080-1087. doi:10.1161/HYPERTENSIONAHA.107.104968
Simpson F.O. Blood pressure and sodium intake. In: Laragh J.H., Brenner B.M. eds. Hypertension: pathophysiology, diagnosis and management. 2end ed. New York: Raven Press 1995;273-281
Stone M.S., Martyn L., Weaver C.M. Potassium intake, bioavailability, hypertension, and glucose control. Nutrients 2016;8(7):444. doi:10.3390/nu8070444
Strazzullo P., D’Elia L., Kandala N. and Cappuccio F.P. Salt intake, stroke, and cardiovascular disease: meta-analysis of prospective studies. BMJ 2009;339:b4567. doi:10.1136/bmj.b4567
Tzoulaki I., Brown I.J., Chan Q., Van Horn L., Ueshima H., Zhao L., Stamler J., Elliott P., for the International Collaborative Research Group on Macro-/Micronutrients and Blood Pressure. Relation of iron and red meat intake to blood pressure: cross sectional epidemiological study. BMJ 2008;337:a258. doi:10.1136/bmj.a258
Unger T., Borghi C., Charchar F., Khan N.A., Poulter N.R., Prabhakaran D., Ramirez A., Schlaich M., Stergiou G.S., Tomaszewski M., Wainford R.D., Williams B., Schutte A.E. 2020 International society of hypertension global hypertension practice guidelines. hypertension 2020;75(6):1334-1357. doi:10.1161/HYPERTENSIONAHA.120.15026
Weinberger M.H. The effects of sodium on blood pressure in humans. In: Laragh J.H., Brenner B.M., eds. Hypertension: pathophysiology, diagnosis and management. 2end ed. New York: Raven Press 1995;2703-2714.
Writing Group of the PREMIER Collaborative Research Group. Effects of comprehensive lifestyle modification on blood pressure control: main results of the PREMIER Clinical Trial. JAMA 2003;289:2083-2093. doi:10.1001/jama.289.16.2083
World Health Organization, International Society of Hypertension Writing Group. 2003 World Health Organization (WHO)/ISH statement on management of HTN. Guidelines and recommendations. J Hyperten 2003;21:1983-92. doi:10.1097/00004872-200311000-00002
And dietary cholesterol?
There is not a direct correlation between blood cholesterol and cholesterol intake. Dietary cholesterol may increase plasma cholesterol only when it is consumed with trans fats and saturated fatty acids.
However, if you want to reduce your cholesterol intake, we advise to reduce the use of animal products and/or use semi-skimmed or skimmed milk, light cheese, light yogurt, and lean meat.
A risky factor for hypercholesterolemia is a high intake of saturated fatty acids, a group of lipids that can be easily used for the endogenous synthesis of cholesterol.
These fatty acids are present in meat, diary products, and in abundance in vegetal fats and oils, such as margarine, palm oil, palm seed oil, and coconut oil, which are much used in the confectionery industry.
What to do:
to eliminate the visible fat of meat, or buy lean cuts;
to replace whole milk, butter, fat cheese, creams, and ice-creams with products which contain less fat, such as low-fat yogurt, semi-skimmed or skimmed milk, low-fat cheeses;
to avoid confectionery products.
Trans fatty acids
Trans fatty acids or trans fats are an extremely risky factor, and not only for hypercholesterolemia.
Studies have observed a high atherogenic potential caused by changes in plasmatic lipoproteins, where a decrease of HDL levels, and an increase of LDL and triglyceride levels occur.
Where can they be found?
In a lot of foods for kids.
In baked industrial products, such as crackers, breadsticks, cakes, packed bread, and snacks.
In a lot of industrial foods, such as soups, ready fresh or frozen meals, and mixtures to prepare pies and pizza.
In bouillon cubes.
In soft candies.
In some corn flakes.
In ice creams, in vegetal substitutes of cream, and in margarine.
In a lot of preserves, jams included.
As regards to the content of saturated and trans fatty acids, there is often no difference between classic products and “natural” or “organic” ones.
What can we do?
To avoid to buy products that contain vegetal fats and/or hydrogenated fatty acids, and to avoid to buy fried products.
Overweight
A significant body fat gain contributes to hypercholesterolemia.
In a lot of people, the decrease in the intake of satured and trans fatty acids doesn’t reduce the cholesterolemia levels till weight starts to drop.
What to do:
to reduce the intake of animal and vegetable fats;
to reduce foods rich in simple sugars, such as sweets, soft drinks, desserts, candies, and cakes;
do not win back calories you have eliminated in the preceding points by an excessive use of extravergin olive oil and starch, namely pasta, potatoes, rice, bread;
to increase the physical activity;
to increase the intake of fruit and vegetables.
Genetic causes
In this case, it needs a drug prescription by physician, which must be however combined with right nutritional advices.
References
Ascherio A., Katan M.B., Zock P.L., Stampfer M.J., Willett W.C. Trans fatty acids and coronary heart disease. N Engl J Med 1999;340:1994-1998. doi:10.1056/NEJM199906243402511
Benito-Vicente A., Uribe K.B., Jebari S., Galicia-Garcia U., Ostolaza H., Martin C. Familial hypercholesterolemia: the most frequent cholesterol metabolism disorder caused disease. Int J Mol Sci 2018;19(11):3426. doi:10.3390/ijms19113426
Fernandez M.L., Murillo A.G. Is there a correlation between dietary and blood cholesterol? Evidence from epidemiological data and clinical interventions. Nutrients 2022;14(10):2168. doi:10.3390/nu14102168
Hu F.B., Willett W.C. Optimal diet for prevention of coronary heart disease JAMA 2002;288:2569-2578. doi:10.1001/jama.288.20.2569
Lichtenstein A.H. Dietary fat, carbohydrate, and protein: effects on plasma lipoprotein patterns J. Lipid Res. 2006;47:1661-1667. doi:10.1194/jlr.R600019-JLR200
Lichtenstein A.H., Ausman L., Jalbert S.M., Schaefer E.J. Effect of different forms of dietary hydrogenated fats on serum lipoprotein cholesterol levels. N Engl J Med 1999;340:1933-1940. doi:10.1056/NEJM199906243402501
Mensink R.P., Katan M.B. Effect of dietary trans fatty acids on high-density and low-density lipoprotein cholesterol levels in healthy subjects. N Engl J Med 1990;323:439-445. doi:10.1056/NEJM199008163230703
Mozaffarian D., Katan M.B., Ascherio A., Stampfer M.J., Willett W.C. Trans fatty acids and cardiovascular disease. N Engl J Med 2006;354:1601-1613. doi:10.1056/NEJMra054035
Shils M.E., Olson J.A., Shike M., Ross A.C.: “Modern nutrition in health and disease” 9th ed., by Lippincott, Williams & Wilkins, 1999
Starch synthase (EC 2.4.1.21) is an enzyme that catalyzes the transfer of glucose molecules from ADP-glucose to the non-reducing end of a pre-existing α-(1→4) linked glucan chain, to which the monosaccharides are linked by an α-(1→4) glycosidic bond.[4]
This enzymatic activity is involved in the synthesis of amylose and amylopectin, the two major constituents of starch, which is the main storage form of carbohydrates in plants.[7]
Starch synthase belongs to the family of glycosyltransferases (EC 2.4), like starch phosphorylase (EC 2.4.1.1), another enzyme involved in starch metabolism, and glycogen synthase (EC 2.4.1.11) and glycogen phosphorylase (EC 2.4.1.1), enzymes involved in glycogen synthesis and glycogen degradation or glycogenolysis, respectively.[6] However, while glycogen synthase uses UDP-glucose as the glucosyl donor, and starch phosphorylase uses glucose 1-phosphate, starch synthase uses ADP-glucose.[2][3]
Six isoforms of starch synthase are known in plants. They are structurally related proteins, with five involved in the synthesis of amylopectin, referred to as starch synthase I, II, III, IV and V, or SSI, SSII, SSIII, SSIV and SSV, respectively, and one involved in the synthesis of amylose, the granule-bound starch synthase (GBSS) (EC 2.4.1.242).[6] GBSS, SSI, SSII, SSIII, and SSIV have catalytic activity, whereas SSV lacks catalytic activity.[1]
GBSS is almost exclusively bound to starch granules and is located mostly within them, as evidenced by treatment of the granule surface with proteases. The other isoforms of starch synthase are present either only in the stroma of the plastids or portioned between starch granules and the stroma, and are called soluble starch synthases.[8]
Starch synthases I, II, III, and IV catalyze the adding of one glucose residue per substrate encounter, a distributive mode of action, whereas GBSS catalyze the addition of more than one glucosidic unit per substrate encounter, a processive mode of action.[11]
Starch synthase and MOS
Starch synthases involved in the early steps of amylose and amylopectin synthesis require short malto-oligosaccharides (MOS) to initiate de novo synthesis of the two polysaccharides.[11]
These small oligosaccharides, namely, α-(1→4)-glucans with a degree of polymerization of 2 to 7, act as primers and are elongated, a function analogous to that performed by glycogenin in glycogen synthesis.
MOS can originate from the activity of starch synthase III, starch phosphorylase, or starch debranching enzymes.
Being poorly water soluble, MOS seem able to evade the hydrolytic action of alpha-amylase (EC 3.2.1.1) and beta-amylase.[8]
Starch synthase and amylopectin synthesis
The synthesis of amylopectin requires the temporally coordinated action of at least four classes of enzymes, namely, starch synthase isoenzymes, starch phosphorylase, starch branching enzymes (EC 2.4.1.18), and starch debranching enzymes.[2][7] It is also believed that, in many cases, these enzymes physically interact with each other to form multienzyme complexes, which are structures capable of increasing the efficiency of a metabolic pathway.[11]
It is generally accepted that the growth of the starch granule occurs from a central core called the hilum, whose precise structure is unknown, although it appears to be formed by a disordered structure of α-glucans.[13] The initiation of the hilum, the formation of a normal starch granule morphology, and the degree of starch accumulation require the presence of SSIV, although it has been suggested that SSIII and SSV may also play a role, overlapping their activity with that of SSIV.[10]
GBSS and amylose synthesis
Granule-bound starch synthase is involved in the synthesis of amylose.
This enzyme was first reported by Luis Federico Leloir in the early 60s, the same researcher who in 1948 had discovered the main pathway for galactose metabolism, the Leloir pathway.[5]
Its catalytic action is not entirely simultaneous with that of the other starch synthases, as it requires the presence of an amylopectin-matrix.[6]
In grasses, the granule-bound starch synthase is present in two isoforms, encoded by distinct genes, and referred to as GBSSI and GBSSII.[12]
GBSS requires, for its catalytic activity, the presence of a protein of the PTST family, PTST1, which allows its binding to the starch granule, and whose action seems to be more important in chloroplasts than in amyloplasts.[9]
PTST1 appears to associate, in the plastid stoma, with GBSS. The complex binds to the nascent starch granule, the protein dissociates from the enzyme, that begins to catalyze the elongation of the malto-oligosaccharides, while the protein returns to the stroma where it recruits another GBSS.
References
^ Abt M.R., Pfister B., Sharma M., Eicke S., Bürgy L., Neale I., Seung D., Zeeman S.C. STARCH SYNTHASE5, a noncanonical starch synthase-like protein, promotes starch granule initiation in Arabidopsis. Plant Cell 2020;32(8):2543-2565. doi:10.1105/tpc.19.00946
^ ab Crofts N., Abe N., Oitome N.F., Matsushima R., Hayashi M., Tetlow I.J., Emes M.J., Nakamura Y., Fujita N. Amylopectin biosynthetic enzymes from developing rice seed form enzymatically active protein complexes. J Exp Bot 2015;66(15):4469-82. doi:10.1093/jxb/erv212
^ Cuesta-Seijo J.A., Ruzanski C., Krucewicz K., Meier S., Hägglund P., Svensson B., Palcic M.M. Functional and structural characterization of plastidic starch phosphorylase during barley endosperm development. PLoS One 2017;12(4):e0175488. doi:10.1371/journal.pone
^ Gous P.W., Fox G.P. Review: Amylopectin synthesis and hydrolysis – Understanding isoamylase and limit dextrinase and their impact on starch structure on barley (Hordeum vulgare) quality. Trends Food Sci Technol 2017;62:23-32. doi:10.1016/j.tifs.2016.11.013
^ Leloir L.F., de Fekete M.A., Cardini C.E. Starch and oligosaccharide synthesis from uridine diphosphate glucose. J Biol Chem 1961;236:636-41. doi:10.1016/S0021-9258(18)64280-2
^ abc Pfister B., Zeeman S.C. Formation of starch in plant cells. Cell Mol Life Sci 2016;73(14):2781-807. doi: 10.1007/s00018-016-2250-x
^ ab Qu J., Xu S., Zhang Z., Chen G., Zhong Y., Liu L., Zhang R., Xue J., Guo D. Evolutionary, structural and expression analysis of core genes involved in starch synthesis. Sci Rep 2018;8(1):12736. doi:10.1038/s41598-018-30411-y
^ ab Seung D., Boudet J., Monroe J., Schreier T.B., David L.C., Abt M., Lu K.J., Zanella M., Zeeman S.C. Homologs of PROTEIN TARGETING TO STARCH control starch granule initiation in Arabidopsis leaves. Plant Cell 2017;29(7):1657-1677. doi:10.1105/tpc.17.00222
^ Seung D., Soyk S., Coiro M., Maier B.A., Eicke S., and Zeeman S.C. PROTEIN TARGETING TO STARCH is required for localising GRANULE-BOUND STARCH SYNTHASE to starch granules and for normal amylose synthesis in Arabidopsis. PLoS Biol 2015;13:e1002080. doi:10.1371/journal.pbio.1002080
^ Szydlowski N., Ragel P., Raynaud S., Lucas M.M., Roldán I., Montero M., Muñoz F.J., Ovecka M., Bahaji A., Planchot V., Pozueta-Romero J., D’Hulst C., Mérida A. Starch granule initiation in Arabidopsis requires the presence of either class IV or class III starch synthases. Plant Cell 2009;21(8):2443-57. doi:10.1105/tpc.109.066522
^ abc Tetlow I.J., Bertoft E. A review of starch biosynthesis in relation to the building block-backbone model. Int J Mol Sci 2020;21(19):7011. doi:10.3390/ijms21197011
^ Vrinten P.L., Nakamura T. Wheat granule-bound starch synthase I and II are encoded by separate genes that are expressed in different tissues. Plant Physiol 2000;122(1):255-64. doi:10.1104/pp.122.1.255
^ Ziegler G.R., Creek J.A., Runt J. Spherulitic crystallization in starch as a model for starch granule initiation. Biomacromolecules 2005;6(3):1547-54. doi:10.1021/bm049214p
The concept of mediterranean diet was developed in the 1950’s by the American physiologist Ancel Benjamin Keys.
Keys first described the relationship between diet and cardiovascular diseases or CVD, in particular thanks to the epidemiological study known as the Seven Countries Study, the first study that highlighted the mediterranean dietary pattern.
The Mediterranean diet, which is recognized as one of the healthiest dietary pattern, is rich in minimally processed plant foods, such as vegetables, legumes, cereals, preferably whole grain, with extra virgin olive oil as the main source of lipids. Therefore, it is a dietary pattern rich in antioxidant compounds, and with anti-inflammatory action.
The Seven Country Study was followed by many other studies that highlighted, in populations of industrialized and non-industrialized countries, the protective role of this dietary pattern not only on CVD but also chronic-degenerative diseases, depressive disorders, as well as a correlation with improvements in learning ability. And it has been shown that greater adherence to the mediterranean diet is associated with improved health status and reduced mortality in general.
For all this, there is no scientific association that support that it is harmful for health.
In addition, thanks to the reduced consumption of meat, mediterranean diet improve public health by contributing to the reduction of greenhouse gas emissions.
Ultimately, the mediterranean diet is a dietary pattern that must be safeguarded and promoted, as opposed to the worldwide trends toward dietary uniformity.
Keys identified the correlation between diet and cardiovascular disease risk in the early 1950s by comparing the rate of CVD occurrence of American business executives, and European populations just out of World War II. While in the former, well nourished subjects, the onset rates were high, in the latter, who were in a phase of food insecurity, the rates were low. These observations led Keys to hypothesize a correlation between dietary fat intake and deaths from cardiovascular diseases.
The subsequent observation of an extremely low frequency of coronary heart disease and certain cancers in the population of the island of Crete, Greece, in much of the rest of Greece population and in southern Italy compared to USA population, led Keys to hypothesize that the diet of those populations, characterized by a low content of animal fats, represented a protection factor, and to initiate the long-term observational study known as the Seven Countries Study, an epidemiological longitudinal study and the best known study on the Mediterranean diet.
This study showed:
an inverse correlation between diet and the risk of death in general and from cardiovascular diseases;
that saturated fats was the major dietary risk factor;
that a Mediterranean-type diet led to a reduction in the risk of developing cardiovascular diseases.
Characteristics of the mediterranean diet
Mediterranean diet is a dietary pattern characterized by the consumption of large quantities of vegetables, legumes, fruits, cereals, preferably whole grain, and extra virgin olive oil, which ensures a good supply of fiber, antioxidants, phytosterols, polyphenols and unsaturated fatty acids.
Regarding products of animal origin, the consumption of meat, especially red meat and red meat products, as well as high-fat dairy products should be limited, whereas fish and seafood should be present.
Ethanol consumption should be moderate, primarily in the form of red wine and during meals.
And in the Greek population segment that participated to EPIC study, extra virgin olive oil, vegetables, legumes, a moderate intake of ethanol, together with a low consumption of meat and meat products are the dominant components predictor of lower mortality.
Cornerstone of the mediterranean diet is extra virgin olive oil. It is an excellent source of monounsaturated fatty acids and contains over 2000 different compounds, many with antioxidant activity. Being the major source of lipids, when associated with a low consumption of high fat animal products, it ensures a high ratio of monounsaturated to saturated fatty acids, which improves lipid profile and glycemic control in diabetics. For a more extensive discussion on this topic the articles “Olive oil: chemical composition” and “Polyphenols in olive oil“.
However, it is misleading to focus on a single element of this eating pattern; it does not exist “the magic bullet” as shown by studies focused on a single element. People don’t eat a single nutrient but a complex of them and, more important, nutrients interact with each other in synergistic or antagonist ways. So, the health benefits of Mediterranean diet are due to all its components.
Mediterranean diet and chronic diseases
After the Seven Countries Study, many studies have shown the effectiveness of this dietary pattern in primary and secondary prevention of the main chronic diseases, from cardiovascular diseases to depressive disorders, as well as a reduction in mortality in general.
Here are some examples.
A meta-analysis have evaluated the association between adherence to the mediterranean diet pattern, mortality, and incidence of diseases, showing that “greater adherence to a Mediterranean Diet is significantly associated with a reduced risk of overall mortality, cardiovascular mortality, cancer incidence and mortality, and incidence of Parkinson’s disease.” (Sofi F. at al. BMJ 2008, see References).
A randomized multicenter study has demonstrated the its efficacy in primary prevention of cardiovascular events in subjects at high cardiovascular risk.
It is related to a lower risk for Alzheimer’s disease and to its subsequent course and outcome: the higher adherence is associated with lower mortality and it is suggested a dose-response effect.
Mounting evidence suggest a protective effect on weight gain.
It has been reported an inverse association between adherence to this dietary pattern and the incidence of type 2 diabetes among initially healthy people and in patients who survived myocardial infarction.
It is associated with a lower prevalence of the metabolic syndrome.
Epidemiological and interventional studies have revealed a protective effect against mild chronic inflammation and its metabolic complications.
There is evidence that adherence to the Mediterranean diet may have a protective role in the prevention of depressive disorders.
Role in the reduction of greenhouse gas emissions
The mediterranean diet is able to improve public health also by contributing to the reduction of greenhouse gas emissions, namely, carbon dioxide or CO2, methane, nitrous oxide and similar, from the livestock sector, responsible for 4/5 of emissions related to agriculture. These emissions are greater than those due to transport, and second only to those of energy production. Adding to this that world population is growing, and that this growth is accompanied by an increase in per capita consumption of meat, with estimates that by 2030 there will be an increase in meat production of 85% compared to 2000, the role of the mediterranean diet in reducing greenhouse gas emissions is even more evident.
Analyzing in detail the greenhouse gas emission from cattle farming, the major contributor of the emissions in the livestock sector:
about 40% comes from the loss of annual plants, grasses and trees that covered the land where the crop is grown;
32% from the methane emissions of animal waste, and by the animals themselves as a result of digestion;
14% from fertilizers to grow feed grain, 16 pounds of grain fodder for every kilogram of meat consumed;
14% from agricultural production generally.
Foods
Distance
Grams of CO2 equivalent
Patatoes
0,17 miles – 300 meters
59
Apples
0.2 miles – 320 meters
68
Asparagus
0.27 miles – 440 meters
91
Chicken
0.73 miles – 1.17 kilometers
249
Pork
2.52 miles – 4.1 kilometers
862
Beef
9.81 miles – 15.8 kilometers
3.360
The table above compares CO2 emission from the production of different foods, considering portions of 225 g, with those from a gasoline car that travels about 12 km per litre of fuel.
So producing 225 grams of beef releases to the atmosphere an amount of greenhouse gases almost 13 times greater than that released producing an equal amount of chicken, and even 57 times greater if we consider potatoes.
To take another example, to produce 41 kilograms of beef, the amount annually consumed by the average American, it releases the same amount of CO2 of a car traveling about 3,000 km.
References
Di Daniele N., Noce A., Vidiri M., Moriconi E., Marrone G., Annicchiarico-Petruzzelli M., D’Urso G., Tesauro M., Rovella V., De Lorenzo A. Impact of Mediterranean diet on metabolic syndrome, cancer and longevity. Oncotarget 2017;8:8947-8979. doi:10.18632/oncotarget
Estruch R., Ros E., Salas-Salvadó J., et al. Primary prevention of cardiovascular disease with a Mediterranean Diet. N Engl J Med 2013;368:1279-1290. doi:10.1056/NEJMoa1200303
Friel S., Dangour A.D., Garnett T., Lock K., Chalabi Z., Roberts I., Butler A., Butler C.D., Waage J., McMichael A.J. and Haines A. Public health benefits of strategies to reduce greenhouse-gas emissions: food and agriculture. Lancet 2009;374:2016-2025. doi:10.1016/S0140-6736(09)61753-0
Giugliano D. and Esposito K. Mediterranean Diet and Cardiovascular Health. Annals NY Acad Sci 2005;1056(1):253-260. doi:10.1196/annals.1352.012
Giugliano D. and Esposito K. Mediterranean diet and metabolic diseases. Curr Opin Lipidol 2008;19:63-68. doi:10.1097/MOL.0b013e3282f2fa4d
Keys A. Mediterranean diet and public health: personal reflections. Am J Clin Nutr 1995;61:1321S-1323S doi:10.1093/ajcn/61.6.1321S
Keys A., Aravanis C., Blackburn H., Buzina R., Djordjevic B.S., Dontas A.S., Fidanza F., Karvonen M.J., Kimura N., Menotti A., Mohacek I., Nedeljkovic S., Puddu V., Punsar S., Taylor H.L., Van Buchem F.S.P. Seven Countries: A Multivariate Analysis of Death and Coronary Heart Disease. Harvard University Press, Cambridge, Harvard University Press, ISBN: 0-674-80237-3, 1980. 381 pp.
Martínez-González M.Á., de la Fuente-Arrillaga C., Nunez-Cordoba J.M., Basterra-Gortari F.J., Beunza J.J., Vazquez Z., Benito S., Tortosa A., Bes-Rastrollo M. Adherence to Mediterranean diet and risk of developing diabetes: prospective cohort study. BMJ 2008;336:1348-1351. doi:10.11bmj.39561.501007.BE
Martín-Peláez S., Fito M., Castaner O. Mediterranean diet effects on type 2 diabetes prevention, disease progression, and related mechanisms. A review. Nutrients 2020;12(8):2236. doi:10.3390/nu12082236
Mentella M.C., Scaldaferri F., Ricci C., Gasbarrini A., Miggiano G.A.D. Cancer and Mediterranean Diet: a review. Nutrients 2019; 11(9):2059. doi:10.3390/nu11092059
Nestle M. Mediterranean diets: historical and research overview. Am J Clin Nutr 1995;61:1313S-1320S doi:10.1093/ajcn/61.6.1313S
Samieri C., Okereke O.I., E. Devore E.E. and Grodstein F. Long-term adherence to the Mediterranean Diet is associated with overall cognitive status, but not cognitive decline, in women. J Nutr 2013;143:493-499. doi:10.3945/jn.112.169896
Sánchez-Villegas A., Delgado-Rodríguez M., Alonso A., Schlatter J., Lahortiga F., Serra Majem L., Martínez-González M.A. Association of the Mediterranean Dietary pattern with the incidence of depression: The Seguimiento Universidad de Navarra/University of Navarra Follow-up (SUN) Cohort. Arch Gen Psychiatry. 2009;66:1090-1098 doi:10.1001/archgenpsychiatry.2009.129
Scarmeas N., Luchsinger J.A., Mayeux R. and Stern Y. Mediterranean diet and Alzheimer disease mortality. Neurology 2007;69(11):1084-1093 doi:10.1212/01.wnl.0000277320.50685.7c
Schröder H. Protective mechanisms of the Mediterranean diet in obesity and type 2 diabetes. J Nutr Biochem 2007;18:149-160. doi:10.1016/j.jnutbio.2006.05.006
Sofi F., Cesari F., Abbate R., Gensini G.F. and Casini A. Adherence to Mediterranean diet and health status: meta-analysis. BMJ 2008;337:a1344. doi:10.1136/bmj.a1344
Subak S. Global environmental costs of beef production. Ecol. Econom. 1999;30:79-91. doi:10.1016/S0921-8009(98)00100-1
Trichopoulou A., Bamia C. and Trichopoulos D. Anatomy of health effects of Mediterranean diet: Greek EPIC prospective cohort study. BMJ 2009;338:b2337. doi:10.1136/bmj.b2337
Trichopoulou A., Costacou T., Bamia C., Trichopoulos D. Adherence to a Mediterranean Diet and Survival in a Greek Population. N Engl J Med 2003;348:2599-2608. doi:10.1056/NEJMoa025039
Amylose is a polysaccharide made up of α-D-glucose units linked by α-(1→4) glycosidic bonds, with few branches connected to the main chain by α-(1→6) glycosidic bonds.[17]
Together with amylopectin, it is one of the two main constituents of the starch, the major storage form of energy and carbohydrates in the Biosphere.[12]
Its synthesis is catalyzed by the enzyme granule-bound starch synthase or GBSS (EC 2.4.1.242), and requires the presence of a second protein, named protein targeting to starch 1 or PTST1, with no catalytic activity.[15]
Inside the starch granule, amylose is embedded within the semi-crystalline matrix formed by amylopectin.[13] Unlike amylopectin, amylose is not necessary for the formation of starch granules, is present in smaller amounts, but it has a great influence on the physicochemical properties of the starch.[7]
Plants have been selected whose starch granules hold negligible amounts or, conversely, very high amounts of amylose. These phenotypes have both industrial applications and potential health benefits.[4][20]
Amylose molecules have a molecular weight of about 106 daltons, are mostly linear and made up of α-D-glucose units, hereinafter referred to as glucose, linked by α-(1→4)-glycosidic bonds, namely, covalent bonds between C-1 of one unit and the hydroxyl group on the C-4 of the next unit.[1] The linear chains are made up of a number of monosaccharides ranging from a few hundred to several thousand; therefore, they are much longer than amylopectin chains.[17]
The few branches are connected to the linear chain by α-(1→6) glycosidic bonds, such as in amylopectin and glycogen, the storage form of carbohydrates in animals. An α-(1→6) glycosidic bond is a covalent bonds between C-1 of one unit and the hydroxyl group on the C-6 of another glucose unit. The number of branches is between 5 and 20, depending on the botanical origin of the starch, and the branches, compared to amylopectin, are not grouped.[6] Studies on the length of the amylose branches have shown a bimodal distribution, with the two fractions termed as:
AM1, which includes the shorter chains, with a degree of polymerization between 100 and 700 daltons;
AM2, which includes the longer chains, with a degree of polymerization between 700 and 40,000 daltons.[19]
A similar bimodal distribution of the length of the branches is also observed for amylopectin, whose fractions are indicated as AP1, shorter and more abundant, and AP2.
The intraspecies variation of the distribution of the AM1 and AM2 fractions is relatively small, whereas it is large between different species, variation that has a genetic basis.[19]
Amylose location in the starch granules
The precise location of amylose in the starch granule is not known, although it is believed that most are found in the amorphous regions. However, some studies have suggested that its localization is not restricted to the amorphous regions, but is also present between amylopectin chains and on the surface of the granules.[13] Hence, amylose could have several locations within the granule.
Synthesis
In plants, the synthesis of amylose is catalyzed by GBSS, one of the six isoforms of starch synthase.[11] The enzyme, whose action is the major determinant of amylose content of starch granules, requires the presence of the PTST1 protein.[15] Amylose branching appears to be carried out by starch branching enzyme or SBE (EC 2.4.1.18).
As in the case of amylopectin synthesis, it is believed that the enzymes involved physically interact to form multienzyme complexes, which are structures able to optimize the efficiency of the process.[17]
Since amylose synthesis requires a pre-existent amylopectin matrix in order to target the granule-bound starch synthase to the starch granules, the synthesis of the two polysaccharides is not entirely simultaneous.[11]
In the initial steps, the granule-bound starch synthase, like the other starch synthases, requires short malto-oligosaccharides or MOS, α-(1→4) glucans with a degree of polymerization of 2 to 7, which act as a primer and are elongated.[17] MOS can originate from various sources, such as the trimming process of nascent amylopectin molecules by starch debranching enzyme, or from the activity of starch phosphorylase (EC 2.4.1.1), another enzyme involved in starch metabolism.[16] As MOS are poorly water soluble, they seem able to evade the hydrolytic action of alpha-amylase (EC 3.2.1.1) and beta-amylase (EC 3.2.1.2), and diffuse within the starch granule matrix where they are elongated by GBSS.[14] Once malto-oligosaccharides are elongated beyond seven glucose residues, they cannot easily diffuse out of the granule, and are further elongated.
Requiring a primer, the early stage of the synthesis of amylose and amylopectin resembles that of glycogen. However, the primer required during glycogen synthesis is the self-glucosylating protein glycogenin.
It should be noted that the polymerization of glucose to amylopectin, amylose, glycogen, and more generally, of osmotically active monosaccharides into osmotically inactive polysaccharides allows the storage of large amounts of osmotically active molecules inside the cell without an increase in osmotic pressure.
Granule-bound starch synthase
GBSS, the other isoforms of starch synthase, and starch phosphorylase belong to the glycosyltransferase family (EC 2.4).[11]
GBSS, discovered by the group of Louis Federico Leloir, who had previously discovered the main pathway for the metabolism of galactose, the Leloir pathway, is the most abundant among proteins associated with starch granules.[9] It is present almost exclusively bound to the granule, unlike the other isoforms of starch synthase which are mostly present in the stroma of the plastids or portioned between starch granules and the stroma. Moreover, the treatment of starch granule surface with proteases showed that the majority of the granule bound starch synthase is present within the granule rather than on its surface, a location consistent with amylose synthesis within the nascent granules.[15]
In grasses, GBSS is present in two isoforms, encoded by distinct genes. The isoforms are known as GBSSI, present in the amyloplasts of storage tissues, therefore non-photosynthetic tissues, and GBSSII, present in the chloroplasts, therefore in photosynthetic tissues, where it takes part in the synthesis of transient starch.[18]
GBSS catalyzes the transfer of a glucose residue from ADP-glucose to the non-reducing end of an α-(1→4)-glucan, to which the glucose residue is joined by an α-(1→4) glycosidic bond.[5]
Notee that starch synthases use ADP-glucose as the glucosyl donor, whereas glycogen synthase, an enzyme involved in glycogen synthesis, uses UDP-glucose.[3]
Granule-bound starch synthase is capable of adding more than one glucose monomer per substrate encounter, a processive mode of action, which differentiates it from the other isoforms of starch synthase, which are capable of adding only one glucose unit per substrate encounter, a distributive mode of action. The processive action allows the synthesis of long linear chains, and seems to be strongly increased by the presence of amylopectin.[17]
PTST1
Amylose synthesis requires the presence of a protein of the PTST family, namely PTST1, which was discovered more than fifty years after GBSS.[15]
PTST1 has no catalytic activity, but allows the binding of GBSS to the starch granule, an activity that seems more important in chloroplasts, and therefore for the synthesis of transient starch, than in amyloplasts. It was proposed that PTST1 associates with the synthase in the plastid stroma, the complex binds to the nascent starch granule, PTST1 dissociates from the enzyme which initiates the synthesis of amylose, while the PTST1 returns to the plastid stroma to recruit another GBSS molecule.
The importance of PTST1 is underlined by the fact that it is conserved throughout the plant kingdom, and its loss causes the enzyme to detach from the nascent starch granule.
Starch branching enzymes
The enzyme that generate the few α-(1→6) linkages present in amylose molecules is not known, although an isoform of the starch branching enzyme, SBEI, may be involved.[13]
SBEI is present mostly in the plastid stroma, whereas only a small proportion is bound to starch granule, and is mostly expressed in the storage tissues. The low branch frequency of the amylose could be due to its synthesis inside the granules, where SBEI is scarcely present, which would protect the nascent molecule from the action of the enzyme.[8]
Amylose/amylopectin ratio
In the starch granules of land plants, amylose is almost always present, in variable percentages, generally between 5-35%.[5] The variability occurs not only between different species, but also within the same species based on the organ or tissue considered, and, in tubers and seeds, based on the stage of development, being the content generally low in the early stages, then increasing until the final value is reached, a pattern consistent with the synthesis of amylose within an amylopectin matrix.[13]
However, there are plants whose amylose content is very low, or even absent. Their starch is referred to as waxy, due to the appearance of the endosperm of the raw grains which resembles wax. Conversely, there are plants with starch granules containing mostly, or entirely, amylose.[20]
Although its role has not yet been clarified, its near-constant presence seems to indicate this polysaccharide plays an important structural role in the starch granule, and provides the plant some advantage in the growth and development phase.[13]
The amylose/amylopectin ratio strongly influences the physicochemical properties of starch, such as its ability to absorb water, which influences processes such as starch retrogradation and gelatinization, or its resistance to enzymatic hydrolysis, which determinates, for example, the rate at which maltose and maltotriose are released during starch degradation by alpha-amylase or beta-amylase.[10] These properties, in turns, are able to affect the industrial applications of starch as well as its effects on health.
High-amylose starches
High-amylose cereals are obtained through enhancing GBSSI gene expression, or suppressing or eliminating the genes encoding for starch branching enzyme, SSIIa, or other enzymes and proteins involved in amylopectin biosynthesis. However, at least in cereal endosperm, the most effective method is the suppression or elimination of one or more starch branching enzyme isoforms.[4][20]
High amylose starches have peculiar physicochemical properties, such as a high gelling strength, an ease retrogradation, and an excellent ability to form films, properties which make them suitable for industrial applications such as the production of biodegradable plastics, paper, and adhesives.[7][10]
High amylose starches are high in resistant starch, which is a starch that escape digestion in the small intestine by alpha-amylase, one of the hydrolases involved in carbohydrate digestion. Studies conducted using foods enriched with resistant starch have shown an improvement in insulin and glycemic responses, as well as a reduction in the risk of developing cardiovascular disease, obesity, and type II diabetes mellitus.[2] How do they work?
Resistant starch, being able to escape intestinal digestion, may low the glycemic index of the foods in which it is found, thus contributing to the regulation of blood glucose levels. Furthermore, once reached the colon, it can be fermented by the bacteria of the gut microbiota, which is part of the human microbiota, with production of short-chain fatty acids, mainly butyric acid, acetic acid, and propionic acid, fatty acids essential for intestinal health.
^ Birt D.F., Boylston T., Hendrich S., Jane J.L., Hollis J., Li L., McClelland J., Moore S., Phillips G.J., Rowling M., Schalinske K., Scott M.P., Whitley E.M. Resistant starch: promise for improving human health. Adv Nutr 2013;4(6):587-601. doi:10.3945/an.113.004325
^ Crofts N., Abe N., Oitome N.F., Matsushima R., Hayashi M., Tetlow I.J., Emes M.J., Nakamura Y., Fujita N. Amylopectin biosynthetic enzymes from developing rice seed form enzymatically active protein complexes. J Exp Bot 2015;66(15):4469-82. doi:10.1093/jxb/erv212
^ ab Funnell-Harris D.L., Sattler S.E., O’Neill P.M., Eskridge K.M., and Pedersen J.F. Effect of waxy (low amylose) on fungal infection of Sorghum grain. Phytopathology 2015;105(6):716-846. doi:10.1094/PHYTO-09-14-0255-R
^ ab Gous P.W., Fox G.P. Review: amylopectin synthesis and hydrolysis – Understanding isoamylase and limit dextrinase and their impact on starch structure on barley (Hordeum vulgare) quality. Trends Food Sci Technol 2016;62:23-32. doi:10.1016/j.tifs.2016.11.013
^ Hizukuri S., Takeda Y., Yasuda M., Suzuki A. Multi-branched nature of amylose and the action of debranching enzymes. Carbohydr Res 1981;94:205-213. doi:10.1016/S0008-6215(00)80718-1
^ ab Jobling S. Improving starch for food and industrial applications. Curr Opin Plant Biol 2004;7(2):210-8. doi:10.1016/j.pbi.2003.12.001
^ Kram A.M., Oostergetel G.T., Van Bruggen E. Localization of branching enzyme in potato tuber cells with the use of immunoelectron microscopy. Plant Physiol 1993;101(1):237-243. doi:10.1104/pp.101.1.237
^ Leloir L.F., de Fekete M.A., Cardini C.E. Starch and oligosaccharide synthesis from uridine diphosphate glucose. J Biol Chem 1961;236:636-41. doi:10.1016/S0021-9258(18)64280-29
^ ab Magallanes-Cruz P.A., Flores-Silva P.C., Bello-Perez L.A. Starch structure influences its digestibility: a review. J Food Sci 2017;82(9):2016-2023. doi:10.1111/1750-3841.13809
^ abc Pfister B., Zeeman S.C. Formation of starch in plant cells. Cell Mol Life Sci 2016;73(14):2781-807. doi:10.1007/s00018-016-2250-x
^ Qu J., Xu S., Zhang Z., Chen G., Zhong Y., Liu L., Zhang R., Xue J., Guo D. Evolutionary, structural and expression analysis of core genes involved in starch synthesis. Sci Rep 2018;8(1):12736. doi:10.1038/s41598-018-30411-y
^ abcde Seung D. Amylose in starch: towards an understanding of biosynthesis, structure and function. New Phytol 2020;228:1490-1504. doi:10.1111/nph.16858
^ Seung D., Boudet J., Monroe J., Schreier T.B., David L.C., Abt M., Lu K.J., Zanella M., Zeeman S.C. Homologs of PROTEIN TARGETING TO STARCH control starch granule initiation in Arabidopsis leaves. Plant Cell 2017;29(7):1657-1677. doi:10.1105/tpc.17.00222
^ abcd Seung D., Soyk S., Coiro M., Maier B.A., Eicke S., Zeeman S.C. PROTEIN TARGETING TO STARCH is required for localising GRANULE-BOUND STARCH SYNTHASE to starch granules and for normal amylose synthesis in Arabidopsis. PLOS Biol 2015;13(2):e1002080. doi:10.1371/journal.pbio.1002080
^ Szydlowski N., Ragel P., Raynaud S., Lucas M.M., Roldán I., Montero M., Muñoz F.J., Ovecka M., Bahaji A., Planchot V., Pozueta-Romero J., D’Hulst C., Mérida A. Starch granule initiation in Arabidopsis requires the presence of either class IV or class III starch synthases. Plant Cell 2009;21(8):2443-57. doi:10.1105/tpc.109.066522
^ abcde Tetlow I.J., Bertoft E. A review of starch biosynthesis in relation to the building block-backbone model. Int J Mol Sci 2020;21(19):7011. doi:10.3390/ijms21197011
^ Vrinten P.L., Nakamura T. Wheat granule-bound starch synthase I and II are encoded by separate genes that are expressed in different tissues. Plant Physiol 2000;122(1):255-64. doi:10.1104/pp.122.1.255
^ ab Wang K., Hasjim J., Wu A.C., Henry R.J., Gilbert R.G. Variation in amylose fine structure of starches from different botanical sources. J Agric Food Chem 2014;62(19):4443-53. doi:10.1021/jf5011676
^ abc Wang J., Hu P., Chen Z., Liu Q., Wei C. Progress in high-amylose cereal crops through inactivation of starch branching enzymes. Front Plant Sci 2017;8:469. doi:10.3389/fpls.2017.00469
The Leloir pathway is the main pathway for galactose metabolism.
Discovered by Leloir L.F. and colleagues in 1948, it leads to the conversion of galactose into glucose 1-phosphate, namely, to the inversion of the configuration of hydroxyl group at C4 of galactose, one of the chirality centers of the monosaccharide.[9]
The metabolic intermediates involved in this isomerization are building blocks in many metabolic pathways, such as glycosylation reactions of proteins and lipids or glycogen synthesis, depending on the stage of development, the metabolic state of the cell, and the type of tissue.[6]
Except for the first step, the other reactions of the Leloir pathway may proceed in both directions, depending on substrate levels and metabolic demands of the tissue. This allows the interconversion of galactose and glucose.[4]
The importance of the Leloir pathway, and therefore of galactose, is emphasized by the fact that it is highly conserved in nature, from bacteria to plants and animals, and, in humans, by the severity of the consequences due to mutations in one of the genes encoding the enzymes of the pathway, mutations that cause the genetic metabolic disorder known as galactosemia.[2][8]
Galactose, together with glucose and fructose, is one of the monosaccharides that can be absorbed in the intestine. The main dietary source of galactose is lactose, which, with maltose, trehalose and sucrose, is one of the disaccharides found in food. Since there are no transporters for disaccharides, in the last stage of carbohydrate digestion their glycosidic bonds are hydrolyzed with the release of the constituent monosaccharides, which for lactose are glucose and galactose. Then follows the absorption of monosaccharides which, through the portal system, reach the liver, which is the main site for the metabolism of galactose and absorbs, through passive diffusion mediated by the GLUT2 transporter, most of it, about 88%.[3] The residual circulating quantity reaches other organs and tissues, such as the mammary gland that, during the lactation phase, uses it for the production of lactose and the glycosylation of milk proteins and lipids.[4]
The steps of the Leloir pathway
The Leloir pathway consists of four reactions catalyzed by the enzymes galactose mutarotase or aldose 1-epimerase (EC 5.1.3.3), galactokinase (EC 2.7.1.6), galactose 1-phosphate uridylyltransferase or GALT (EC 2.7.7.12) and UDP-galactose 4-epimerase or GALE (EC 5.1.3.2).[8]
The Leloir Pathway
Step 1: galactose mutarotase
The cleavage of the β-(1→4) glycosidic bond of lactose leads to the release of glucose and beta-galactose.
Galactokinase, the enzyme that catalyzes the second step of the Leloir pathway, is specific for the alpha anomer of galactose. The conversion of beta-galactose to alpha-anomer is catalyzed by galactose mutarotase. The enzyme is also able to interconvert alpha and beta-configurations of glucose, xylulose, maltose and lactose, albeit with variable efficiency.[12]
Step 2: galactokinase
In the second step, alpha-galactose is phosphorylated to galactose 1-phosphate, in a reaction catalyzed by galactokinase.[8] The phosphorylation of galactose has some functions.
Galactose 1-phosphate cannot diffuse out of the cell, as it is negative charged and there are no transporters for phosphorylated sugars in the plasma membrane.
Phosphorylation increases the energy content of the monosaccharide, and this starts to destabilize the molecule facilitating its further metabolism.
The phosphorylation of galactose maintains a low intracellular concentration of the monosaccharide, thus favoring its facilitated transport into the cell.
The reaction catalyzed by galactokinase is the irreversible step of the Leloir pathway.[4] Unlike hexokinase and glucokinase (EC 2.7.1.1), which phosphorylate the hydroxyl group at C6 of glucose, galactokinase and fructokinase (EC 2.7.1.4) phosphorylate the hydroxyl group at C1 of galactose and fructose, respectively.[11]
The conversion of galactose 1-phosphate to glucose 1-phosphate requires two reactions, the third and fourth of the Leloir pathway, respectively.
Step 3: galactose 1-phosphate uridylyltransferase
In the third step, galactose 1-phosphate uridylyltransferase catalyzes the transfer to galactose 1-phosphate of the UMP group of UDP-glucose, to form UDP-galactose and glucose 1-phosphate. The reaction proceeds with a ping-pong mechanism with the formation of a covalent intermediate between the enzyme and UMP.[7]
Step 4: UDP-galactose 4-epimerase
In the last step, UDP-galactose is converted to UDP-glucose in a reaction catalyzed by UDP-galactose 4-epimerase. The enzyme inverts the configuration of the hydroxyl group at C4, and is responsible for the interconversion of UDP-galactose and UDP-glucose, hence between galactose and glucose.[8] UDP-galactose 4-epimerase requires NAD+ as a cofactor and the reaction proceeds through the formation of a ketonic intermediate at C4 with simultaneous reduction of NAD+ to NADH. Subsequently, the ketonic intermediate rotates presenting the opposite face of the sugar to NADH, and a hydride ion is transferred back from NADH to C4 but in the opposite configuration.[13] Since NAD is first reduced and then oxidized, no net oxidation or reduction of the coenzyme occurs, which therefore does not appear in the reaction equation. In mammals, UDP-galactose 4-epimerase also catalyzes the interconversion between UDP-N-acetylgalactosamine and UDP-N-acetylglucosamine.[3] It seems that UDP-galactose 4-epimerase is the rate-limiting enzyme of the Leloir pathway.
UDP-glucose produced is recycled in the reaction catalyzed by UDP-glucose pyrophosphorylase, with the release of glucose 1-phosphate.[6]
Note that UDP-galactose and UDP-glucose, or more generally galactose and glucose, have the same molecular formula. Therefore, they are isomers, and differ only in the configuration of the fourth carbon atom. Therefore they are an example of optical isomerism.
What is the role of the Leloir pathway?
The Leloir pathway allows the cell to use galactose or the derived glucose in many metabolic pathways, both anabolic and catabolic, depending on the metabolic state of the cell or tissue. Furthermore, since the reaction catalyzed by UDP-galactose 4-epimerase is reversible, conversion of glucose to galactose and nucleotide derivatives is possible.[4][6]
UDP-galactose can be used:
in the glycosylation of proteins and lipids, such as galactocerebrosides which are the major glycolipids components in myelin, and for this reason galactose was initially called cerebrose;
in the lactating mammary gland for the production of lactose in a reaction catalyzed by the lactose synthase system. Moreover, as the reaction catalyzed by UDP-galactose 4-epimerase may proceed in both directions, glucose can be converted, after activation to UDP-glucose in a reaction catalyzed by UDP-glucose pyrophosphorylase (EC 2.7.7.9), into UDP-galactose for the synthesis of lactose.
In the liver and skeletal muscle, UDP-glucose derived from UDP-galactose, can be used:[4]
in the glycosylation of lipids and proteins;
in glycogen synthesis, when the energy demand of the cell is low; and, with respect to glucose and fructose, galactose is preferentially incorporated in hepatic glycogen rather than being directed to oxidative metabolism;
following conversion to glucose 1-phosphate, in a reaction catalyzed by UDP-glucose pyrophosphorylase, and isomerization to glucose 6-phosphate in a reaction catalyzed by phosphoglucomutase (EC 5.4.2.2), it may enter different metabolic pathways, such as glycolysis, the pentose phosphate pathway or gluconeogenesis.[3]
Note: UDP-galactose, discovered during the studies on the Leloir pathway, was the first nucleotide sugar to be identified.[1]
Leloir pathway and galactosemia
Glycosylations are post-translational modifications that play a key role in enabling and regulating many biological processes. Glycosylation defects have been related to many pathological conditions such as cancer, diabetes, and congenital inborn errors of metabolism such as congenital disorders of glycosylation, which are mainly autosomal recessive monogenic disorders.[5] Congenital disorders of glycosylation include galactosemia, which was first described by von Reuss A. in 1908.[14] Galactosemia is due to mutations in one of the genes encoding the four enzymes of the Leloir pathway, and four types have been identified:
type I, due to deficiency of galactose 1-phosphate uridylyltransferase, the most common form, also called classical galactosemia;
type II, due to galactokinase deficiency;
type III, due to galactose 4-epimerase deficiency;
type IV, due to galactose mutarotase deficiency.[15]
To date, the therapeutic standard of care for galactosemia is a galactose-restricted diet.
Galactosemia and cataracts
The accumulation of galactose fuels alternative metabolic pathways such as the synthesis of galactitol and galactonate.
The symptoms of galactosemia include the early onset of cataracts, usually within the first two years of life, and in the most severe cases, brain, liver, and kidneys damages, too.[12]
It seems that one of the factors triggering cataracts is the reduction of galactose, accumulated in the lens of the eye, to galactitol, in a reaction catalyzed by aldose reductase (EC 1.1.1.21).[10] Galactitol, which is poorly metabolized, does not diffuse through cell membranes due to its poor lipophilicity and, being osmotically active, increases the intracellular osmotic pressure causing a net flow of water inside the cell. Moreover, its synthesis, depleting NADPH levels, may reduce glutathione reductase (EC 1.8.1.7) activity and lead to free radical accumulation.[3]
The osmotic effect and the build-up of free radicals may ultimately damage cell integrity and cause cell death. Furthermore, it has been reported that galactitol is a galactose mutarotase inhibitor, so its accumulation may lead to further accumulation of unmetabolized galactose.[12]
References
^ Cardini C.E., Paladini A.C., Caputto R., Leloir L.F. Uridine diphosphate glucose: the coenzyme of the galactose-glucose phosphate isomerization. Nature 1950;165:191-192. doi:10.1038/165191a0
^ Coelho A.I., Berry G.T., Rubio-Gozalbo M.E. Galactose metabolism and health. Curr Opin Clin Nutr Metab Care 2015;18(4):422-427. doi:10.1097/MCO.0000000000000189
^ abcd Coelho A.I., Rubio-Gozalbo M.E., Vicente J.B., Rivera I. Sweet and sour: an update on classic galactosemia. J Inherit Metab Dis 2017;40(3):325-342. doi:10.1007/s10545-017-0029-3
^ abcde Conte F., van Buuringen N., Voermans N.C., Lefeber D.J. Galactose in human metabolism, glycosylation and congenital metabolic diseases: time for a closer look. Biochim Biophys Acta Gen Subj 2021;1865(8):129898. doi:10.1016/j.bbagen.2021.129898
^ abc Frey P.A. The Leloir pathway: a mechanistic imperative for three enzymes to change the stereochemical configuration of a single carbon in galactose. FASEB J 1996;10(4):461-70. doi:10.1096/fasebj.10.4.8647345
^ abcd Holden H.M., Rayment I., Thoden J.B. Structure and function of enzymes of the Leloir pathway for galactose metabolism. J Biol Chem 2003;278(45):43885-43888. doi:10.1074/jbc.R300025200
^ Leloir L.F., de Fekete M.A., Cardini C.E. Starch and oligosaccharide synthesis from uridine diphosphate glucose. J Biol Chem 1961;236:636-41. doi:10.1016/S0021-9258(18)64280-2
^ Pintor J. Sugars, the crystalline lens and the development of cataracts. Biochem Pharmacol 2012;1:4. doi:10.4172/2167-0501.1000e1190
^ Rosenthal M.D., Glew R.H. Medical Biochemistry – Human Metabolism in Health and Disease. John Wiley J. & Sons, Inc., 2009
^ abc Thoden J.B., Timson D.J., Reece R.J., and M. Holden H.M. Molecular structure of human galactose mutarotase. J Biol Chem 2004;279(22):23431-23437. doi:10.1074/jbc.M402347200
^ Thoden J.B., Wohlers T.M., Fridovich-Keil J.L., Holden H.M. Human UDP-galactose 4-epimerase. Accommodation of UDP-N-acetylglucosamine within the active site. J Biol Chem 2001;276(18):15131-6. doi:10.1074/jbc.M100220200
^ Wada Y., Kikuchi A., Arai-Ichinoi N., Sakamoto O., Takezawa Y., Iwasawa S., Niihori T., Nyuzuki H., Nakajima Y., Ogawa E., Ishige M., Hirai H., Sasai H., Fujiki R., Shirota M., Funayama R., Yamamoto M., Ito T., Ohara O., Nakayama K., Aoki Y., Koshiba S., Fukao T., Kure S. Biallelic GALM pathogenic variants cause a novel type of galactosemia. Genet Med 2019;21(6):1286-1294. doi:10.1038/s41436-018-0340-x
In 1906, the Russian-American chemist Martin André Rosanoff, working at that time at New York University, chose glyceraldehyde, a monosaccharide, as the standards for denoting the stereochemistry of molecules with at least one chirality center, such as carbohydrates. This nomenclature system was called the Fischer-Rosanoff convention, or Rosanoff convention, or D-L system.[7]
Because Rosanoff didn’t know the absolute configuration of glyceraldehyde, he assigned in a completely arbitrary manner:
the D prefix, from the Latin dexter, meaning “right”, to (+)-glyceraldehyde, the dextrorotatory enantiomer, thus assuming that the configuration, in Fischer projections, was that with the hydroxyl group (–OH) attached to the chiral center on the right side of the molecule;
the L prefix, from the Latin laevus, meaning “left”, to (-)-glyceraldehyde, the levorotatory enantiomer, thus assuming that the configuration, in Fischer projections, was that with the hydroxyl group attached to the chiral center on the left side of the molecule.[4]
Although Fischer rejected this nomenclature system, it was universally accepted and used to obtain the relative configurations of the chiral molecules.[3] How? The configuration about a chiral center is related to that of glyceraldehyde by converting its groups to those of the monosaccharide through reactions that occur with retention of configuration, namely, reactions that do not break any of the bonds to the chiral center. This means that the spatial arrangement of the groups around the chiral center in the reagents and products is same. The Fischer convention allows to divide the chiral molecules, such as amino acids and monosaccharides, into two classes, known as the D series and the L series, depending on whether the configuration of the groups around the chiral center is related to that of D-glyceraldehyde or L-glyceraldehyde.
Note: there is no correlation between retention of configuration and sign of the rotatory power: the D-L system does not specify the sign of the rotation of plane-polarized light caused by the chiral molecule, but simply correlates the configuration of the molecule with that of the glyceraldehyde.[6]
Monosaccharides can be aldoses or ketoses. Aldoses, and ketoses with more than three carbon atoms have at least one chiral center, and, by convention, they belong to the D series or to the L series if the configuration of the chiral carbon farthest from the carbonyl carbon, the carbon with the highest oxidation state, is same as that of D-glyceraldehyde or L-glyceraldehyde, respectively.
In Fischer projections the longest chain of carbon atoms is oriented vertically, and the atoms are numbered so that the carbonyl carbon has the lowest possible number, then, C-1 in aldoses and C-2 in ketoses.[8] Note: in Nature, D-sugars are much more abundant than L-sugars.
If the sign of the rotation of plane-polarized light must be specified in the name, the prefixes (+) or (-) can be employed in addition to the D and L prefixes. For example, fructose, which is levorotatory, can be named D-(-)-fructose, whereas glucose, which is dextrorotatory, can be named D-(+)-glucose.
Fischer-Rosanoff convention and alpha-amino acids
Amino acids, depending on the position of the amino group (–NH2) with respect to the carboxyl group (–COOH) can be classified as:
α-amino acids, in which the amino group is attached to the α-carbon;
β-amino acids, in which the amino group is attached to the β-carbon;
γ-amino acids, in which the amino group is attached to the γ-carbon;
δ -amino acids, in which the amino group is attached to the δ-carbon.
α-Amino acids belong to the D series or to the L series if the configuration of the –NH2, –COOH, –R, and H groups attached to the α-carbon, the chiral center, is the same of the hydroxyl, aldehyde (–CHO), and hydroxymethyl (–CH2OH), and H groups of D-glyceraldehyde or L-glyceraldehyde, respectively.[6][8]
In Fischer projections the molecules are arranged so that the carboxylic group, namely, the carbon with the highest oxidation state, is at the top, and the R group at the bottom.
Among α-amino acids, proteinogenic amino acids, with the exception of glycine whose α-carbon is not chiral, have the L configuration, hence, they are L-α-amino acids.
Note: in Nature, L-α-amino acids are much more abundant than all the other amino acids, which do not participate in the synthesis of proteins.
Relative and absolute configurations
When Rosanoff arbitrarily assigned the D prefix to (+)-glyceraldehyde and the L prefix to (-)-glyceraldehyde, he had 50/50 chance of being correct.[5]
In the early 1950s, a new technique, the x-ray diffraction analysis, made possible to establish the absolute configuration of chiral molecules. In 1951 a Dutch chemist, Johannes Martin Bijvoet established the absolute configuration of sodium rubidium (+)‐tartrate tetrahydrate and, comparing it with glyceraldehyde, demonstrated that Rosanoff’s guess was right.[1] Consequently, the configurations of the chiral compounds obtained by relating them to that of glyceraldehyde were the same as their absolute configurations: hence, the relative configurations became absolute configurations.
Ambiguities of the Fischer-Rosanoff convention
The Fischer-Rosanoff convention gives rise to uncertainties with molecules with more than one chiral center.[3] For example, considering D-(+)-glucose, the D-L system gives information about the configuration of C-2, but no information about the other asymmetric centers, namely, C-3, C-4, and C-5.
In these cases, the RS system, developed in 1956 by Robert Sidney Cahn, Christopher Ingold, and Vladimir Prelog, labeling each chiral center, allows to describe accurately the stereochemistry of the molecule.[2][8] In the case of D-(+)-glucose, the molecule has the (2R,3S,4R,5R)-configuration.
It should also be noted that depending on the chiral center taken as the reference center, the same molecule can belong to both the D and L series.
References
^ Bijvoet J.M., Peerdeman A.F., Van Bommel A.J. Determination of the absolute configuration of optically active compounds by means of X-rays. Nature 1951;168(4268):271. doi:10.1038/168271a0
^ Cahn R.S., Ingold C., Prelog V. Specification of molecular chirality. Angew Chem 1966:5(4); 385-415. doi:10.1002/anie.196603851
^ IUPAC. Compendium of Chemical Terminology, 2nd ed. (the “Gold Book”). Compiled by A. D. McNaught and A. Wilkinson. Blackwell Scientific Publications, Oxford (1997). Online version (2019-) created by S. J. Chalk. ISBN 0-9678550-9-8. doi:10.1351/goldbook
^ Moran L.A., Horton H.R., Scrimgeour K.G., Perry M.D. Principles of Biochemistry. 5th Edition. Pearson, 2012
^ ab Nelson D.L., Cox M.M. Lehninger. Principles of biochemistry. 6th Edition. W.H. Freeman and Company, 2012
^ Rosanoff. On Fischer’s classification of stereo-isomers. J Am Chem Soc 1906:28(1);114-121. doi:10.1021/ja01967a014
^ abc Voet D. and Voet J.D. Biochemistry. 4th Edition. John Wiley J. & Sons, Inc. 2011
In 1891, Hermann Emil Fischer, a German chemist, Nobel Laureate in chemistry in 1902, developed a systematic method for the two-dimensional representation of molecules with chirality centers, the so-called Fischer projections or Fischer projection formulas.
Despite they are two-dimensional structures, Fischer projections preserve information about the stereochemistry of the molecules and, although not being a representation of how molecules might look in solution, are still widely used by biochemists to define the stereochemistry of amino acids, carbohydrates, nucleic acids, terpenes, steroids, and other molecules of biological interest.
By considering a molecule with a single chiral center, e.g. a carbon atom, for drawing the Fischer projections, the tetrahedral structure is rotated so that two groups point downward, whereas two groups point upwards. Then, you draw a cross, place the chiral center at the center of the cross, and arrange the molecule so that the groups pointing downward, that is, behind the plane of the paper, are attached to the ends of the vertical line, and the groups pointing upwards, that is, out front from the plane of the paper, are attached to the ends of the horizontal line.
For compounds with more than one chiral center, the same procedure is applied to each asimmetric center.
It is also possible to convert a Fischer projection into a three-dimensional representation, for example using the wedges and dashes of perspective formulas, where the two horizontal bonds are represented by solid wedges, whereas the vertical bonds are represented by dashed lines.
How to manipulate Fischer projection formulas?
Since Fischer projections represent three-dimensional molecules on a two-dimensional sheet of paper, some rules must be respected to avoid changing the configuration.
The projections must not be lifted out the plane of the paper, because this causes enantiomer is converted into the other enantiomer.
If you rotate the projections in the plane of the paper, you obtain the same enantiomer if you rotate the structures by 180° in either direction, because the vertical groups must lie below the plane of the paper, whereas the horizontal groups above. Conversely, the rotation by 90° or 270° in either direction causes an enantiomer is converted into the other enantiomer.
An odd number of exchanges of two groups leads to the other enantiomer.
IUPAC. Compendium of Chemical Terminology, 2nd ed. (the “Gold Book”). Compiled by A. D. McNaught and A. Wilkinson. Blackwell Scientific Publications, Oxford (1997). Online version (2019-) created by S. J. Chalk. ISBN 0-9678550-9-8. doi:10.1351/goldbook
Moran L.A., Horton H.R., Scrimgeour K.G., Perry M.D. Principles of Biochemistry. 5th Edition. Pearson, 2012
Voet D. and Voet J.D. Biochemistry. 4th Edition. John Wiley J. & Sons, Inc. 2011
In 1956, Robert Sidney Cahn, Christopher Ingold and Vladimir Prelog developed a nomenclature system that, based on a few simple rules, allows to assign the absolute configuration of each chirality center in a molecule.[1][5]
This nomenclature system, called the RS system, or the Cahn-Ingold-Prelog (CIP) system, when added to the IUPAC system of nomenclature,[3] allows to name accurately and unambiguously the chiral molecules, even when there is more than one asymmetric center.
Chiral molecules are, in most cases, able to rotate plane-polarized light when light passes through a solution containing them. In this regard, it should be emphasized that the sign of the rotation of plane-polarized light caused by a chiral compound provides no information concerning RS configuration of its chiral centers.
The Fischer-Rosanoff convention is another way to describe the configuration of chiral molecules.[6] However, compared to RS system, it labels the whole molecule and not each chirality center, and is often ambiguous for molecules with two or more chirality centers.[7]
The RS system assigns a priority sequence to the groups attached to the chirality center and, tracing a curved arrow from the highest priority group to the lowest, labels each chiral center R or S.[2][4]
First rule
A priority sequence is assigned to the groups based on the atomic number of the atoms directly attached to the chiral center.
The atom with the highest atomic number is assigned the highest priority.
The atom with the lowest atomic number is assigned the lowest priority.
For example, if an oxygen atom, O, atomic number 8, a carbon atom, C, atomic number 6, a chlorine atom, Cl, atomic number 17, and a bromine atom, Br, atomic number 35 are attached to the chiral center, the order of priority is: Br > Cl > O > C.
For isotopes, the atom with the highest atomic mass is assigned the highest priority.
Second rule
When different groups are attached to the chiral center through identical atoms, the priority sequence is assigned based on the atomic number of the next atoms bound, then moving outward from the chirality center until the first point of difference is reached.
If, for example, –CH3, –CH2CH3 and –CH2OH groups are attached to a chiral center, there are three identical atoms directly attached to the chiral center. Analyzing the next atoms bound, we have:
for the methyl group –CH3
H, H, H
for the ethyl group –CH2CH3
H, H, C
for the hydroxymethyl group –CH2OH
H, H, O
Because the atomic number of oxygen is higher than that of carbon, that, in turn, is higher than that of hydrogen, the order of priority is –CH2OH > –CH2CH3 > –CH3
The order of priority of some groups is:
Note that the groups attached to a chirality center must not have identical priority ranking, because, in that case, the center cannot be chiral.
Once the priority sequence has been established, the molecule is oriented in space so that the group with the lowest priority is pointed away from the viewer, then behind the chiral center. Now, trace a curved arrow, a circle, from the highest priority group to the lowest.
If you move in a clockwise direction, the configuration of chiral center is R, from the Latin rectus, meaning “right”.
If you move in a counterclockwise direction, the configuration of chiral center is S, from the Latin sinister, meaning “left”.
Third rule
This is the third rule of the RS system, by which we can determine the configuration of a chirality center when there are double or triple bonds in the groups attached to the chirality center.
To assign priorities, the atoms engaged in double or triple bonds are considered duplicated and tripled, respectively.
In the case of a C=Y double bond, one Y atom is attached to the carbon atom, and one carbon atom is attached to the Y atom.
In the case of a C≡Y triple bond, two Y atoms are attached to the carbon atom, and two carbon atoms are attached to the Y atom.
RS system and multiple chiral centers
When two or more chirality centers are present in a molecule, each center is analyzed separately using the rules previously described.
Consider 2,3-butanediol. The molecule has two chiral centers, carbon 2 and carbon 3, and exists as three stereoisomers: two enantiomers and a meso compound. What is the RS configuration of the chiral centers of the enantiomer shown in figure?
Consider carbon 2. The order of priority of the groups is –OH > –CH2OHCH3 > –CH3 > –H. Rotate the molecule so that the hydrogen, the lowest priority group, is pointed away from the viewer. Tracing a path from –OH, the highest priority group, to –CH3, the lowest priority group, we move in a clockwise direction: the configuration of the carbon 2 is, therefore, R. Applying the same procedure to carbon 3, its configuration is R. Then, the enantiomer shown in figure is (2R,3R)-2,3-butanediol.
Amino acids and gliceraldeide
In the Fischer-Rosanoff convention, all the proteinogenic amino acids are L-amino acids. In the RS system, with the exception of glycine, that is not chiral, and cysteine that, due to the presence of the thiol group, is (R)-cysteine, all the other proteinogenic amino acids are (S)-amino acids.
Threonine and isoleucine have two chirality centers, the α-carbon and a carbon atom on the side chain, and exist as three stereoisomers: two enantiomers and a meso compound. The forms of the two amino acids isolated from proteins are (2S,3R)-threonine and (2S,3S)-isoleucine, in Fischer-Rosanoff convention, L-threonine and L-isoleucine.
In the RS system, L-glyceraldehyde is (S)-glyceraldehyde, and, obviously, D-glyceraldehyde is (R)-glyceraldehyde.
References
^ Cahn R.S., Ingold C., Prelog V. Specification of molecular chirality. Angew Chem 1966:5(4); 385-415. doi:10.1002/anie.196603851
^ IUPAC. Compendium of Chemical Terminology, 2nd ed. (the “Gold Book”). Compiled by A. D. McNaught and A. Wilkinson. Blackwell Scientific Publications, Oxford (1997). Online version (2019-) created by S. J. Chalk. ISBN 0-9678550-9-8. doi:10.1351/goldbook
^ Moran L.A., Horton H.R., Scrimgeour K.G., Perry M.D. Principles of Biochemistry. 5th Edition. Pearson, 2012
^ Prelog V. and Helmchen G. Basic principles of the CIP‐system and proposals for a revision. Angew Chem 1982:21(8);567-583. doi:10.1002/anie.198205671
^ Rosanoff M.A. On Fischer’s classification of stereo-isomers. J Am Chem Soc 1906:28(1);114-121. doi:10.1021/ja01967a014
^ Voet D. and Voet J.D. Biochemistry. 4th Edition. John Wiley J. & Sons, Inc. 2011
Chirality is the geometric property of a group of points or atoms in space, or of a solid object, of not being superimposable on its mirror image. These structures, defined as chiral, have the peculiar property of being devoid of symmetry elements of the second kind, namely, a mirror plane, an center of inversion, or a rotation-reflection.
The definition of chirality, from the Greek cheir meaning “hand”, is due to Lord Kelvin who enunciated it during the “Baltimore Lectures”, a series of lectures held at Johns Hopkins University in Baltimore, starting from October 1st 1884, and published twenty years later, in 1904, in which the English scientist, among other things, stated: “I call any geometrical figure, or groups of points, chiral, and say it has chirality, if its image in a plane mirror, ideally realized, cannot be brought to coincide with itself“.
The environment is rich in chiral objects: your hands are the example par excellence, but there are many others, from the shell of a snail to a spiral galaxy. In chemistry, and especially in organic chemistry, chirality is a property of primary importance, because molecules such as carbohydrates, many amino acids, as well as many drugs, are chiral.
Chiral molecules can exist in two forms, mirror images of each other and non-superimposable, namely, there is no combination of rotations or translations on the plane of the sheet that allows their superposition. Such molecules are called enantiomers, from the Greek enántios, meaning “opposite” and meros,meaning “part”.
The most common cause of chirality in a molecule is the presence of a chirality center or chiral center, also called asymmetric center, namely, an atom that bears a set of atoms or functional groups in a spatial arrangement so that the resulting molecule can exist as two enantiomers.
Enantiomers are a kind of stereoisomers, that, in turn, can be defined as isomers having the same number and kind of atoms and bonds, but differing in the spatial orientation of the atoms.
Two enantiomers of a chiral molecule, being non-superimposable, are different compounds. How do they differ?
Each pair of enantiomers has identical physical and chemical properties towards achiral properties, such as melting point, boiling point, refractive index, infrared spectrum, the solubility in the same solvent, or the same reaction rate with achiral reagents.
The differences emerge when they interacts with chemical and physical phenomena that have chiral properties.
From the chemical point of view, two enantiomers can be distinguished by the way they interact with chiral structures, such as the binding site of a chiral receptor or the active site of a chiral enzyme.
From the physical point of view, they differ in their interaction with plane-polarized light, that has chiral properties, namely, they have optical activity.
Chirality and optical activity
The optical activity of materials such as quartz and, more importantly, of organic compounds such as sugars or tartaric acid, was discovered in 1815 by the French scientist Jean-Baptiste Biot.
Chiral molecules can be classified based on the direction in which, from the observer’s point of view, plane-polarized light is rotated when it passes through a solution containing them.
If a solution containing one enantiomer rotates plane-polarized light in a clockwise direction, the molecule is called dextrorotatory or dextrorotary, from the Latin dexter, meaning “right”, and is designated by the prefixes (+)-, or d– from dextro-.
If a solution containing one enantiomer rotates plane-polarized light in a counterclockwise direction, the molecule is called levorotatory or levorotary, from the Latin laevus, meaning “left”, and is designated by the prefixes (-), or l– from laevo-.
Obviously, if we consider a pair of enantiomers, one is dextrorotatory and the other levorotatory.
At present it is not possible to reliably predict the magnitude, direction, or sign of the rotation of plane-polarized light caused by an enantiomer. On the other hand, the optical activity of a molecule provides no information on the spatial arrangement of the chemical groups attached to the chirality center.
Note: a system containing molecules that having the same chirality sense is called enantiomerically pure or enantiopure.
Pasteur and the discovery of enantiomers
In 1848, thirty three years after Biot’s work, studies on the optical activity of molecules led Louis Pasteur, who had been a student of Biot, to note that, following the recrystallization of a concentrated aqueous solution of sodium ammonium tartrate, optically inactive, two kinds of crystals precipitated, that were non-superimposable mirror images of each other.
After separating them with tweezers, Pasteur discovered that the solutions obtained by dissolving equimolar amounts of the two kind of crystals were optically active and, interestingly, the rotation angle of plane-polarized light was equal in magnitude but opposite in sign. Because the differences in optical activity were due to the dissolved sodium ammonium tartrate crystals, Pasteur hypothesized that the molecules themselves should be non-superimposable mirror images of each other, like their crystals. They were what we now call enantiomers. And it is Pasteur who first used the term asymmetry to describe this property, then called chirality by Lord Kelvin.
Racemic mixtures
A solution containing an equal amount of each member of a pair of enantiomers is called racemic mixture or racemate. These solutions are optically inactive: there is no net rotation of plane-polarized light since the amount of dextrorotatory and levorotatory molecules is exactly the same.
Unlike what happens in biochemical processes, the chemical synthesis of chiral molecules that does not involve chiral reactants, or that is not followed by methods of separation of enantiomers, inevitably leads to the production of a racemic mixture.
The pharmaceutical chemistry is among the sectors most affected by this. As previously mentioned, two enantiomers are different compounds. Many chiral drugs are synthesized as racemic mixtures. However, most often the desired pharmacological activity resides in one enantiomer, called eutomer; the other, called distomer, is less active or inactive. An example is ibuprofen, an arylpropionic acid derivative, and anti-inflammatory drug: only the S enantiomer has the pharmacological activity.
Arylpropionic derivatives are sold as racemic mixtures: a racemase converts the distomer to the eutomer in the liver.
However, it is also possible that the distomer causes harmful effects and must be eliminated from the racemic mixture. A tragic example is thalidomide, a sedative and anti-nausea drug sold as a racemic mixture from the 1950s until 1961, and taken also during pregnancy.
The distomer, the S enantiomer, could cause serious birth defects, particularly phocomelia. This is probably the most striking example of the importance of the chiral properties of molecules, which prompted health care organizations to promote the synthesis of drugs, including thalidomide, containing a single enantiomer by the pharmaceutical industry.
Chirality centers
Any tetrahedral atom that bears four different substituents can be a chirality center.
Carbon atom is the classic example, but also other atoms from group IVA of the periodic table, such as the semimetals silicon and germanium, have a tetrahedral arrangement and can be chiral centers. Another example is the phosphorus atom in organic phosphate esters that has a tetrahedral arrangement, then, when it binds four different substituents it is a chiral center.
The nitrogen atom of a tertiary amine, an amine in which the nitrogen is bounded to three different groups, is a chiral center. In these compounds, nitrogen is located at the center of a tetrahedron and its four sp3 hybrid orbitals point to the vertices, three of which are occupied by the three substituents, whereas the nonbonding electron pair points towards the fourth.
At room temperature, nitrogen rapidly inverts its configuration. The phenomenon is known as nitrogen inversion, namely, a rapid oscillation of the atom and its ligands, during which nitrogen passes through a planar sp2-hybridized transition state. As a consequence, if the nitrogen atom is the only chiral center of the molecule, there is no optical activity because a racemic mixture exists. The inversion of configuration does not occur only in some cases in which nitrogen is part of a cyclic structure that prevents it. Therefore, the presence of a chiral center could be not sufficient to allow the separation of the respective enantiomers.
Note: in 1874, Jacobus Henricus van ‘t Hoff and Joseph Achille Le Bel, based on the work of Pasteur, first formulated the theory of the tetrahedral carbon atom. For this work van ‘t Hoff received the first Nobel Prize in chemistry in 1901.
Chirality in the absence of a chiral center
Chirality can also occur in the absence of a chiral center, due to the lack of free rotation around a double or a single bond, as in the case of:
allene derivatives, organic compounds in which there are two cumulative double bonds, namely, two double bonds localized on the same carbon atom;
biphenyl derivatives.
In this case, chirality is due to the presence of an axis of chirality.
Meso compounds
Meso compounds are stereoisomers with two or more chiral centers that are superimposable on their mirror image, then achiral and, as such, optically inactive. Moreover, they have an internal mirror plane that bisects the molecule, with each half a mirror image of the other. Then, meso compounds can be classified as diastereomers, namely, stereoisomers which are not enantiomers.
For a molecule with n chirality centers, the maximum number of possible stereoisomers is 2n.
Consider 2,3-butanediol. The molecule has two chirality centers, the carbons 2 and 3. Therefore, there are 22 = 4 possible stereoisomers, whose structures are depicted in the figure, in the Fischer projections, indicated as A, B, C, D.
Structures A and B are mirror images of each other and non-superimposable, then they are a pair of enantiomers.
Structures C and D are mirror images of each other, but are superimposable. In fact, if we rotate structure C or D of 180 degrees, the two structures are superimposable. Then, they are not a pair of enantiomers: they are the same molecule with opposite orientation. Moreover, they have an internal mirror plane, that bisects the molecule, giving two halves, each a mirror image of the other. Structure C, or D, is therefore a meso compound because it has chiral centers, is superimposable on its mirror image, and has internal mirror plane that divides the molecule into two mirror‐image halves.
References
Capozziello S. and Lattanzi A. Geometrical approach to central molecular chirality: a chirality selection rule. Chirality 2003;15:227-230. doi:10.1002/chir.10191
IUPAC. Compendium of Chemical Terminology, 2nd ed. (the “Gold Book”). Compiled by A. D. McNaught and A. Wilkinson. Blackwell Scientific Publications, Oxford (1997). Online version (2019-) created by S. J. Chalk. ISBN 0-9678550-9-8. doi:10.1351/goldbook
The phenomenon that two or more different chemical compounds have the same molecular formula is called isomerism, from the Greek isos meaning “equal”, and meros meaning “part”, a concept and term introduced by the Swedish scientist Jacob Berzelius in 1830.[3][4]
Isomerism is a consequence of the fact that the atoms of a molecular formula can be arranged in different ways to give compounds, called isomers, that differ in physical and chemical properties.
There are two types of isomerism: structural isomerism and stereoisomerism, which can be divided into further subtypes.[1]
In structural isomerism, also called constitutional isomerism, isomers differ from each other in that the constituent atoms are linked in different ways and sequences.
There are several subtypes of structural isomerism: positional, functional group and chain isomerism.
Positional isomers
In positional isomerism, also called position isomerism, isomers have the same functional groups but in different positions on the same carbon chain.
An example is the compound with molecular formula C6H4Br2, of which there are three isomers: 1,2-dibromobenzene, 1,3-dibromobenzene and 1,4-dibromobenzene. These isomers differ in the position of the bromine atoms on the cyclic structure.
Another example is the compound with molecular formula C3H8O, of which there are two isomers: 1-propanol or n-propyl alcohol, and 2-propanol or isopropyl alcohol. These isomers differ in the position of the hydroxyl group on the carbon chain.
Functional group isomers
Functional group isomerism, also called functional isomerism, occurs when the atoms form different functional groups.
An example the compound with molecular formula C2H6O, of which there are two isomers: dimethyl ether and ethanol or ethyl alcohol, that have different functional groups, an ether group, –O–, and a hydroxyl group, –OH, respectively.
Chain isomers
In chain isomerism, isomers differ in the arrangement of the carbon chains, that may be branched or straight.
An example is the compound with the molecular formula C5H12, of which there are three isomers: n-pentane, 2-methylbutane or isopentane and 2,2-dimethylpropane or neopentane.
Chain isomerism also occurs in lipids. For example, among short-chain fatty acids, butyric acid and isobutyric acid, which have molecular formula C4H8O2, are chain isomers, as well as valeric acid, isovaleric acid and 2-methylbutyric acid, which have the molecular formula C5H10O2.
Stereoisomerism
In stereoisomerism, isomers have the same number and kind of atoms and bonds, but differ in the orientation of the atoms in space.[3][4] Such isomers are called stereoisomers, from the Greek stereos, meaning “solid”.
There are two subtypes of stereoisomerism, conformational isomerism and configurational isomerism; the latter can be further subdivided into optical isomerism and geometrical isomerism.
Conformational isomerism
In conformational isomerism, the stereoisomers can be interconverted by rotation around one or more single bonds, the σ bonds. These rotations produce different arrangements of atoms in space that are non-superimposable. And the number of possible conformations a molecule can adopted is theoretically unlimited, ranging from the lowest energy structure, the most stable, to the highest energy structure, the less stable. Such isomers are called conformer.
For example, if we consider ethane, C2H4, looking at the molecule from one end down the carbon-carbon bond, using the Newman projection, hydrogen atoms of a methyl group can be, with respect to the hydrogen atoms of the other methyl group, in one of the following conformations.
The eclipsed conformation, in which hydrogen atoms of a methyl group are hidden behind those of the other methyl group, then, the angle between carbon-hydrogen bonds on the front and rear carbons, called a dihedral angle, could be 0, 120, 240, 360 degrees. This is the highest energy conformation, then is the less stable.
The staggered conformation, in which hydrogen atoms of a methyl group are completely offset from those of the other methyl group, namely, dihedral angles could be 60, 180 or 360 degrees. This is the lowest energy conformation, then the most stable.
The skew conformation, corresponding to one of the intermediate conformations between the previous ones.
The stability of ethane conformers is due to how the electron pairs of the carbon-hydrogen bonds of the two methyl groups are overlapped:
in the staggered conformations they are as far away from each other as possible;
in the eclipsed conformations they are as close as possible to each other.
The potential energy barrier between these two conformations is small, about 2.8 kcal/mole (11.7 kJ/mole). At room temperature, the kinetic energy of the molecules is 15-20 kcal/mole (62.7-83.6 kJ/mole), more than enough to allow free rotation around the carbon-carbon bond. As a consequence, it is not possible to isolate any particular conformation of ethane.
Note: the potential energy barrier to rotation around double carbon-carbon bonds is about 63 kcal/mole (264 kJ/mole), corresponding to the energy required to break the π bond. (See geometric isomerism). This value is about three times the kinetic energy of the molecules at room temperature at which, then, free rotation is precluded. Only at temperatures above 300 °C molecules acquire enough thermal energy to break the π bond, allowing free rotation around the remaining σ bond. This allows the trans-isomer to be rearranged to the cis-isomer or vice versa.
Configurational isomerism
In configurational isomerism, the interconversion between the stereoisomers does not occur as a result of rotations around single bonds but involves bond breaking and new bond forming, then it doesn’t occur spontaneously at room temperature.
There are two subtypes of configurational isomerism: optical isomerism and geometrical isomerism.
Optical isomers
Optical isomerism occurs in molecules that have one or more chirality centers or chiral centers, namely, tetrahedral atoms that bear four different ligands.[2] The chiral center can be a carbon, phosphorus, sulfur or nitrogen atom.
Note: the word chirality derives from the Greek cheiros, meaning “hand”.
Optical isomers lack of a center of symmetry or a plane of symmetry, are mirror image of each other, and cannot be superimposed on one another. Such stereoisomers are called enantiomers, from the Greek enántios, meaning “opposite”, and meros, meaning “part”.
Unlike the other isomers, two enantiomers have identical physical and chemical properties with two exceptions.
The direction of rotation of the plane of polarized light, hence the name of optical isomerism.
If a solution of one enantiomer rotates the plane of polarized light in a clockwise direction, the enantiomer is labeled (+). Conversely, a solution of the other enantiomer rotates the plane of polarized light in a counterclockwise direction by the same angle, and the enantiomer is labeled (-).
Although indistinguishable by most techniques, two enantiomers can be distinguished in a chiral environment like the active site of chiral enzymes.
Note: for a molecule with n chiral centers, the maximum number of stereoisomers is equal to 2n.
Geometric isomers
Geometric isomerism, also called cis-trans isomerism, occurs when atoms cannot freely rotate due to a rigid structure such as in:
compounds with carbon-carbon, carbon-nitrogen or nitrogen-nitrogen double bonds, where the rigidity is due to the double bond;
cyclic compounds, where the rigidity is due to the ring structure.
An example of geometrical isomerism due to the presence of a carbon-carbon double bond is stilbene, C14H12, of which there are two isomers. In one isomer, called cis isomer, the same groups are on the same side of the double bond, whereas in the other, called trans isomer, the same groups are on opposite sides.
Note: the terms trans and cis are from the Latin trans, meaning “across”, and cis, meaning “on this side of”.
Among the cyclic compounds of carbon, cis-trans isomerism not complicated by the presence of chiral centers occurs in structures with an even number of carbon atoms and substituted in opposite positions, namely, para-substituted. An example is 1,4-dimethylcyclohexane, a cycloalkane, compounds of general formula CnH2n, of which there are two stereoisomers, cis-1,4-dimethylcyclohexane and trans-1,4- dimethylcyclohexane.
This kind of stereoisomerism cannot exist if one of the atoms that cannot freely rotate carries two groups the same. Why? For the switching between the trans and cis isomers the groups attached to atoms that cannot freely rotate have to be swapped. If there are two groups the same, the switch leads to the formation of the same molecule.
Note: geometric isomers are a special case of diastereomers or diastereoisomers, that, in turn, are stereoisomers that are not mirror image of each other. The other diastereomers are the meso compounds and non-enantiomeric optical isomers.
References
^ Graham Solomons T. W., Fryhle C.B., Snyder S.A. Solomons’ organic chemistry. 12th Edition. John Wiley & Sons Incorporated, 2017
In solution, solvent molecules tend to move from a region of higher concentration to one of lower concentration. When two different solutions are separated by a semipermeable membrane, namely, a membrane that allows certain ions or molecules to pass, in this case the solvent molecules, a net flow of solvent molecules from the side with higher concentration to the side with lower concentration will occur. This net flow through the semipermeable membrane produces a pressure called osmotic pressure, indicated as Π, that can be defined as the force that must be applied to prevent the movement of the solvent molecules through a semipermeable membrane.
Osmotic pressure, together with boiling point elevation, freezing point depression, and vapor pressure lowering, is one of the four colligative properties of solutions, properties that do not dependent of the chemical properties of the solute particles, namely ions, molecules or supramolecular structures, but depend only on the number of solute particles present in solution.
For a solutions of n solutes, the equation that describes osmotic pressure is the sum of the contributions of each solute:
Π = RT(i1c1 + i2c2 + … + incn)
The equation is known as the van ’t Hoff equation, where:
The van ‘t Hoff factor is a measure of the degree of dissociation of solutes in solution, and is described by the equation:
i = 1 + α(n-1)
where:
α is the degree of dissociation of the solute molecules, equal to the ratio between the moles of the solute molecules that have dissociated and the number of the original moles, and is comprised between 0, for substances that do not ionize or dissociate in solution, and 1, for substances that completely dissociate or ionize;
n is the number of ions formed from the dissociation of the solute molecule.
For non ionizable compounds, such as glucose, glycogen or starch, n = 1, and i = 1, whereas for compounds that completely dissociate, such as strong acids and strong bases or salts, the van ‘t Hoff factor is a whole number greater than one, as α = 1 and n is equal to at least 2. For example, if we consider sodium chloride, NaCl, potassium chloride, KCl, or calcium chloride, CaCl2, in dilute solution:
So in the first two cases i = 2, whereas with calcium chloride, i = 3.
Finally, for substances that do not completely ionize, such as weak acids and weak bases, i is not an integer.
The product of the van ’t Hoff factor and the molar concentration of the solute particles, ic, is the osmolarity of the solution, namely, the concentration of the solute particles osmotically active per liter of solution.
Osmotic pressure, osmosis, and plasma membranes
Osmosis can be defined as the net movement or flow of solvent molecules through a semipermeable membrane driven by osmotic pressure differences across the membrane, to try to equal the concentration of the solute on the two sides of the membrane itself. In biological systems, water is the solvent and plasma membranes are the semipermeable membranes.
Plasma membranes allow water molecules to pass, due to protein channels, known as aquaporins, as well as small non-polar molecules that diffuse rapidly across them, whereas they are impermeable to ions and macromolecules.
Inside the cell there are macromolecules, such as nucleic acids, proteins, glycogen, and supramolecular aggregates, for example multienzyme complexes, but also ions in a higher concentration than that of the extracellular environment. This causes osmotic pressure to drive water from outside to inside the cell. If this net flow of water toward the inside of the cell is not counterbalanced, cell swells, and plasma membrane is distended until the cell bursts, that is, an osmotic lysis occurs. Under physiological conditions, this does not happen because during evolution several mechanisms have been developed to oppose, and in some cases even exploit, these osmotic forces. Two of these are energy-dependent ion pumps and, in plants, bacteria and fungi, the cell wall.
Energy dependent ion pumps
Ion pumps reduce, at the expense of ATP, the intracellular concentrations of specific ions with respect to their concentrations in the extracellular environment, thereby creating an unequal distribution of the ions across the plasma membrane, namely, an ion gradient. In this way the cell counterbalances the osmotic forces due to the ions and macromolecules trapped inside it. An example of energy-dependent ion pump is Na+/K+ ATPase, which reduces the concentration of Na+ inside the cell relative to the outside.
Cell wall
Plant cells are surrounded by an extracellular matrix, the cell wall, that, being non expandable and positioned next to the plasma membrane, allows cell to resist osmotic forces that would cause its swelling and finally the lysis. How?
Inside mature plant cells, the vacuoles are the largest organelles, occupying about 80% of the total cell volume. Large quantities of solutes, for the most part organic and inorganic acids, are accumulated within them and osmotically draw water, causing their swelling. In turn, this causes the tonoplast, the membrane that surrounds the vacuole, to press the plasma membrane against the cell wall, that mechanically opposes to these forces and avoids the osmotic lysis. This osmotic pressure is called turgor pressure, and can reach up 2 MPa, that is, 20 atmospheres, a value about 10 times higher than the air pressure in tires. It is responsible for the rigidity of non woody parts of plants, is involved in plant growth, as well as in:
wilting of vegetables, due to its reduction;
plants movements, such as:
the circadian movements of the leaves;
the movements of the leaves of Dionaea muscipula, the Venus flytrap, or of the leaves of the sensitive plants such as Mimosa pudica.
Even in bacteria and fungi, the plasma membrane is surrounded by a cell wall that stably withholds the internal pressure, then preventing osmotic lysis of the cell.
Isotonic, hypotonic, and hypertonic solutions
By comparing the osmotic pressure of two solutions separated by a semipermeable membrane, it is possible to define three types of solutions, briefly described below.
The solutions are isotonic when they have the same osmotic pressure.
If the solutions have different osmotic pressures, that with the higher osmotic pressure is defined hypertonic with respect to the other.
If the solutions have different osmotic pressures, that with the lower osmotic pressure is defined hypotonic with respect to the other.
In biological systems, the cytosol is the reference solution; then, if we place a cell in a:
isotonic solution, no net flow of water occurs into or out of the plasma membrane;
hypertonic solution, there is a net flow of water out of the cell, therefore the cell loses water and shrinks;
hypotonic solution, there is a net flow of water into the cell, the cell swells and can burst, i.e., an osmotic lysis can occur.
In addition to ion pumps and the cell wall, in the course of evolution multicellular organisms have developed another mechanism to oppose the osmotic forces: to surround the cells with an isotonic solution or close to isotonicity that prevents, or at least limits, a net inflow or outflow of water. An example is plasma, that is, the liquid component of blood, which, due to the presence of salts and proteins, primarily albumin in humans, has an osmolarity similar to that of the cytosol.
Osmotic pressure, starch and glycogen
Living organisms store glucose in the form of polymers, glycogen in animals, fungi, bacteria, and starch in photoautotrophs, but not in the free form. In this way, they avoid that the osmotic pressure exerted by the stores of carbohydrates becomes too high. Indeed, since osmotic pressure, like the other colligative properties, depends only on the number of solute molecules, storing millions of glucose units in the form of a significantly lower number of polysaccharides allows to avoid an excessive pressure. Here are some examples.
A gram of polysaccharide, e.g. glycogen or starch, composed of 1000 glucose units has an effect on osmotic pressure lower than that of a milligram of free glucose.
In hepatocyte, if the glucose stored in the form of glycogen was present in the free form, its concentration would be about 0.4 M, whereas the polysaccharide concentration of about 0.04 μM, and this would cause a net flow of water inside the cell such as to lead to osmotic lysis.
Furthermore, even if osmotic lysis could be avoided, there would be problems with the transport of glucose into the cell. In humans, under physiological conditions, blood glucose levels range from 3.33 to 5.56 mmol/L (60-100 mg/dL); if glucose was present in the free form, its intracellular concentration would be 120 to 72 times greater than that of the blood, and its transport into the hepatocyte would entail a large energy expenditure.
Osmotic diarrhea
In the presence of diseases that cause non-absorbed and osmotically active solutes accumulation in the distal portion of the small intestine and in the colon, a condition known as osmotic diarrhea occurs.
Causes can be, for example, bacterial infections, pancreatic diseases, celiac disease, an autoimmune enteropathy due to gluten intake in genetically predisposed subjects, or a congenital deficiency of one of the disaccharidases of the brush border of enterocytes, such as in lactose intolerance. In these conditions, an incomplete carbohydrate digestion can occur as a consequence of a deficit of alpha-amylase and/or of one or more disaccharidases. Moreover, unabsorbed osmotically active solutes pass into the colon where they can be fermented by bacteria of gut microbiota, which is part of the human microbiota, resulting in production of excessive gas, such as hydrogen, carbon dioxide and methane, and short-chain fatty acids, mainly butyric acid, aceticacid and propioni acid. This causes a condition known as osmotic-fermentative diarrhea.
Osmotic diarrhea can also result from the use of osmotic laxatives such as polyethylene glycol or PEG, and magnesium sulfate.
Osmotically active solutes deriving from incomplete digestion, and osmotic laxatives lead to an increase in intraluminal osmotic pressure and inhibit the normal absorption of water and electrolytes, causing a reduction in the consistency of the stool and an increase in intestinal motility.
Osmotic pressure, galactosemia, and cataracts
Galactose, glucose and fructose are the monosaccharides that are absorbed in the intestine.
Galactose is metabolized mostly in the liver, and to a lesser extent by other organs and tissues. After conversion to UDP-glucose and UDP-galactose through the Leloir pathway, it can be used for both anabolic and catabolic purposes.
Mutations in one of the genes encoding the enzymes of the Leloir pathway leads to an accumulation of galactose and causes galactosemia, a genetic metabolic disorder whose only treatment is a galactose-restricted diet.
The accumulation of the monosaccharide fuels alternative metabolic pathways that lead to the synthesis of the galactose-related chemicals galactitol and galactonate.
The symptoms of galactosemia include cataracts, and the synthesis and accumulation of galactitol in the lens of the eye seems to be one of the triggers. Why? Galactitol is a poorly metabolized polyol, and, due to its poor lipophilicity does not diffuse through cell membranes and accumulates inside the cell. Being osmotically active, its accumulation causes an increase in intracellular osmotic pressure and then a net flow of water into the cell. Such osmotic effect seems to be one of the mechanisms through which galactitol contributes to the development of galactosemic cataracts.
References
Beauzamy L., Nakayama N., and Boudaoud A. Flowers under pressure: ins and outs of turgor regulation in development. Ann Bot 2014;114(7):1517-1533. doi:10.1093/aob/mcu187
Berg J.M., Tymoczko J.L., and Stryer L. Biochemistry. 5th Edition. W. H. Freeman and Company, 2002
Coelho A.I., Berry G.T., Rubio-Gozalbo M.E. Galactose metabolism and health. Curr Opin Clin Nutr Metab Care 2015;18(4):422-427. doi:10.1097/MCO.0000000000000189
Coelho A.I., Rubio-Gozalbo M.E., Vicente J.B., Rivera I. Sweet and sour: an update on classic galactosemia. J Inherit Metab Dis 2017;40(3):325-342. doi:10.1007/s10545-017-0029-3
Conte F., van Buuringen N., Voermans N.C., Lefeber D.J. Galactose in human metabolism, glycosylation and congenital metabolic diseases: time for a closer look. Biochim Biophys Acta Gen Subj 2021;1865(8):129898. doi:10.1016/j.bbagen.2021.129898
Multifunctional enzymes are proteins in which two or more enzymatic activities, that catalyze consecutive steps of a metabolic pathway, are located on the same polypeptide chain. It seems likely they have arisen by gene fusion events, and represent, like multienzyme complexes, a strategy of evolution to maximize catalytic efficiency, providing advantages that you wouldn’t have if such enzymatic activities were present on distinct proteins dissolved in the cytosol.
What advantages do multifunctional enzymes provide?
Living organisms fight against the natural processes of decay that, if not counteracted, leads to an increasing disorder, until death. At the molecular level, the maintenance of life is made possible by the extraordinary effectiveness achieved by enzymes in accelerating chemical reactions and avoiding side reactions. The rate of ATP turnover in a mammalian cell gives us an idea of the rate at which cellular metabolism proceeds: every 1-2 minutes, the entire ATP pool is turned over, namely, hydrolyzed and restored by phosphorylation. This corresponds to the turnover of about 107 molecules of ATP per second, and, for the human body, to the turnover of about 1 gram of ATP every minute. Some enzymes have even achieved catalytic perfection, that is, they are so efficient that nearly every collision with their substrates results in catalysis. And one of the factors limiting the rate of an enzymatic reaction is just the frequency with which substrates and enzymes collide. The simplest way to increase the frequency of collisions would be to increase the concentration of substrates and enzymes. However, due to the large number of different reactions that take place in the cell, this route is not feasible. In other words, there is a limit to the concentration that substrates and enzymes can reach, concentrations that are in the micromolar range for substrates, and even lower for enzymes. Exceptions are the enzymes of glycolysis in muscle cells and erythrocytes, present in concentrations of the order of 0.1 mM and even higher.
Metabolic channeling
One of the routes taken by evolution to increase the rate at which enzymatic reactions proceed is to select molecular structures, such as multifunctional enzymes and multienzyme complexes, that allow, through the optimization of the spatial organization of the enzymes of a metabolic pathway, to minimize the distance that the product of reaction A must travel to reach the active site that catalyzes the reaction B in the sequence, and so on, thus obtaining the substrate or metabolic channeling of the pathway itself. For some multifunctional enzymes and multienzyme complexes the channeling is obtained through intramolecular channels.
Metabolic channeling increases the catalytic efficiency, and then the reaction rate, in various ways, briefly described below.
It minimizes the diffusion of substrates in the bulk solvent, then their dilution; this allows to obtain high local concentrations, even when their concentration in the cell is low, thus increasing the frequency of enzyme-substrate collisions.
It minimizes the time required by substrates to diffuse from one active site to the next.
It minimizes the probability of side reactions.
It minimizes the probability that labile intermediates are degraded.
Multifunctional enzymes offer advantages with regard to the regulation of their synthesis, too: being encoded by a single gene, it is possible to coordinate the synthesis of all the enzymatic activities.
Finally, like multienzyme complexes, multifunctional enzymes allow the coordinated control of their catalytic activities. And, because the enzyme that catalyzes the committed step of the sequence often catalyzes the first reaction, this prevents the synthesis of unneeded molecules, which would be produced if the control point were downstream of the first reaction, as well as a waste of energy and the removal of metabolites from other metabolic pathways.
Examples of multifunctional enzymes
Like multienzyme complexes, multifunctional enzymes, too, are very common and involved in many metabolic pathways, both anabolic and catabolic.
Here are some examples.
Acetyl-CoA carboxylase
Acetyl-CoA carboxylase or ACC (EC 6.4.1.2), a biotin-dependent carboxylase, is composed of two enzymes, a biotin carboxylase (EC 6.3.4.14) and a carboxyltransferase, plus a biotin carboxyl-carrier protein or BCCP. ACC catalyzes the synthesis of malonyl-CoA by the carboxylation of acetyl-CoA. The reaction, which is the committed step of the synthesis of fatty acids, proceeds in two steps. In the first step, biotin carboxylase catalyzes, at the expense of ATP, the carboxylation of a nitrogen atom of biotin, that acts as a carbon dioxide (CO2) carrier, while the source of CO2 is bicarbonate ion. In the second step, carboxyltransferase catalyzes the transfer of the carboxyl group from carboxybiotin to acetyl-CoA to form malonyl-CoA. Malonyl-CoA is the donor of an activated two carbon unit to fatty acid synthase (EC 2.3.1.85) during fatty acid elongation.
In mammals and birds, acetyl-CoA carboxylase is a multifunctional enzyme, as biotin carboxylase activity and carboxyltransferase activity, plus BCCP, are located on the same polypeptide chain.
Conversely, in bacteria it is a multienzyme complex made up of three distinct polypeptide chains, namely, the two enzymes plus BCCP.
Both forms are present in higher plants.
Type I fatty acid synthase
Fatty acid synthase or FAS catalyzes the synthesis of palmitic acid using malonyl-CoA, the product of the reaction catalyzed by acetyl-CoA carboxylase, as a donor of two-carbon units.
There are two types of FAS.
In fungi and animals, it is a multifunctional enzyme, and is called type I. The animal enzyme is an homodimer, and each polypeptide chain contains all seven enzymatic activities plus acyl carrier protein or ACP. In yeast and fungi FAS consists of two multifunctional subunits, called α and β, arranged in an α6β6 heterododecameric structure.
In most prokaryotes and in plants, fatty acid synthase, called type II, it is not a multifunctional enzyme but a multienzyme complex, being composed of distinct enzymes plus ACP.
PRA-isomerase:IGP synthase
The synthesis of the amino acid tryptophan from chorismate involves several steps, briefly described below.
In the first step, glutamine donates a nitrogen to the indole ring of chorismate, that is converted to anthranilate, and glutamine to glutamate; the reaction is catalyzed by anthranilate synthase (EC 4.1.3.27). Anthranilate is phosphoribosylated to form N-(5’-phosphoribosyl)-anthranilate or PRA, in a reaction catalyzed by anthranilate phosphoribosyltransferase (EC 2.4.2.18); in the reaction 5-phosphoribosyl-1-pyrophosphate or PRPP acts as a donor of a 5-phosphoribosyl group. In the next step, catalyzed by PRA isomerase (EC 5.3.1.24), PRA is isomerized to enol-1-o-carboxyphenylamino-1-deoxyribulose phosphate or CdRP. PRA e CdRP are an example of structural isomerism.
CdRP is converted to indole-3-glycerol phosphate or IGP, in a reaction catalyzed by indole-3-glycerol phosphate synthase or IGP synthase (EC 4.1.1.48). Finally, tryptophan synthase (EC 4.2.1.20) catalyzes the last two steps of the pathway: the conversion of IGP to indole, a hydrolysis, and the reaction of indole with a serine to form tryptophan.
In E. coli, PRA isomerase and IGP synthase are located on a single polypeptide chain, which is therefore a bifunctional enzyme. In other microorganisms, such as Bacillus subtilis, Salmonella typhimurium and Pseudomonas putida, the two catalytic activities located on distinct polypeptide chains.
Conversely, tryptophan synthase is a classic example of a multienzyme complex, and one of the best characterized examples of metabolic channeling.
Glutamine-PRPP amidotransferase
Glutamine-PRPP amidotransferase or GPATase (EC 2.4.2.14) catalyzes the first of ten steps leading to de novo synthesis of purine nucleotides, namely, the formation of 5-phosphoribosylamine through the transfer of the glutamine amide nitrogen to PRPP. Note that glutamine acts as a nitrogen donor.
The reaction proceeds in two steps, which take place on different active sites, an N-terminal active site and a C-terminal active site.
In the first step, the N-terminal active site catalyzes the hydrolysis of glutamine amide nitrogen to form glutamate and ammonia.
During the second step, catalyzed by the C-terminal active site, which has phosphoribosyltransferase activity, the released ammonia is attached at the C-1 of PRPP to form 5-phosphoribosylamine. In this step the inversion of configuration about the C-1 position of the ribose, from α to β, occurs, then establishing the anomeric form of the future nucleotide.
There are three control points that cooperate in the regulation of de novo synthesis of purine nucleotides, and the reaction catalyzed by glutamine-PRPP amidotransferase, the first committed step of the pathway, is the first control point.
Like in bacterial carbamoyl phosphate synthetase complex (EC 6.3.4.16), the active sites of this multifunctional enzyme are connected through an intramolecular channel. However, this channel is shorter, being about 20 Å long, and lined by conserved nonpolar amino acids, then, it is highly hydrophobic. Lacking hydrogen-bonding groups, it does not impede the diffusion of the ammonia to the other active site.
CAD
The de novo synthesis of pyrimidine nucleotides occurs through a series of enzymatic reactions that, unlike de novo synthesis of purine nucleotides, begins with the formation of the pyrimidine ring, which is then bound to ribose 5-phosphate. The first three steps of the pathway are catalyzed sequentially by carbamoyl phosphate synthetase, aspartate transcarbamoylase (EC 2.1.3.2), and dihydroorotase (EC 3.5.2.3), and are common to all species.
In the first step, carbamoyl phosphate synthetase, which has two enzymatic activities, namely, a glutamine-dependent amidotransferase and a synthase, catalyzes the synthesis of carbamoyl phosphate from glutamine, bicarbonate ion and ATP. In the second step, which is the committed step of the metabolic pathway and is catalyzed by aspartate transcarbamoylase, carbamoyl phosphate reacts with aspartate to form N-carbamoyl aspartate. Finally, dihydroorotase, catalyzing the removal of H2O from N-carbamoyl aspartate, leads to the closure of the pyrimidine ring to form of L-dihydroorotate.
In eukaryotes, particularly in mammals, in Drosophila and Dictyostelium, a genus of amoebae, the three enzymatic activities are located on a single polypeptide chain, encoded by a gene derived from a gene fusion event occurred at least 100 million years ago. The multifunctional enzyme, known by the acronym CAD, is a homomultimer of three subunits or more.
Conversely, in prokaryotes, the three enzymes are distinct, and carbamoyl phosphate synthase is an example of a multienzyme complex.
In yeasts the dihydroorotase is present on a distinct protein.
Studies on enzyme activity have revealed the existence of a substrate channeling, more effective in yeast protein, with respect to the first two steps, than in that of mammals.
References
Alberts B., Johnson A., Lewis J., Morgan D., Raff M., Roberts K., Walter P. Molecular Biology of the Cell. 6th Edition. Garland Science, Taylor & Francis Group, 2015
Eriksen T.A., Kadziola A., Bentsen A-K., Harlow K.W. & Larsen S. Structural basis for the function of Bacillus subtilis phosphoribosyl-pyrophosphate synthetase. Nat Struct Biol 2000:7;303-308. doi:10.1038/74069
Hyde C.C., Ahmed S.A., Padlan E.A., Miles E.W., and Davies D.R. Three-dimensional structure of the tryptophan synthase multienzyme complex from Salmonella typhimurium. J Biol Chem 1988:263(33);17857-17871. doi:10.1016/S0021-9258(19)77913-7
Hyde C.C., Miles E.W. The tryptophan synthase multienzyme complex: exploring structure-function relationships with X-ray crystallography and mutagenesis. Nat Biotechnol 1990:8;27-32. doi:10.1038/nbt0190-27
Michal G., Schomburg D. Biochemical pathways. An atlas of biochemistry and molecular biology. 2nd Edition. John Wiley J. & Sons, Inc. 2012
Muchmore C.R.A., Krahn J.M, Smith J.L., Kim J.H., Zalkin H. Crystal structure of glutamine phosphoribosylpyrophosphate amidotransferase from Escherichia coli. Protein Sci 1998:7;39-51. doi:10.1002/pro.5560070104
Nelson D.L., Cox M.M. Lehninger. Principles of biochemistry. 6th Edition. W.H. Freeman and Company, 2012
Pareek V., Sha Z., He J., Wingreen N.S., Benkovic SJ. Metabolic channeling: predictions, deductions, and evidence. Mol Cell 2021;81(18):3775-3785. doi:10.1016/j.molcel.2021.08.030
Yon-Kahn J., Hervé G. Molecular and cellular enzymology. Springer, 2009
Multienzyme complexes are discrete and stable structures composed of enzymes associated noncovalently that catalyze two or more sequential steps of a metabolic pathway.[7]
They can be considered a step forward in the evolution of catalytic efficiency as they provide advantages that individual enzymes, even those that have achieved catalytic perfection, would not have alone.[1][12]
During evolution, some enzymes evolved to reach a virtual catalytic perfection, namely, for such enzymes nearly every collision with their substrate results in catalysis. Examples are:
fumarase (EC 4.2.1.2), which catalyzes the seventh reaction of the citric acid cycle, the reversible hydration/dehydration of fumarate’s double bond to form malate;
acetylcholinesterase (EC 3.1.1.7), which catalyses the hydrolysis of acetylcholine, a neurotransmitter, to choline and acetic acid, which in turn dissociates to form an hydrogen ion and acetate;
superoxide dismutase (EC 1.15.1.1), which catalyzes the conversion, and then the inactivation, of the highly reactive superoxide radical, (O2.-), to hydrogen peroxide (H2O2) and water;
catalase (EC 1.11.1.6), which catalyzes the degradation of H2O2 to water and oxygen.
Then, the rate at which an enzymatic reaction proceeds is partly determined by the frequency with which enzymes and their substrates collide. Hence, a simple way to increase it is to increase the concentrations of enzymes and substrates. However, their concentrations cannot be high because of the enormous number of different reactions that occur within the cell. And in fact in the cells most reactants are present in micromolar concentrations (10-6 M), whereas most enzymes are present in much lower concentrations.[1][12]
So, evolution has taken different routes to increase the reaction rate, one of which has been to optimize the spatial organization of enzymes with the formation of multienzyme complexes and multifunctional enzymes, that is, structures that allow minimizing the distance that the product of a reaction must travel to reach the active site that catalyzes the subsequent step in the sequence, being active sites close to each other.[2][7] In other words, what happens is the substrate or metabolic channeling,[8][9][14] that can also occur through intramolecular channels connecting the active sites, as in the case of, among the multienzyme complexes, tryptophan synthase complex (EC 4.2.1.20),[3][4] whose tunnel was the first to be discovered, and bacterial carbamoyl phosphate synthase complex (EC 6.3.4.16).[5][13]
Metabolic channeling can increase the reaction rate, but more generally, the catalytic efficiency, in several ways, briefly described below.[8][12]
The diffusion of substrates and products in the bulk solvent is minimized, then their dilution and decrease of concentration, too. This leads to the production of high local concentrations, even when their intracellular concentration is low. In turn this leads to an increase in the frequency of enzyme-substrate collisions.
The time required by substrates to diffuse between successive active sites is minimized.
The probability of side reactions is minimized.
Chemically labile intermediates are protected from degradation by the solvent.
Another metabolic advantage of multienzyme complexes, similarly to what happens with multifunctional enzymes, is that they allow to control coordinately the catalytic activity of the enzymes that compose them. And taking into account that the enzyme that catalyzes the first reaction of a pathway is often the regulatory enzyme, it is possible to avoid:
the synthesis of unneeded intermediates, which would be produced if the sequence of reactions were regulated downstream of the first reaction;
the removal of metabolites from other pathways as well as a waste of energy.
Examples
From what was said above, it is not surprising that, especially in eukaryotes, the multienzyme complexes, like multifunctional enzymes, are common and involved in different metabolic pathways, both anabolic and catabolic, whereas there are few enzymes that diffuse freely in solution. Below are some examples.
2-Ketoacid dehydrogenase family
A classic example of multienzyme complexes are the three complexes belonging to the 2-ketoacid dehydrogenase family, also called 2-oxoacid dehydrogenase family, namely:
the branched-chain alpha-keto acid dehydrogenase complex (BCKDH);
the alpha-ketoglutarate dehydrogenase complex, also called 2-oxoglutarate dehydrogenase (OGDH).[2][6][7][10]
Alpha-Ketoglutarate Dehydrogenase Complex
These complexes are similar both from structural and functional points of view.
For example, PDC is composed of multiple copies of three different enzymes:
pyruvate dehydrogenase or E1 (EC 1.2.4.1);
dihydrolipoyl transacetylase or E2 ;(EC 2.3.1.12);
dihydrolipoyl dehydrogenase or E3 (EC 1.8.1.4).
Then, PDC, both in prokaryotes and eukaryotes, has the basic E1-E2-E3 structure, a structure also found in the other two complexes.[15] Moreover, within a given species:
dihydrolipoyl dehydrogenase is identical;
pyruvate dehydrogenase and dihydrolipoyl transacetylase are homologous.
And, although these enzymes are specific for their substrates, they use the same cofactors, namely, coenzyme A, NAD, thiamine pyrophosphate, FAD, and lipoamide.
In order to differentiate them, for the pyruvate dehydrogenase complex, the alpha-ketoglutarate dehydrogenase complex, and the branched-chain alpha-ketoacid dehydrogenase complex, they are indicated, respectively:
E1p, E1o and E1b (EC 1.2.4.4);
E3p, E3o, and E3b (EC 1.8.1.4).
Note: the eukaryotic PDC is the largest multienzyme complex known, larger than a ribosome, and can be visualized with the electron microscope.[2]
The pyruvate dehydrogenase complex is the bridge between glycolysis and the citric acid cycle, and catalyzes the irreversible oxidative decarboxylation of pyruvate, molecule that belongs to the group of keto acids, in particular it is an alpha-ketoacid. During the reactions the carboxyl group of pyruvate is released as carbon dioxide (CO2) and the resulting acetyl group is transferred to coenzyme A to form acetyl-coenzyme A. Furthermore, two electrons are released and transferred to NAD+.
Even during the reactions catalyzed by the alpha-ketoglutarate dehydrogenase complex and the branched-chain alpha-keto acid dehydrogenase complex, respectively, the fourth reaction of the citric acid cycle, the oxidation of alpha-ketoglutarate to succinyl-CoA, and the oxidation of alpha-keto acids deriving from the catabolism of the branched-chain amino acids valine, leucine and isoleucine, it occurs:
the release of the carboxyl group of the α-keto acid as CO2;
the transfer of the resulting acyl group to coenzyme A to form the acyl-CoA derivatives;
the reduction of NAD+ to NADH.
The remarkable similarity between protein structures, required cofactors and reaction mechanisms undoubtedly reflect a common evolutionary origin.
Tryptophan synthase complex
The tryptophan synthase complex is one of the best-studied examples of substrate channeling.[3][12][14] Present in bacteria and plants, but not in animals, in bacteria it is composed of two α and two β subunits associated as αβ dimers, which are considered the functional unit of the complex, in turn associated to form an αββα tetramer.[4][5][8]
The complex catalyzes the final two steps of the synthesis of tryptophan. In the first step, indole-3-glycerol phosphate undergoes an aldol cleavage, catalyzed by a lyase (EC 4.1.2.8) present on the α subunits, to yield indole and a molecule of glyceraldehyde 3-phosphate. Indole then reaches the active site of the β subunit via a about 30 Å long hydrophobic tunnel that, in each αβ dimers, connects the two active sites. In the second step, in the presence of pyridoxal 5-phosphate, a condensation between indole and a serine forms tryptophan.
Acetyl-CoA carboxylase
Acetyl-CoA carboxylase (ACC) (EC 6.4.1.2), a member of the biotin-dependent carboxylase family, catalyzes the committed step of de novo synthesis of fatty acids, namely, the carboxylation of acetyl-CoA to malonyl-CoA, which, in turn, serves as a donor of two-carbon units for the elongation process leading to the synthesis of palmitic acid, catalyzed by fatty acid synthase (EC 2.3.1.85).[9][11][12]
In bacteria, ACC is an multienzyme complex composed of two enzymes, biotin carboxylase (EC 6.3.4.14) and a carboxytransferase, plus a biotin carboxyl-carrier protein or BCCP.
Conversely, in mammals and birds, it is a multifunctional enzyme, as the two enzymatic activities, and BCCP, are present on the same polypeptide chain.[2]
In higher plants both forms are present.
Carbamoyl phosphate synthetase complex
Another well-characterized example of substrate channeling is the bacterial carbamoyl phosphate synthetase complex,[9][12][14] which catalyzes the synthesis of carbamoyl phosphate, needed for pyrimidine and arginine synthesis. The complex has a about 100 Å long tunnel that connects the three active sites.[13]
The first active site catalyzes the release of the amide nitrogen of glutamine as ammonium ion, that enters the tunnel and reaches the second active site where, at the expense of ATP, is combined with bicarbonate to yield carbamate, that, in the last active site, is phosphorylated to carbamoyl phosphate.
References
^ ab Alberts B., Johnson A., Lewis J., Morgan D., Raff M., Roberts K., Walter P. Molecular biology of the cell. 6th Edition. Garland Science, Taylor & Francis Group, 2015
^ ab Hilario E., Caulkins B.G., Huang Y-M. M., You W., Chang C-E. A., Mueller L.J., Dunn M.F., and Fan L. Visualizing the tunnel in tryptophan synthase with crystallography: insights into a selective filter for accommodating indole and rejecting water. Biochim Biophys Acta 2016;1864(3):268-279. doi:10.1016/j.bbapap.2015.12.006
^ ab Hyde C.C., Ahmed S.A., Padlan E.A., Miles E.W., and Davies D.R. Three-dimensional structure of the tryptophan synthase multienzyme complex from Salmonella typhimurium. J Biol Chem 1988;263(33):17857-17871. doi:10.1016/S0021-9258(19)77913-7
^ ab Hyde C.C., Miles E.W. The tryptophan synthase multienzyme complex: exploring structure-function relationships with X-ray crystallography and mutagenesis. Nat Biotechnol 1990:8;27-32. doi:10.1038/nbt0190-27
^ Koolman J., Roehm K-H. Color atlas of Biochemistry. 2nd Edition. Thieme, 2005
^ abc Michal G., Schomburg D. Biochemical pathways. An atlas of biochemistry and molecular biology. 2nd Edition. John Wiley J. & Sons, Inc. 2012
^ abc Moran L.A., Horton H.R., Scrimgeour K.G., Perry M.D. Principles of Biochemistry. 5th Edition. Pearson, 2012
^ abc Nelson D.L., Cox M.M. Lehninger. Principles of biochemistry. 6th Edition. W.H. Freeman and Company, 2012
^ Perham R.N., Jones D.D., Chauhan H.J., Howard MJ. Substrate channeling in 2-oxo acid dehydrogenase multienzyme complexes. Biochem Soc Trans 2002;30(2):47-51. doi:10.1042/bst0300047
The pyruvate dehydrogenase complex (PDC) is one of the mitochondrial multienzyme complexes, and is composed of three different enzymes:
pyruvate dehydrogenase or E1 (EC 1.2.4.1);
dihydrolipoyl transacetylase or dihydrolipoamide acetyltransferase or E2 (EC 2.3.1.12);
dihydrolipoyl dehydrogenase or dihydrolipoamide dehydrogenase or E3 (EC 1.8.1.4).
Each of these enzymes is present in multiple copies whose number, and then the size of the complex itself, varies from species to species, with molecular masses ranging from 4×10⁶ to 1×10⁷ daltons.
The multienzyme complex contains additional subunits:
five different coenzymes;
in plants, fungi, and among animals, aves and mammals, two enzymes with regulatory properties: a Mg2+-dependent pyruvate dehydrogenase kinase (EC 2.7.1.99) and a Ca2+-activated pyruvate dehydrogenase phosphatase(EC 3.1.3.43);
in eukaryotes, a binding protein called E3BP.
The pyruvate dehydrogenase complex catalyzes, through five sequential reactions, the oxidative decarboxylation of pyruvate, an α-keto acid, to form a carbon dioxide molecule (CO2) and the acetyl group of acetyl-coenzyme A or acetyl-CoA, with the release of two electrons, carried by NAD.
PDC Reaction
The overall reaction is essentially irreversible, with a ΔG°’ of -8.0 kcal/mol (-33.4 kJ/mol), and requires the intervention of the three enzymes, whose activities are sequentially coordinated. During the reactions, the intermediate products remain bound to the enzymes and, at the end of the reaction sequence, the multienzyme complex is ready for the next cycle;.
The Five Reactions Catalyzed by the PDC
Note: the pyruvate dehydrogenase complex catalyzes the same reactions through similar mechanisms in all organisms.
Five coenzymes are used in the pyruvate dehydrogenase complex reactions: thiamine pyrophosphate or TPP, flavin adenine dinucleotide or FAD, coenzyme A or CoA, nicotinamide adenine dinucleotide or NAD, and lipoic acid.
Thiamine pyrophosphate is the active form of thiamine or vitamin B1. TPP is the coenzyme of pyruvate dehydrogenase, to which it is strictly bound through noncovalent interactions. It is involved in the transfer of hydroxyethyl or “activated aldehyde” groups.
Flavin adenine dinucleotide is one the active forms of riboflavin or vitamin B2; the other is flavin mononucleotide (FMN).
Reduced and Oxidized Form of Flavin Adenine Dinucleotide
FAD is the coenzyme of dihydrolipoyl dehydrogenase, to which it is strictly bound. Like NAD, it participates in electron transfer, or hydride ion (:H– or H+ + 2e–) transfer.
Coenzyme A consists of a β-mercaptoethylamine group connected to pantothenic acid or vitamin B5 through an amide linkage, which, in turn, is bonded to 3′-phosphoadenosine moiety, through a pyrophosphate bridge.
CoA is involved in the reaction catalyzed by dihydrolipoyl transacetylase, and acts as a carrier of acyl groups.
Coenzyme A and Acetyl-coA
The β-mercaptoethylamine moiety terminates with a sulfhydryl group (–SH), a reactive thiol crucial for the role played by the coenzyme, because the acyl groups bonded to it through a thioester bond have a high standard free energy of hydrolysis. This provides acyl groups with a high transfer potential, equal to -31.5 kcal/mol (-7.5 kJ/mol), slightly more exergonic [1 kJ/mol (0.2 kcal/mol )] than that for the hydrolysis of ATP to ADP and Pi. Thioesters have therefore a high transfer potential of the acyl group and can donate it to a variety of molecules, that is, such acyl group can be considered as an activated group ready for a transfer. It is also possible to state that the formation of the thioester bond allows to conserve a portion of the free energy derived from the oxidation of the metabolic fuel. It should be noted that coenzyme A is also abbreviated as CoA-SH to emphasize the role played by the thiol group.
Note: in the thioester bond a sulfur atom sits in the position where an oxygen atom is in the ester bond.
Ester and Thioester Bonds
Nicotinamide adenine dinucleotide can be synthesized from tryptophan, an essential amino acid, or from niacin or vitamin B3 or vitamin PP, from Pellagra-Preventing, the source of the nicotinamide moiety.
Reduced and Oxidized Form of Nicotinamide Adenine Dinucleotide Phosphate
NAD is involved in the reaction catalyzed dihydrolipoyl dehydrogenase, and, like FAD, participates in electron transfer, or hydride transfer.
Unlike the other coenzymes of the pyruvate dehydrogenase complex, lipoic acid does not derive, directly or indirectly, from vitamins and/or essential amino acids, that is, from building blocks that cannot be synthesized de novo by the organism and must be supplied by the diet.
It is the coenzyme of dihydrolipoyl transacetylase, to which it is covalently bound, through an amide linkage, to the ɛ-amino group of a lysine residue to form a lipoyl-lysine or lipoamide, the so-called lipoyllysyl arm. It couples electron transfer to acyl group transfer.
Lipoamide or Lipoyl-lysine
Lipoic acid has two thiol groups that can undergo a reversible intramolecular oxidation to form a disulfide bridge (-S-S-), a reaction analogous to that between two cysteine (Cys) residues of a protein.
Because the disulfide bridge (note: a cyclic disulfide) is capable of undergoing redox reactions, during the reactions catalyzed by the pyruvate dehydrogenase complex, it is first reduced to dihydrolipoamide, a dithiol or the reduced form of the prosthetic group, and then, reoxidized to the cyclic form.
Note
Many enzymes require small non protein components, called cofactors, for their catalytic activity. Cofactors can be metal ions or small organic or metalloorganic molecules, and are classified as coenzymes and prosthetic groups.
A prosthetic group is cofactor that binds tightly to an enzyme by non-covalent or covalent bond, namely, it is permanently bound to the protein.
A coenzyme is cofactor that is not permanently bound to the enzyme.
Where is the pyruvate dehydrogenase complex located?
In eukaryotes, the pyruvate dehydrogenase complex, like the enzymes for citric acid cycle and oxidation of fatty acids, is located in the mitochondrion, where is associated with the surface of the inner membrane facing the matrix.
In prokaryotes, it is located in the cytosol.
Functions of the pyruvate dehydrogenase complex
The main functions of the pyruvate dehydrogenase complex are to produce acetyl-CoA and NADH.
The acetyl group linked to coenzyme A, an activated acetate, depending on the metabolic conditions within the cell and/or the cell type, can be:
oxidized to two carbon dioxide molecules via the citric acid cycle reactions to harvest a portion of the potential energy stored in the form of ATP or GTP;
utilized for the synthesis of fatty acids, cholesterol, steroids, isoprenoids, ketone bodies and acetylcholine.
It is therefore possible to state that, depending on the metabolic conditions and/or cell type, the pyruvate dehydrogenase complex commits carbon intermediates from amino acid and glucose catabolism to:
citric acid cycle, and then to the production of energy, e.g. in skeletal muscle in aerobic conditions, and, always, in cardiac muscle;
synthesis of lipids and acetylcholine.
In aerobic organisms, NADH can be oxidized to NAD+ via hydride ion transfer to the mitochondrial electron transport chain that, in turn, carries the two electrons to molecular oxygen (O2), allowing the production of 2.5 ATP molecules per pair of electrons.Note: in anaerobic organisms there are electron acceptors alternative to oxygen, such as sulfate or nitrate.
Conceptually, the pyruvate dehydrogenase complex is the bridge between glycolysis and the citric acid cycle. However, due to the irreversibility of the overall reaction catalyzed by the multienzyme complex, it acts as an one-way bridge: pyruvate can be decarboxylated, oxidized and the remaining acetyl unit linked to the CoA, but it is not possible to carry out the opposite reaction, namely, to convert acetyl-CoA into pyruvate.
The irreversibility of this reaction, and the absence of alternative pathways, explain why it is not possible to use acetyl-CoA, and therefore fatty acids, as a substrate for gluconeogenesis.
Other sources of acetyl-CoA
Other than pyruvate, the acetyl group of acetyl-CoA can derive from the oxidation of fatty acids and the catabolism of many amino acids. However, regardless of its origin, acetyl-CoA represents an entry compound for new carbon units into the citric acid cycle. And, it is also possible to state that the acetyl group of acetyl-CoA represents the form in which most of the carbon enters the cycle.
Sources of pyruvate
Pyruvate can derive from different cytosolic sources.
Under physiological conditions, in most cells it derives mainly from glycolysis: the oxidation of a glucose molecule yields two pyruvate molecules.
Lactate can be oxidized to pyruvate in the reaction catalyzed by lactate dehydrogenase (EC 1.1.1.27). In fact, isoenzymes in which the H subunit predominates, such as LDH1 or H4, a homopolymer of H subunits found in cardiac muscle, a tissue with completely aerobic metabolism, preferentially catalyze lactate oxidation.
Lactate oxidation can occurs in hepatocytes, too, during gluconeogenesis, favored by the low NADH/NAD+ ratio in the cytosol.
It should be noted that lactate is a metabolite deriving from the catabolism of glucose, and therefore from carbohydrate catabolism.
Another source is malate, by the reaction catalyzed by the cytosolic malic enzyme (EC 1.1.1.40), which is implicated in the exchange of intermediates of the citric acid cycle, such as oxaloacetate, malate and citrate, between the cytosol and the mitochondrial matrix.
Malate + NADP+ → Pyruvate + CO2 + NADPH + H+
Finally, the carbon skeleton of six amino acids, namely, alanine, cysteine, glycine, serine, threonine and tryptophan, can be partly or completely converted into pyruvate.
In turn, pyruvate is a metabolic intermediate which can be metabolized by different pathways, both anabolic and catabolic. Examples are gluconeogenesis, the synthesis of lipids, and the oxidative metabolism. In addition, it can have an anaplerotic function, playing a role in the maintenance of the metabolic flow through the acid cycle citric.
Mitochondrial pyruvate transport
In eukaryotes, glycolysis occurs in the cytosol whereas all the subsequent steps of the aerobic metabolism, that is, the reactions catalyzed by the pyruvate dehydrogenase complex, the citric acid cycle, the electron transport chain, and the oxidative phosphorylation occur in the mitochondria.
Similarly to most other metabolites and anions, the transport of pyruvate across the outer mitochondrial membrane is probably mediated by a relatively non-specific, voltage-dependent anion channel. Conversely, its transport across the inner mitochondrial membrane occurs through a specific transporter made up of two proteins named MPC1 and MPC2, acronym of mitochondrial pyruvate carrier, which form a hetero-oligomeric complex in the membrane.
Structure of the pyruvate dehydrogenase complex
Although the pyruvate dehydrogenase complex is composed of multiple copies of three different enzymes and catalyzes the same reactions by similar mechanisms in all the organisms in which it is present, it has a very different quaternary structure.
The structure of E. coli multienzyme complex, which has a weight of ∼4,600 kD and a diameter of ∼300 Å, was the first to be characterized, thanks to the work of Lester Reed. In this complex, 24 units of dihydrolipoyl transacetylase form a structure with cubic symmetry, namely, the enzymes, associated as trimers, are placed at the corners of a cube. Dimers of pyruvate dehydrogenase are associated with dihydrolipoyl transacetylase core, at the center of each edge of the cube, for a total of 24 units. Finally, dimers of dihydrolipoyl dehydrogenase are located at the center of each of the six faces of the cube, for a total of 12 units. Note that the entire complex is composed of 60 units. A similar structure with cubic symmetry is also found in most other Gram-negative bacteria.
In some Gram-positive bacteria and in eukaryotes, the pyruvate dehydrogenase complex has a dodecahedral form, namely, that of a regular polyhedron with 20 vertices, 12 pentagonal faces, and 30 edges, with icosahedral symmetry, also called I symmetry. Considering for example the multienzyme complex present in mitochondria, it is the largest known multienzyme complex, with a weight of ∼10,000 kD and a diameter of ∼500 Å, so more than 5 times the size of a ribosome. Noteworthy, it can be visualized with the electron microscope. The complex is composed of a dodecahedral core, with a diameter of about 25 nm, formed, as in Gram-negative bacteria, by dihydrolipoyl transacetylase, but consisting of 20 trimers of the enzyme, for a total of 60 units, located at the vertices of the structure. Its core is surrounded by 30 units of pyruvate dehydrogenase, one centered on each edge, and 12 units of dihydrolipoyl dehydrogenase, one centered on each face. The entire complex is therefore composed of 102 units.
The quaternary structure of the complex is further complicated, as mentioned previously, by the presence of three additional subunits: a pyruvate dehydrogenase kinase, a pyruvate dehydrogenase phosphatase, and the E3-binding protein.
Kinase and phosphatase are bound to the dihydrolipoyl transacetylase core.
E3BP is bound to each of the 12 pentagonal faces, and therefore is present in about 12 copies. It is required to bind dihydrolipoyl dehydrogenase to the core of dihydrolipoyl transacetylase, as demonstrated by the fact that its partial proteolysis decreases the binding ability of the dehydrogenase. In E3-binding protein it is possible to identify a C-terminal domain, that has no catalytic activity, and a lipoamide-containing domain, similar to that of dihydrolipoyl transacetylase, capable of accepting an acetyl group, too. However, the removal of this domain does not cause any reduction of the catalytic activity of the multienzyme complex.
Structure of pyruvate dehydrogenase or E1
Pyruvate dehydrogenase of eukaryotes and some Gram-positive bacteria is composed of two different polypeptide chains, called α and β, associated to form a 2-fold symmetric α2β2 heterotetramer. Conversely, in E. coli and other Gram-negative bacteria the two subunits are fused to form a single polypeptide chain, and the enzyme is a homodimer.
The enzyme has two active sites.
Considering the heterotetrameric structure of Bacillus stearothermophilus pyruvate dehydrogenase, a Gram-positive bacteria, each thiamine pyrophosphate binds between the N-terminal domains of an α and a β subunit, at the end of a ∼21 Å deep funnel-shaped channel leading to the active site, with its reactive group, the thiazole ring, closest to the channel entrance. At the entrance this channel there are also two conserved loops, essential both for the catalytic activity of the enzyme and for its regulation. The X-ray analysis of B. stearothermophilus enzyme, when it binds both TPP and the peripheral subunit-binding domain (PSBD) of dihydrolipoyl transacetylase, which binds to the C-terminal domain of the β subunits, has revealed that, in addition to a heterotetramer with a very tight structure, the two active sites have a different structure, in particular regarding the arrangement of the two conserved loops. In fact, in one enzyme subunit, in the presence of the activated form of thiamine pyrophosphate, the inner loop is ordered in a way that it blocks the entrance to the active site, whereas the loop at the entrance of the other active site is disordered and does not block the entrance. This explains, from a structural point of view, the observed differences in the rate of substrate binding exhibited by the two active sites. A similar arrangement and asymmetry have been observed in all thiamine pyrophosphate-dependent enzymes of which the structure has been solved.
In addition to TPP and a magnesium ion (Mg2+), located in each of the two active sites, a third Mg2+ is located at the centre of the tetramer, within a ∼20 Å deep solvent-filled tunnel that connects the two active sites. The tunnel is largely lined by 10 conserved amino acid residues from all four subunits, in particular glutamate (Glu) and aspartate (Asp), six and four, respectively, plus other acidic residues around the TPP aminopyrimidine ring. And it should be underlined the absence of basic residues to neutralize them. Similar tunnels have been found in all thiamine pyrophosphate-dependent enzymes with known crystalline structure, with dimeric or tetrameric structure, for example in transketolase, an enzyme of the pentose phosphate pathway.
Note: B. stearothermophilus belongs to the phylum Firmicutes and is recently renamed Geobacillus stearothermophilus.
What is the function of the acidic tunnel?
Through mutagenesis experiments on B. stearothermophilus pyruvate dehydrogenase, the tunnel has been shown to play a role in the catalytic mechanism.
The change of some of the aforementioned acidic residues to neutral amino acids does not alter, compared with the wild-type pyruvate dehydrogenase:
the efficiency of incorporation of the modified enzyme into the multienzyme complex;
the structure of active sites;
the quaternary structure of the enzyme.
However, rate of decarboxylation is reduced by over 70% compared to the wild-type enzyme, as well as, once the multienzyme complex is assembled with the mutant pyruvate dehydrogenase, the PDC activity, which is reduced by over 85% compared to the wild-type complex. But how does this occur?
Because the distance between the substituted amino acids and the active sites is ≥7 Å, that is, these amino acids are remote from the active sites of pyruvate dehydrogenase, they cannot directly influence its catalytic activity. Then, the catalytic mechanism described below was proposed.
Considering the apoenzyme, thiamine pyrophosphate binds fast and strongly to the first active site, is activated, and the active site is closed, thus protecting the zwitterionic thiazolium from the external environment.
Conversely, in the second active site TPP binds, but is not activated, and the active site remains in an open conformation.
In the first active site, pyruvate reacts with the thiazolium C-2, and thiamine pyrophosphate of the second active site, which is a general acid, donates a proton to the first site. The result is a decarboxylation in the first site and the activation of the coenzyme in the second site, which is then closed.
It should be noted that while the activation of the first thiamine pyrophosphate is the result of the binding to the active site, the activation of the second coenzyme, and therefore of the second active site, is coupled to the decarboxylation of pyruvate in the first active site. Or, from another point of view, while an active site requires a general acid, the other requires a general base.
Protons are needed for the catalytic activity, and their transport between the two active sites occurs via the acidic tunnel. They are reversibly shuttled along a chain of donor-acceptor groups provided by glutamate and aspartate residues and the entrained water, that act as a proton wire.
It seems, therefore, that unlike many other enzymes, in which the communication between the active sites occurs through conformational changes and subunit rearrangements, in pyruvate dehydrogenase and in the other TPP-dependent enzymes, the proton wire is the molecular basis of such communication.
At this point, the holoenzyme has been formed and the active sites are in a dynamic equilibrium, each exchanging between the dormant and the activated state. This seems to be the state in which the enzyme is found in vivo at the start of each catalytic cycle.
A consequence of such a mechanism is that, as the catalytic cycles occur, the two active sites are out of phase with each other, namely, when an active site requires a general acid, the other requires a general base, and vice versa.
Finally, it should be noted that this mechanism allows the switching of the loops that close the active sites so as to:
coordinate substrate uptake and product release;
explain the asymmetry existing between the two active sites.
Note: an apoenzyme is an enzyme that lacks the association of its cofactors. Conversely, an holoenzyme is an apoenzyme together with its cofactors. The apoenzyme is a catalytically inactive enzyme, whereas the holoenzyme is a catalytically active enzyme.
Structure of dihydrolipoyl transacetylase or E2
Three functionally distinct domains can be identify in the structure of dihydrolipoyl transacetylase: an N-terminal lipoyl domain, a peripheral subunit-binding domain, and a C-terminal catalytic domain or acyltransferase domain. These domains are connected by 20- to 40 amino acid residues rich in alanine and proline, hydrophobic amino acids that are interspersed with charged residues. These linkers are highly flexible and largely extended, that allows the three domains to kept away from each other.
E2 Domains
Note: flexible linkers are present in E3BP, too.
The N-terminal lipoyl domain is composed of ∼80 amino acid residues, and is so called because it binds lipoic acid. The number of these domains depend on the species, ranging from one to three. For example, there is one domain in B. stearothermophilus and in yeasts, two in Streptococcus faecalis and in mammals, and three in Azotobacter vinelandii and E. coli.
The link between the ɛ-amino group of a lysine residue and lipoic acid leads to the formation of a flexible arm, the lipoyl-lysine, which has a maximum extended length of ∼14 Å. Adding the polypeptide segment which connects the N-terminal domain to the adjacent domain, whose length is greater than 140 Å, the resulting flexible tether is able to swings the lipoyl group between the active sites of pyruvate dehydrogenase and dihydrolipoyl dehydrogenase, as well as to interact with neighboring dihydrolipoyl transacetylases of the core.
It should be noted that the number of these tethers is 3 x 24 = 72 in E. coli, whereas in mammals 2 x 60 = 120, based on the number of N-terminal domains and the units of dihydrolipoyl transacetylase.
One pyruvate dehydrogenase can therefore acetylate numerous dihydrolipoyl transacetylases, and one dihydrolipoyl dehydrogenase can reoxidize many dihydrolipoamide groups.
Moreover, it also occurs:
an interchange of the acetyl groups between the lipoyl groups of the dihydrolipoyl transacetylase core;
the exchange of both acetyl groups and disulfides between the tethered arms.
PSBD is composed of ∼35 amino acid residues arranged to form a globular structure that binds to both pyruvate dehydrogenase and dihydrolipoyl dehydrogenase, that is, it holds the multienzyme complex together.
The C-terminal catalytic domain, which, of course, contains the active site, is composed of ∼250 amino acid residues arranged to form a hollow cage-like structure containing channels large enough to allow substrates and products to diffuse in and out. For example, CoA ad lipoamide, the two substrate of dihydrolipoyl transacetylase, bind, in their extended conformation, at the opposite ends of a channel located at the interface between each pair of subunits in each trimers.
Structure of dihydrolipoyl dehydrogenase or E3
The structure of dihydrolipoyl dehydrogenase was deduced from studies of the enzyme in several microorganisms. It has a homodimeric structure, with each ∼470 amino acid residue chain folded into four domains, from the N-terminal to the C-terminal end: a FAD-binding domain, a NAD+-binding domain, a central domain, and an interface domain. All domains participate in the formation of the active site.
FAD is almost completely hidden inside the protein because, unlike thiol or NADH, it is easily oxidizable and must therefore be protected from the surrounding solution, namely, from O2. In fact, in the absence of the nicotinamide coenzyme, the phenol side chain of a tyrosine residue (Tyr), for example Tyr181 in the Gram-negative bacteria Pseudomonas putida, covers the NAD+-binding pocket so as to protect FADH2 from the contact with the surrounding solution.
Conversely, when NAD+ is located in the active site, the phenol side chain of the aforementioned tyrosine residue is interposed between the nicotinamide ring and the flavin ring.
In the active site of the enzyme’s oxidized form is also present a redox-active disulphide bridge. It forms between two cysteine residues located in a highly conserved segment of the polypeptide chain, e.g., Cys43 and Cys48 in P. putida, and is located on opposite side of the flavin ring with respect to the nicotinamide ring. The disulphide bridge links consecutive turns in a segment of a distorted α-helix, and, noteworthy, in the absence of such distortion, Cα atoms of the two cysteine residues would be too distant to allow the disulfide bridge to form.
Dihydrolipoyl dehydrogenase has therefore two electron acceptors: FAD and the redox-active disulphide bridge.
Note: the heterocyclic rings of NAD and FAD are parallel and in contact through van der Waals interactions; S48 is also in contact through van der Waals interactions with the flavin ring, on the opposite side of it from the NAD ring.
Reaction of pyruvate dehydrogenase or E1
In the reaction sequence catalyzed by components of the pyruvate dehydrogenase complex, pyruvate dehydrogenase catalyzes the first two steps, namely:
the decarboxylation of pyruvate to form CO2 and the hydroxyethyl-TPP intermediate;
the reductive acetylation of the lipoyl group of dihydrolipoyl transacetylase.
The first reaction is essentially identical to pyruvate decarboxylase reaction (EC 4.1.1.1), which carries out a non-oxidative decarboxylation in glucose fermentation to ethanol. What differs is the fate of the hydroxyethyl group bound to thiamine pyrophosphate that, in the reaction catalyzed by pyruvate dehydrogenase is transferred to the next enzyme in the sequence, dihydrolipoyl transacetylase, whereas in the reaction catalyzed by pyruvate decarboxylase is converted into acetaldehyde.
Catalytic mechanism of pyruvate dehydrogenase or E1
In thiamine pyrophosphate-dependent enzymes, the thiazolium ring is the active center, but only as dipolar carbanion or ylid, namely, as a dipolar ion, or zwitterion (German for “hybrid ion”), with positive charge on the N-3 and negative charge on C-2. Conversely, the positively charged thiazolium ring, that is, positive charged nitrogen and no charge on C-2, can be defined as “dormant” or inactive form.
The reaction begins with the nucleophilic attack by C-2 carbanion to the carbonyl carbon of pyruvate, which has the oxidation state of an aldehyde, and leads to the formation of a covalent bond between coenzyme and pyruvate.
Then, the cleavage of C-1–C-2 bond of pyruvate occurs. This leads to the release of the carboxyl group, namely, of the C-1 as CO2, while the remaining carbon atoms, C-2 and C-3, stay bound to the thiamine pyrophosphate as hydroxyethyl group. The cleavage of the C-1–C-2 bond, and therefore the decarboxylation of pyruvate, is favored by the fact that the negative charge on the C-2 carbon, that is unstable, is stabilized by the presence in the thiazolium ring of the positively charged N-3, a imine nitrogen (C=N+), that is, due to the presence of an electrophilic or electron deficient structure that acts as an electron sink or electron trap, in which the carbanion electrons can be delocalized by resonance.
At this point, the intermediate stabilized by resonance can be protonated to form hydroxyethyl-TPP.
Note: this first reaction catalyzed by pyruvate dehydrogenase is that in which the private dehydrogenase complex exercises its substratum specificity; furthermore, it is the slowest of the five reactions, hence limiting the rate of the overall reaction.
Catalytic mechanism of pyruvate dehydrogenase
Pyruvate dehydrogenase then catalyzes the oxidation of the hydroxyethyl group to an acetyl group, and its transfer on lipoyllysyl arm of dihydrolipoyl transacetylase. The reaction begins with the formation of a carbanion on the hydroxylic carbon of the hydroxyethyl-TPP, by the removal of the carbon-linked proton by an enzyme base.
The carbanions carry out a nucleophilic attack on the lipoamide disulfide, with the formation of a high-energy acetyl-thioester bond with one of the two -SH groups. In this reaction, the oxidation of the hydroxyethyl group to an acetyl group occurs with the concomitant reduction of the lipoamide disulfide bond: the two electrons removed from the hydroxyethyl group are used to reduce the disulfide. This reaction is therefore a reductive acetylation accompanied by the regeneration of the active form of pyruvate dehydrogenase, namely, the enzyme with the thiazolium C-2 in the deprotonated form, the ylid or dipolar carbanion form.
Note that the energy derived from the oxidation of the hydroxyethyl group to an acetyl group drives the formation of the thioester bond between the acetyl group and coenzyme A.
Note: as previously said, the lipoyllysyl arm, arranged in an extended conformation in the channel where TPP is also found, allows the transfer of hydroxyethyl from hydroxyethyl-TPP to CoA, that is, it can move from the active site of pyruvate dehydrogenase to the active sites of dihydrolipoyl transacetylase, and then of dihydrolipoyl dehydrogenase.
A deeper look on thiamine pyrophosphate
Thiamine pyrophosphate molecule consists of three chemical moieties, from which its chemistry and enzymology depend: a thiazolium ring, a 4-aminopyrimidine ring, and the diphosphate side chain.
The diphosphate side chain binds the cofactor to the enzyme via the formation of electrostatic bonds between the negative charges carried by its phosphoryl groups and the positive charges carried by Ca2+ and Mg2+ ions, in turn, bound to highly conserved sequences, GlyAspGly (GDG) and GlyAspGly-X26-AsnAsn (GDG-X26-NN), respectively.
The thiazolium ring plays a central role in catalysis, due to its ability to form the C-2 carbanion, that is, a nucleophilic center on the C-2 atom.
Note: as mentioned previously in this article, once bound to the enzyme, thiamine pyrophosphate locates in the active site so that the thiazolium ring is positioned close to the channel entrance leading to the active site.
The aminopyrimidine ring has a dual function:
it anchors the coenzyme holding it in place;
it has a specific catalytic role, participating in acid/base catalysis, as evidenced by studies with thiamine pyrophosphate analogs in which each of the three nitrogen atoms of the ring were replaced in turn. These studies demonstrated that the N-1’ atom and the N-4’-amino group are required, whereas the other nitrogen atom of the ring, the N-3’ atom, is required to a lesser extent.
How is the dipolar carbanion of thiamine pyrophosphate formed?
Three tautomeric forms of the aminopyrimidine ring can be identified in the enzyme-bound coenzyme not involved in the reaction:
the canonical 4’-aminopyrimidine tautomer;
the N-1 protonated form, that is, 4-aminopyrimidinium ion;
the 1’,4’-iminopyrimidine tautomer.
It seems that the 1′,4′-imino tautomer is the tautomer that undergoes deprotonation, before the entry of the substrate into the active site. The C-2 of the thiazolium ring is “much more acidic than most =C-H groups found in other molecules” (see also in the article on the pentose phosphate pathway). The higher acidity, i.e., the fact that the C-2 proton is easily dissociable, is due to the presence of the quaternary nitrogen on the thiazolium ring, a positively charged nitrogen atom able to electrostatically stabilize the resulting carbanion. In the deprotonation reaction, the amino group of the aminopyrimidine ring seems to play an essential role: it acts as a base and is suitably positioned to accept the proton. However, in the 4’-aminopyrimidine tautomer one of its protons sterically collides with the C-2 proton; in addition, its pK is too low to carry out the deprotonation efficiently. A mechanism was therefore proposed, in which the side chain of a conserved glutamate residue, for example βGlu59 in B. stearothermophilus, or Glu51 in Saccharomyces uvarum (brewer’s yeast) pyruvate decarboxylase, donates a proton to the aminopyrimidine, converting it to its 1′,4′-iminopyrimidine tautomer that, accepting the C-2 proton, returns to the canonical 4′-aminopyrimidinic form and allows the formation of the carbanion.
Note: carbanion formation on C-2 is a consequence of an intramolecular proton transfer.
Deprotonation of thiamine pyrophosphate and closure of pyruvate dehydrogenase active site
The loss of the C-2 proton of the thiazolium ring leads, from a positively charged ring, to a dipolar ion, or zwitterion. This change in state of charge triggers a conformational change in one of the two conserved loops at the entrance of the active site channel, specifically, the inner of these loops, that, in turn, leads to the closure of the channel to the surrounding water environment. In this closed conformation the thiazolium carbanion is protected against electrophiles.
To sum up: the deprotonation of thiamine pyrophosphate leads to the closure of the active site and the protection of the newly formed dipolar carbanion, that is, TPP-dependent enzymes would be only active in closed conformation.
Conversely, in the other active site, thiamine pyrophosphate is not in the ylid form, the channel is open, and the site is inactive.
Reaction of dihydrolipoyl transacetylase or E2
In the reaction sequence catalyzed by components of the pyruvate dehydrogenase complex, dihydrolipoyl transacetylase catalyzes the third step, namely, the transfer of the acetyl group from acetyl-dihydrolipoamide to CoA to form acetyl-CoA and dihydrolipoamide, the fully reduced form of lipoamide, the dithiol.
It should be noted that the acetyl group, initially bound by ester linkage to one of the –SH group of lipoamide is next bound to the –SH group of coenzyme A, again by ester bond, hence the term transesterification.
Catalytic mechanism of dihydrolipoyl transacetylase or E2
During the reaction, the sulfhydryl group of coenzyme A carries out a nucleophilic attack on the carbonyl carbon of the acetyl group of acetyl dihydrolipoamide-dihydrolipoyl transacetylase to form a transient tetrahedral intermediate, that “decomposes” to dihydrolipoamide-dihydrolipoyl transacetylase and acetyl-CoA.
E2: Catalytic Mechanism
As previously said, the mobility of the lipoyllysyl arm plays a central role in the reaction mechanism.
Reaction of dihydrolipoyl dehydrogenase or E3
In the reaction sequence catalyzed by components of the pyruvate dehydrogenase complex, dihydrolipoyl dehydrogenase catalyzes the fourth and fifth steps.
The enzyme catalyzes electron transfers needed to regenerate the disulfide bridge of the lipoyl group of dihydrolipoyl transacetylase, that is, to regenerate the oxidized form of the prosthetic group, and thus completing the catalytic cycle of the transacetylase.
The reaction has a ping-pong catalytic mechanism: it occurs in two successive half-reaction, in which each of the two substrates, NAD+ and dihydrolipoamide, reacts in the absence of the other. Moreover during the first half-reaction, the release of the first product and the formation of an enzyme intermediate complex occur before the second substrate binds, while the enzyme underogoes a structural change, whereas in the second half-reaction the release of the second product and the return of the enzyme to its starting state, again, via a structural change, occur.
Considering the ping-pong kinetic mechanism of dihydrolipoyl dehydrogenase:
in the first half-reaction the oxidation of dihydrolipoamide to lipoamide occurs;
in the second half-reaction the reduction of NAD+ to NADH occurs.
Catalytic mechanism of dihydrolipoyl dehydrogenase or E3
Below, the reaction mechanism of P. putida dihydrolipoyl dehydrogenase is described.
In the first half-reaction, the oxidized dihydrolipoyl dehydrogenase (E), i.e., the enzyme with the disulfide bridge between Cys43 and Cys48, binds dihydrolipoamide (LH2) to form the enzyme-dihydrolipoamide complex (E●LH2). At this point, a sulfur atom of dihydrolipoamide carries out a nucleophilic attack on the sulfur of Cys43, to form the disulfide bridge lipoamide-Cys43 (E-S-S-L), while the sulfur of Cys48 is released as a thiolate ion (S–48).
The proton on the second thiol group of lipoamide is then abstracted by histidine (Hys) 451, that acts as a general acid-base catalyst, leading to the formation of a second thiolate ion, this time on the lipoamide (E-S-S-L ●S–), that, through a nucleophilic attack, displaces the sulfur of Cys43, S43, aided in this by general acid catalysis by Hys451 which donates a proton to S43. The catalytic action of Hys451 is essential, as demonstrated by mutagenesis studies in which its substitution with a glutamine residue causes the enzyme to retain ∼ 0.4% of the wild-type catalytic activity.
Then, thiolate anion S–48 contacts, through non-covalent interactions, the flavin ring near 4a position, i.e., an electron pair of S–48, which acts as electron donor, is partially transferred to the oxidized flavin ring, which, in turn, is the electron acceptor. The resulting structure is called charge-transfer complex.
Meanwhile, the phenolic side chain of the Tyr181 continues to hinder access to the flavin ring, thus protecting it from oxidation by O2.
Dihydrolipoamide Oxidation via E3
To sum up, what occurs is an interchange reaction of disulfide bridges leading to the formation of the oxidized form of lipoamide, the first product, which is released, and the reduced form of the dihydrolipoyl dehydrogenase.
The second half-reaction involves the reduction of NAD+ to NADH + H+ by electron transfer from the reactive disulfide of the enzyme via FAD.
Oxidation of Reduced E3
It begins with the entry of NAD+ into the active site and its binding to form the EH2●NAD+ complex. It should be noted that the entry of the coenzyme causes the phenolic side chain of the Tyr181 to be pushed aside by the nicotinamide ring.
Following the collapse of the charge-transfer complex, a covalent bond is formed between the flavin atom C-4a and S48, to which the extraction of a proton from S43 by the flavin atom N-5 is accompanied, with the formation of the corresponding thiolate anion, S–43.
S–43carries out a nucleophilic attack on S48, leading to the formation of the redox-active disulphide bridge between Cys43 and Cys48, followed by the breakdown of the covalent bond between S48 and the flavin atom C-4a to form reduced FADH anion, FADH–, with negative charge on atom N-1. It should be noted that dihydrolipoyl dehydrogenase is in the oxidized form (E).
FADH– has a transient existence because the proton bound to its N-5 is instantly transferred, as hydride ion, to the nicotinamide atom C-4, that is juxtaposed to flavin atom N-5. This leads to the formation of FAD and of the second product of the reaction, NADH, which is released.
To sum up, what occurs is that the electrons removed from the hydroxyethyl group, which derives from pyruvate, pass, via FAD, to NAD+. The catalytic cycle of dihydrolipoyl dehydrogenase is therefore completed, being the enzyme and its coenzymes in their oxidized form. At this point, the catalytic cycle of the entire pyruvate dehydrogenase complex is completed, too, and the complex is ready for a new reaction cycle.
Note: unlike the thiazolium ring of thiamine pyrophosphate, FAD does not acts as electron trap or electron sink, but rather as an electron conduit between the redox-active disulphide, in its reduced form, and NAD+.
Note: the catalytic mechanism of dihydrolipoyl dehydrogenase has been determined in analogy with that of glutathione reductase (EC 1.8.1.7), at 33% identical and whose structure is more extensively characterized. It should, however, be noted that although the two enzymes catalyze similar reactions, these usually occur in opposite direction:
dihydrolipoyl dehydrogenase uses NAD+ to oxidize two –SH groups to a disulfide (–S–S–);
glutathione reductase uses NADPH to reduce a –S–S– to two thiol groups.
Nevertheless, their active sites are closely superimposable.
Regulation of the pyruvate dehydrogenase complex
In mammals, the regulation of the activity of the pyruvate dehydrogenase complex is essential, both in the fed and fasted states. In fact, the multienzyme complex plays a central role in metabolism because, catalyzing the irreversible oxidative decarboxylation of pyruvate, represents the entry point of the carbon flux from all carbohydrate sources as well as from ∼50% of carbon skeletons of glucogenic amino acids, that, as a whole, correspond to ∼60% of the daily calorie intake, into:
the citric acid cycle, and therefore to the full oxidation to CO2;
the synthesis of lipids (fed state) and acetylcholine.
The importance of the regulation of the conversion of pyruvate into acetyl-CoA is also underlined by the fact that mammals, although able to produce glucose from pyruvate, cannot synthesize it from acetyl-CoA, because of the irreversibility of pyruvate dehydrogenase reaction and the absence of alternative pathways. Then, the inhibition of the activity of the complex allows to spare glucose and the amino acids that can be converted into pyruvate, such as alanine, when other fuels, for example acetyl-CoA from fatty acid oxidation, are available.
This explains why the activity of the complex is carefully regulated by:
feedback inhibition;
nucleotides;
covalent modifications, namely, phosphorylation and dephosphorylation of specific target proteins.
Regulation by feedback inhibition and energy status of the cell
The activity of the dephosphorylated form of the pyruvate dehydrogenase complex is regulated by feedback inhibition.
Acetyl-CoA and NADH allosterically inhibit the enzymes that catalyze their formation, dihydrolipoyl transacetylase and dihydrolipoyl dehydrogenase, respectively.
In addition, CoA and acetyl-CoA, as well as NAD+ and NADH, compete for binding sites on E2 and E3, respectively, that catalyze reversible reactions. This means that, in the presence of high ratios of [Acetyl-CoA]/[CoA] and [NADH]/ [NAD+], the reactions of transacetylation and dehydrogenation work in reverse; therefore, dihydrolipoyl transacetylase cannot accept the hydroxyethyl group from TPP because it is maintained in the acetylated form. This cause thiamine pyrophosphate to remain bound to pyruvate dehydrogenase in its hydroxyethyl form, which, in turn, decreases the rate of pyruvate decarboxylation. Hence, high ratios of [Acetyl-CoA]/[CoA] and [NADH]/[NAD+] indirectly influence pyruvate dehydrogenase activity.
PDC Activiy: Regulation by Feedback Inhibition
Acetyl-CoA and NADH are also produced by fatty acid oxidation, which takes place, like the reactions of the pyruvate dehydrogenase complex, within the mitochondrion. This means that the cell, by regulating the activity of the multienzyme complex, preserves carbohydrate stores when fatty acids are available for energy. For example, during the fasted state, liver, skeletal muscle and many other organs and tissues rely primarily on fatty acid oxidation for energy. Conversely, the activity of the multienzyme complex is increased in the fed state, when many different types of cells and tissues mainly use glucose as a fuel.
More generally, when the production of NADH and/or acetil-CoA exceeds the capacity of the cell to use them for ATP production, the activity of the pyruvate dehydrogenase complex is inhibited. The same is true when there is no need for additional ATP to be produced. Infact, the activity of multienzyme complex is also sensitive to the energy charge of the cell. Through allosteric mechanisms, high ATP levels inhibit the activity of the pyruvate dehydrogenase component of the complex, whereas high ADP levels, that signs that the energy charge of the cell may become low, activate it, thus committing the carbon skeleton of carbohydrates and some amino acids to energy production.
Note: in the skeletal muscle, the activity of the pyruvate dehydrogenase complex increases with increased aerobic activity, resulting in a in greater dependence on glucose as a fuel source.
Regulation by phosphorylation/dephosphorylation
Unlike prokaryotes, in mammals the activity of the pyruvate dehydrogenase complex is also regulated by covalent modifications, i.e., phosphorylation and dephosphorylation of three specific serine residues of the α subunit of pyruvate dehydrogenase, the enzyme that catalyzes the first, irreversible step of the overall reaction sequence.
Note: as mammalian pyruvate dehydrogenase is an heterotetramer, there are six potential phosphorylation sites.
PDC Activity: Regulation by Covalent Modifications
Phosphorylation, which inactivates pyruvate dehydrogenase, and then blocks the overall reaction sequence, is catalyzed by pyruvate dehydrogenase kinase. Two of the aforementioned serine residues are located on the more C-terminal loop, at the entrance of the substrate channel leading to the respective active site, and the phosphorylation of only one of them inactivates the pyruvate dehydrogenase, hence demonstrating the out of phase coupling between its active sites.
Conversely, in the dephosphorylated state the complex is active. Dephosphorylation is catalyzed by a specific protein phosphatase, the pyruvate dehydrogenase phosphatase.
The activities of pyruvate dehydrogenase kinase and pyruvate dehydrogenase phosphatase are in turn subject to allosteric regulation by several modulators.
Regulation of pyruvate dehydrogenase kinase
The activity of pyruvate dehydrogenase kinase depends on the ratios of [NADH]/[NAD+], [acetyl-CoA]/[CoA], and [ATP]/[ADP] , as well as on the pyruvate concentration, in the mitochondrial matrix.
High ratios of [NADH]/[NAD+] and [acetyl-CoA]/[CoA], as during the oxidation of fatty acids and ketone bodies, activate the kinase, pyruvate dehydrogenase is phosphorylated, and the pyruvate dehydrogenase complex is inhibited. This allows tissues, such as cardiac muscle, to preserve glucose when fatty acids and/or ketone bodies are utilized for energy, because acetyl-CoA synthesis from pyruvate, and hence from carbohydrates (and some amino acids) is turned off.
Conversely, when the concentrations of NAD+ and coenzyme A are high the activity of the kinase is inhibited and the multienzyme complex is active.
Therefore, acetyl-CoA and NADH, two of the three end products of the reactions catalyzed by the pyruvate dehydrogenase complex, allosterically control their synthesis by regulating directly and indirectly, by regulating the activity of pyruvate dehydrogenase kinase, the activity of the complex.
A high ratio of [ATP]/[ADP] activates the kinase, and then inhibits the pyruvate dehydrogenase complex.
Note: unlike many other kinases, such as those involved in the control of glycogen metabolism, pyruvate dehydrogenase kinase is not regulated by cAMP levels, but by molecules that signal changes in energy status of the cell and in the availability of biosynthetic intermediates: ATP and NADH, and acetyl-CoA, respectively.
Pyruvate allosterically inhibits pyruvate dehydrogenase kinase.
When its levels are high, it binds to kinase and inactivates it, pyruvate dehydrogenase is not phosphorylated, and the pyruvate dehydrogenase complex remains active.
Pyruvate dehydrogenase kinase is also activated by interaction with dihydrolipoyl transacetylase in its acetylated form, i.e. when acetyl-dihydrolipoamide is present.
Other activators of the kinase is potassium and magnesium ions.
Regulation of pyruvate dehydrogenase phosphatase
The activity of pyruvate dehydrogenase phosphatase depends on the ratios of [NADH]/[NAD+] and [acetyl-CoA]/[CoA], as well as on [Ca2+], in the mitochondrial matrix.
Low ratios of [NADH]/[NAD+] and [acetyl-CoA]/[CoA] activate the phosphatase, pyruvate dehydrogenase is dephosphorylated, and the pyruvate dehydrogenase complex is activated.
Conversely, when the aforesaid ratios are high, phosphatase activity is reduced, kinase activity is increased, and the multienzyme complex is inhibited.
Calcium ion activates pyruvate dehydrogenase phosphatase.
Ca2+ is an important second messenger that signals the cell requires more energy. Therefore, when its levels are high, as in cardiac muscle cells after epinephrine stimulation or in skeletal muscle cells during the muscular contraction, the phosphatase is active, the complex is dephosphorylated, and then active.
Insulin, too, is involved in the control of the activity of the pyruvate dehydrogenase complex through the activation of pyruvate dehydrogenase phosphatase. The hormone, in response to increases in blood glucose, stimulates glycogen synthesis and the synthesis of acetyl-CoA, a precursor in the synthesis of lipids.
Fasting and subsequent refeeding, too, affect the activity of the multienzyme complex.
In tissues such as skeletal muscle, cardiac muscle or kidney, fasting significantly decreases the activity of the complex, whereas refeeding reverses the inhibition of fasting.
In the brain, however, these variations are not observed because the activity of pyruvate dehydrogenase complex is essential for ATP production.
References
Frank R.A.W., Titman C.M., Pratap J.V., Luisi B.F., and Perham R.N. A molecular switch and proton wire synchronize the active sites in thiamine enzymes. Science 2004;306(5697):872-876. doi:10.1126/science.1101030
Gray L.R., Tompkins S.C., Taylor E.R. Regulation of pyruvate metabolism and human disease. Cell Mol Life Sci 2014;71(14):2577-2604. doi:10.1007/s00018-013-1539-2
McCommis K.S. and Finck B.N. Mitochondrial pyruvate transport: a historical perspective and future research directions. Biochem J 2015;466(3):443-454. doi:10.1042/BJ20141171
Nelson D.L., Cox M.M. Lehninger. Principles of biochemistry. 6th Edition. W.H. Freeman and Company, 2012
Nemeria N.S., Chakraborty S., Balakrishnan A., and Frank Jordan. Reaction mechanisms of thiamin diphosphate enzymes: defining states of ionization and tautomerization of the cofactor at individual steps. FEBS J 2009;276:2432-2446. doi:10.1111/j.1742-4658.2009.06964.x
Patel M.S. and Korotchkina L.G. Regulation of the pyruvate dehydrogenase complex. Biochem Soc T 2006;34(2):217-222. doi:10.1042/bst0340217
Patel M.S., Nemeria N.S., Furey W., and Jordan F. The pyruvate dehydrogenase complexes: structure-based function and regulation. J Biol Chem 2014;289(24):16615-16623. doi:10.1074/jbc.R114.563148
Rosenthal M.D., Glew R.H. Medical Biochemistry – Human Metabolism in Health and Disease. John Wiley J. & Sons, Inc., 2009
Stipanuk M.H., Caudill M.A. Biochemical, physiological, and molecular aspects of human nutrition. 3rd Edition. Elsevier health sciences, 2012
Voet D. and Voet J.D. Biochemistry. 4th Edition. John Wiley J. & Sons, Inc. 2011
Wang J., Nemeria N.S., Chandrasekhar K., Kumaran S., Arjunan P., Reynolds S., Calero G., Brukh R., Kakalis L., Furey W., and Jordan F. Structure and function of the catalytic domain of the dihydrolipoyl acetyltransferase component in Escherichia coli pyruvate dehydrogenase complex. J Biol Chem 2014;289(22):15215-15230. doi:10.1074/jbc.M113.544080
Zhou Z.H., McCarthy D.B., O’Connor C.M., Reed L.J., and J.K. Stoops. The remarkable structural and functional organization of the eukaryotic pyruvate dehydrogenase complexes. Proc Natl Acad Sci USA 2001;98(26):14802-14807. doi:10.1073/pnas.011597698
The pentose phosphate pathway, also called the phosphogluconate pathway, is a metabolic pathway, common to all living organisms, for the oxidation of glucose alternative to glycolysis, from which it branches downstream of glucose 6-phosphate synthesis, and whose main function is the production, in variable ratios, of NADPH, a reduced coenzyme, and ribose 5-phosphate, a five-carbon phosphorylated sugar, namely, a pentose phosphate, hence the name pentose phosphate pathway.[14]
The phosphogluconate pathway, branching from glycolysis, is also called the hexose monophosphate shunt.
Conceptually, this pathway can be viewed as consisting of two phases: the oxidative phase, in which NADPH is produced, and the non-oxidative phase, which produces ribose 5-phosphate and other phosphorylated carbohydrates.[16]
Summary of the Reactions of Pentose Phosphate Pathway
It has been estimated that more than 10 percent of glucose is shuttled through this metabolic pathway that, noteworthy, although it oxidizes the monosaccharide, does not involve any direct production or consumption of ATP.[7][13]
The first evidence of the existence of the pentose phosphate pathway was obtained in the 1930s by the studies of Otto Warburg, Nobel Prize in Physiology or Medicine in 1931, who discovered NADP during studies on the oxidation of glucose 6-phosphate to 6-phosphogluconate.[22]
Further indications came from the observation that glucose continued to be metabolized in tissues even in the presence of glycolysis inhibitors, such as fluoride and iodoacetate ions, inhibitors of enolase (EC 4.2.1.11) and glyceraldehyde 3-phosphate dehydrogenase (EC 1.2.1.12), respectively.
However, the pathway was fully elucidated only in 1950s thanks to the work of several researchers and primarily of Efraim Racker, Fritz Lipmann, Nobel Prize in Physiology or Medicine in 1953 thanks to the discovery of coenzyme A, Bernard Horecker and Frank Dickens.[8]
Main function
The main function of the pentose phosphate pathway is the production of NADPH and ribose 5-phosphate.[22]
NADPH is needed for reductive biosynthesis, such as the synthesis of fatty acids, cholesterol, steroid hormones and of two non-essential amino acids, proline and tyrosine, from glutamate and phenylalanine, respectively, as well as for the reduction of oxidized glutathione.[14] In such reactions the reduced coenzyme acts as an electron donor, or rather as a donor of a hydride ion (:H–), namely, a proton and two electrons.
Reduced and Oxidized Form of Nicotinamide Adenine Dinucleotide Phosphate
Note: In vertebrates, about half of the NADPH necessary for the reductive steps of fatty acid synthesis derives from the pentose phosphate pathway, and the rest from the malic enzyme (EC 1.1.1.40) reaction.[13]
Malate + NADP+ ↔ Pyruvate + NADPH + H+ + HCO3–
Ribose 5-phosphate is used for the synthesis of nucleotides and nucleic acids, DNA and RNA, of ATP, coenzymes such as coenzyme A, NAD, NADP and FAD, and of the essential amino acids tryptophan and histidine.[5] This five-carbon phosphorylated is not used as such; it is activated to 5-phosphoribosyl 1-pyrophosphate (PRPP), in the reaction catalyzed by ribose phosphate pyrophosphokinase or PRPP synthase (EC 2.7.6.1).[13]
Ribose 5-phosphate + ATP → 5-Phosphoribosyl 1-pyrophosphate + AMP
Additional functions
In addition to the production of NADPH and ribose 5-phosphate, the pentose phosphate pathway has other functions, both anabolic and catabolic.[18]
In yeasts and many bacteria it is involved in the catabolism of the five carbon sugars ribose, xylose and arabinose.
In humans too, it is involved in catabolism of the aforementioned pentoses and of the less common sugars with three, four and seven carbon atoms derived from diet, as well as of:
pentoses derived from the catabolism of structural carbohydrates;
ribose 5-phosphate derived from nucleotide catabolism.
In photosynthetic organisms it contributes to carbon dioxide (CO2) fixation during the Calvin cycle.[18]
In addition to ribose 5-phosphate, it also provides other intermediates for various biosynthetic processes, such as:
erythrose 4-phosphate, used for the synthesis of phenylalanine, tryptophan, and tyrosine, the three aromatic amino acids;
ribulose 5-phosphate, used for riboflavin synthesis;
sedoheptulose 7-phosphate which, in Gram-negative bacteria, is used for the synthesis of heptose units in the lipopolysaccharide layer of the outer membrane.[19]
Where does the pentose phosphate pathway occur?
In animal cells and bacteria, the hexose monophosphate shunt, as well as glycolysis, fatty acid synthesis, and most of the reactions of gluconeogenesis, occurs in the cytosol.[5] And, considering glycolysis, gluconeogenesis and the pentose phosphate pathway we can state that these three metabolic pathways are interconnected through several shared enzymes and/or intermediates.
In plant cells the pentose phosphate pathway occurs in plastids, and its intermediates can reach the cytosol through membrane pores of these organelles.[13]
In humans, the level of expression of the enzymes of the pathway varies widely from tissue to tissue. Relatively high levels are found in the liver, adrenal cortex, testicles and ovaries, thyroid, mammary glands during lactation, and in red blood cells.[14] In all these sites, constant supply of NADPH is required to support reductive biosynthesis and/or to counteract the effects of reactive oxygen species (ROS) on sensitive cellular structures, such as DNA, membrane lipids, and proteins by the reduction of oxidized glutathione (GSSG) to reduced glutathione (GSH), which is the major intracellular antioxidant in erythrocytes, as in most other cells, in the reaction catalyzed by glutathione reductase (EC 1.8.1.7).[1]
GSSG + NADPH + H+ → 2 GSH + NADP+
High levels of the of the phosphogluconate pathway enzymes are also present in rapidly dividing cells such as enterocytes, skin cells, bone marrow cells, those of the early embryo and, in pathological conditions, cancer cells. Indeed, these cell types require a constant supply of ribose 5-phosphate for nucleic acid synthesis.[16]
Conversely, these enzymes are present in very low levels in skeletal muscle, in which the pentose phosphate pathway is virtually absent and glucose 6-phosphate is primarily used for energy production via glycolysis and the citric acid cycle.[5]
Oxidative phase
The oxidative phase of the pentose phosphate pathway consists of two irreversible oxidations, the first and third reactions, and a hydrolysis.
In this phase, glucose 6-phosphate is converted to ribulose 5-phosphate, a five-carbon phosphorylated sugar and the starting substrate for the reactions of the non-oxidative phase, with the concomitant formation of two molecules of NADPH and the release of C-1 of glucose as CO2.[7] The overall equation is:
Oxidation of glucose 6-phosphate to 6-phosphoglucono-delta-lactone
In the first step of the oxidative phase, glucose 6-phosphate dehydrogenase catalyzes the oxidation of glucose 6-phosphate to 6-phosphoglucono-δ-lactone, an intramolecular ester, via the transfer of a hydride ion from carbon 1 of glucose 6-phosphate to NADP+, that acts as oxidizing agent.
Note: This reaction yields the first molecule of NADPH of the pentose phosphate pathway.
The reaction catalyzed by glucose 6-phosphate dehydrogenase or G6PD (EC 1.1.1.49) is unique to the pathway.[1] And, similarly to what happens in most metabolic pathways, also in this case the first reaction unique to the pathway, generally known as a committed step, is an essentially irreversible step, with a ΔG in the liver of -17.6 kJ/mol (-4.21 kcal/mol), and is highly allosterically regulated.[22] And the enzyme is indeed the major control point for the flow of metabolites through the pathway.
In humans, the highest levels of G6PD are found in neutrophils and macrophages, phagocytic cells in which, during inflammation, NADPH is used for to produce superoxide radicals (O2-.) from molecular oxygen in the reaction catalyzed by NADPH oxidase (EC 1.6.3.1).[2][16]
2 O2 + NADPH → 2 O2-. + NADP+ + H+
In turn, superoxide radicals can be used for the synthesis for defensive purposes, namely, to kill phagocytized microorganisms, of other ROS but also of reactive nitrogen species (RNS), such as:
hydrogen peroxide (H2O2), in the reaction catalyzed by superoxide dismutase or SOD (EC 1.15.1.1)
2 O2-. + 2 H+ → H2O2 + O2
peroxynitrite (O=N–O–O), in the reaction with nitric oxide (•NO)
O2–. + •NO → O=N–O–O–
hydroperoxide radical (HOO•)
O2-. + H+ → HOO•
Catalytic mechanism of glucose 6-phosphate dehydrogenase
The catalytic mechanism of the enzyme has been studied in great detail in the microorganism Leuconostoc mesenteroides, whose glucose 6-phosphate dehydrogenase has the peculiar characteristic of being able to use NAD+ and/or NADP+ as coenzyme.[12]
Catalytic Mechanism of Glucose 6-Phosphate Dehydrogenas
The enzyme does not require metal ions for its activity; one of the amino acids in the active site acts as a general base being able to abstract a hydride ion from the hydroxyl group bound to C1 of glucose 6-phosphate.[4]
In the bacterial enzyme this is carried out by the atom Nɛ2 of the imidazole ring of a histidine side chain. This nitrogen atom has a lone pair of electrons able to make a nucleophilic attack. This causes glucose 6-phosphate, a cyclic hemiacetal with carbon 1 in the aldehyde oxidation state, to be oxidized to a cyclic ester, namely, a lactone, and the transfer of an hydride ion from C1 of glucose to C4 of the nicotinamide ring of NADP+ to form NADPH.
Because such histidine is conserved in many of the glucose 6-phosphate dehydrogenases sequenced, it is likely that this catalytic mechanism can be generalized to all glucose 6-phosphate dehydrogenases.
Regulation of glucose 6-phosphate dehydrogenase
Glucose 6-phosphate dehydrogenase is the major control point of carbon flow through the pentose phosphate pathway, and then the major control point for the rate of NADPH synthesis.[2]
In humans, the enzyme exists in two forms: the inactive monomeric form, and the active form that exists in a dimer-tetramer equilibrium.[1]
One of the main modulators of its activity is the cytosolic NADP+/NADPH ratio.[15] High levels of NADPH inhibit enzyme activity, because NADPH is a potent competitive inhibitor of G6PD, whereas NADP+ is required for the catalytic activity and for the maintenance of the active conformation. In fact, the binding of the oxidized coenzyme to a specific site close to the dimer interface, but distant from the active site, is required to maintain its dimeric conformation.
Regulation of G6PD Activity
Under most metabolic conditions the NADP+/NADPH ratio is low, less NADP+ is available to bind to the enzyme, and hence enzyme activity is reduced, regardless of gene expression levels. Under these conditions the oxidative phase is virtually inactive.
Conversely, in cells in which metabolic pathways and/or reactions using NADPH are particularly active, the reduction of cytosolic NADPH concentration, and hence the increase in NADP+ concentration occurs. This leads to an increase in glucose 6-phosphate dehydrogenase activity, and to the activation of the oxidative phase of the hexose monophosphate pathway.
Therefore it is possible to state that the fate of glucose 6-phosphate also depends on the current needs for NADPH.[15]
A second mechanism for the regulation of G6PD activity calls into question the accumulation of acyl-CoAs, intermediates in fatty acid synthesis.[5] These molecules, by binding to the dimeric form of the enzyme, lead to dissociation into the constitutive monomers, and then to the loss of the catalytic activity.
Insulin up-regulates the expression of the genes for glucose 6-phosphate dehydrogenase and 6-phosphogluconate dehydrogenase. Therefore, in the well-fed state, the hormone increases carbon flow through the pentose phosphate pathway and then the production of NADPH.[7]
Note: Insulin also promotes the synthesis of fatty acids.
Hydrolysis of 6-phosphoglucono-delta-lactone to 6-phosphogluconate
In the second step of the oxidative phase 6-phosphoglucono-δ-lactone is hydrolyzed to 6-phosphogluconate, a linear molecule.
6-Phosphoglucono-δ-lactone is hydrolytically unstable and undergoes a nonenzymatic ring-opening, a reaction that occurs at a significant rate.[22] However, in the cell this ring-opening reaction, an hydrolysis, is accelerated by the catalytic action of 6-phosphogluconolactonase (EC 3.1.1.31).[3]
Oxidative decarboxylation of 6-phosphogluconate to ribulose 5-phosphate
In the last step of the oxidative phase, 6-phosphogluconate undergoes an oxidative decarboxylation to form ribulose 5-phosphate, a keto pentose, CO2, and a molecule of NADPH. The reaction is catalyzed by 6-phosphogluconate dehydrogenase (EC 1.1.1.44), enzyme that requires the presence of magnesium ions, Mg2+.
6-Phosphogluconate + NADP+ → Ribulose 5-phosphate + NADPH + CO2
Note: This reaction yields the second molecule of NADPH of the pentose phosphate pathway.[15]
Catalytic mechanism of 6-phosphogluconate dehydrogenase
The catalytic mechanism of the enzyme is similar to that of isocitrate dehydrogenase (EC 1.1.1.41), an enzyme of the citric acid cycle.[22] It consists of an acid-base catalysis proceeding through a three step mechanism in which two strictly conserved residues, a lysine (Lys), and a glutamate (Glu), are involved; in humans, Lys185 and the Glu192. Lysine acts as acid/base group, whereas glutamate as an acid.[6][17]
Catalytic Mechanism of 6-Phosphogluconate Dehydrogenase
In the first step, the oxidative step, 6-phosphogluconate is oxidized to a beta-keto acid, the 3-keto-6-phosphogluconate.
In this step the ε-amino group of the aforementioned lysine acts as a general base, as a nucleophile, abstracting a proton from the hydroxyl group bound to C-3. Then, the transfer of a hydride ion from C-3 to C-4 of the nicotinamide ring of the NADP+ occurs. This leads to the formation of the 3-keto intermediate and a molecule of NADPH that leaves the active site.
In the second step, the decarboxylation step, 3-keto-6-phosphogluconate, that is very susceptible to decarboxylation, is converted to the cis-1,2-enediol of ribulose 5-phosphate, a high energy intermediate.In this step the aforementioned lysine acts as a general acid donating an H+ at the C-3 carbonyl oxygen, and the C-1 of glucose 6-phosphate is lost as CO2.
Finally, 6-phosphogluconate dehydrogenase catalyzes a stereospecific keto-enol conversion leading to the formation of ribulose 5-phosphate. In this step, the aforementioned glutamic acid residue acts as a general acid donating an H+ to the C-1 of cis-1,2-enediol intermediate, while the ε-amino group of the lysine accepts a proton from the hydroxyl group bound to the C-2. The result is the formation of ribulose 5-phosphate.
Non-oxidative phase
In the non-oxidative phase of the pentose phosphate pathway, several phosphorylated carbohydrates are produced, whose fate depends on the relative needs for NADPH, ribose 5-phosphate, and ATP of the cell.[7] This phase consists of five steps, all freely reversible, in which a series of interconversions of phosphorylated sugars occurs. It begins with two reactions: the isomerization and epimerization of ribulose 5-phosphate to form ribose 5-phosphate and xylulose 5-phosphate, respectively.[14] Note: enzymatic isomerizations and epimerizations play an important role in carbohydrate metabolism.
Epimerases (EC 5.1), a subclass of Isomerases (EC 5.), catalyze the configurational reversal at an asymmetric carbon atom, usually by a deprotonation/protonation mechanism.
In isomerization reactions, the interchange of chemical groups occurs between carbon atoms.
Isomerization of ribulose 5-phosphate to ribose 5-phosphate
In the first step of the nonoxidative phase of the pentose phosphate pathway, an isomerization reaction, ribulose 5-phosphate, a ketose, is converted to the corresponding aldose, ribose 5-phosphate. The reaction is catalyzed by phosphopentose isomerase or ribose 5-phosphate isomerase (EC 5.3.1.6).
Ribulose 5-phosphate ⇄ Ribose 5-phosphate
These molecules are an example of functional group isomerism.
Catalytic mechanism of phosphopentose isomerase
The catalytic mechanism of phosphopentose isomerase is similar to that of phosphohexose isomerase (EC 5.3.1.9), a glycolytic enzyme, and leads to the formation of the high energy intermediate cis-1,2-enediol of ribulose 5-phosphate via a proton-transfer mechanism common to the aldose-ketose isomerizations.
The proposed catalytic mechanism for phosphopentose isomerase from E. coli, in the direction of ribulose 5-phosphate formation from ribose 5-phosphate, as in the Calvin cycle of photosynthesis, is described below.[23]
Catalytic Mechanism of Phosphopentose Isomerase
In the first step, the furanose ring of the substrate is opened, opening induced by the interaction with an aspartic acid residue (Asp81) that accepts a proton from the hydroxyl group bound to C-1, whereas it is likely that water is the proton donor.
Note: The opening of the furanose ring is quite rare in solution (<0.5 percent).
Once the chain is opened, a glutamic acid residue (Glu103) acts as a general base, as a nucleophile, abstracting a proton bound to the C-2, whereas Asp81 donates a proton. As a result, cis-1,2-enediol intermediate is produced.
Finally, the protonated Glu103 acts as a general acid and donates an H+ at C-1 of the cis-1,2-enediol intermediate, while Asp81 acts as a general base accepting a proton from the hydroxyl group bound to C-2. The result is the formation of ribulose 5-phosphate.
During the synthesis of ribose 5-phosphate from ribulose 5-phosphate phosphopentose isomerase works in reverse.
Epimerization of ribulose 5-phosphate to xylulose 5-phosphate
The other metabolic fate of ribulose 5-phosphate in the pentose phosphate pathway is to be epimerized to xylulose 5-phosphate, a ketose like ribulose 5-phosphate, in the reaction catalyzed by phosphopentose epimerase (EC 5.1.3.1).
Ribulose 5-Phosphate ⇄ Xylulose 5-Phosphate
Note: Xylulose 5-phosphate is a regulatory molecule that inhibits gluconeogenesis and stimulates glycolysis by controlling the levels of fructose 2,6-bisphosphate in the liver.[10]
Catalytic mechanism of phosphopentose epimerase
Also this reaction, like those catalyzed by 6-phosphogluconate dehydrogenase and ribose 5-phosphate isomerase, proceeds through the formation of an enediol intermediate, but with the double bond between C-2 and C-3 and not between C-1 and C-2.
During the reaction an amino acid residue present in the active site of the enzyme acts as a general base, as a nucleophile, and abstracts a proton bound to the C-3, leading to the formation of the cis-2,3-enediol intermediate. Then, an acidic amino acid residue donates a proton to C-3, but from the opposite side, hence, with an inversion at C-3 to form xylulose 5-phosphate.[5][9]
Catalytic Mechanism of Phosphopentose Epimerase
To this point, the hexose monophosphate shunt has generated for each molecule of glucose 6-phosphate metabolized:
a pool of three pentose 5-phosphates, namely, ribulose 5-phosphate, ribose 5-phosphate and xylulose 5-phosphate, that coexist at equilibrium;
2 molecules of NADPH.
In the following three steps, from the sixth to the eighth, transketolase (EC 2.2.1.1) and transaldolase (EC 2.2.1.2), two enzymes unique to the pentose phosphate pathway, catalyze a series of rearrangements of the carbon skeletons leading to the formation of three-, four-, six-, and seven carbon units, that can be used for various metabolic purposes, depending on the needs of the cell.[2]
Analyzing the flow of metabolites through the different metabolic pathways, the concerted action of transketolase and transaldolase allows the interaction of the pentose phosphate pathway, in particular of its non-oxidative phase, with glycolysis, and gluconeogenesis, as well as with the pathways leading to the formation of numerous vitamins, coenzymes and nucleic acid precursors.
Transketolase
Transketolase is the rate-limiting enzyme of the nonoxidative phase of the pentose phosphate pathway, and the first enzyme that acts downstream of ribose 5-phosphate isomerase and phosphopentose epimerase.[11]
Discovered independently in 1953 by Horecker and Racker, and named by Racker, it catalyzes in the sixth and eighth steps, the transfer of a two carbon unit from a ketose, the donor substrate, namely, xylulose 5-phosphate, sedoheptulose 7-phosphate or fructose 6-phosphate, to an aldose, the acceptor substrate, ribose 5-phosphate, glyceraldehyde 3-phosphate or erythrose 4-phosphate.[8]
Reactions Catalyzed by Transketolase
Taking as an example the forward reactions, in the sixth step, the ketose donor is xylulose 5-phosphate, whereas the aldose acceptor is ribose 5-phosphate, to form glyceraldehyde 3-phosphate, the remaining three-carbon fragment from xylulose 5-phosphate, and sedoheptulose 7-phosphate, a seven-carbon sugar that will be used in the next step, the seventh.
In the eighth step, the ketose donor is xylulose 5-phosphate, whereas the aldose acceptor is erythrose 4-phosphate, to form another glyceraldehyde 3-phosphate and a fructose 6-phosphate.
It should be noted that three of the four products of the reactions catalyzed by this enzyme, two molecules of glyceraldehyde 3-phosphate and one of fructose 6-phosphate, are also intermediates of glycolysis.[11] In addition to xylulose 5-phosphate, sedoheptulose 7-phosphate and fructose 6-phosphatetransketolase can use as substrates other 2-keto sugars, as well as a variety of different aldose phosphates.
Transketolase and thiamine pyrophosphate
Transketolase is an enzyme that requires thiamine pyrophosphate (TPP) as a cofactor.
Thiamine pyrophosphate is the biologically active form of thiamin or vitamin B1, and is tightly bound to the enzyme.
Thiamine Pyrophosphate
Other enzymes that require TPP as a cofactor are:
pyruvate decarboxylase (EC 4.1.1.1), that is involved in alcoholic fermentation;
alpha-keto acid dehydrogenase or E1 component (EC 1.2.4.4) of the branched-chain alpha-ketoacid dehydrogenase complex, which catalyzes the oxidative decarboxylation of branched-chain alpha-keto acids;
alpha-ketoglutarate dehydrogenase or E1 component (EC 1.2.4.2) of the alpha-ketoglutarate dehydrogenase complex, an enzyme of the citric acid cycle.
TPP is involved in the transfer of activated aldehyde intermediates by stabilizing the two-carbon carbanions formed during the reaction.
Catalytic mechanism of transketolase
The carbon atom between the sulfur and nitrogen atoms of the thiazolium ring of thiamine pyrophosphate, namely, the C-2 atom, is much more acidic than most =CH groups found in other molecules because of adjacent positively charged nitrogen atom that electrostatically stabilizes the carbanion resulting from dissociation of the proton. This causes the C-2 proton to be easily dissociable to form a carbanion, i.e. a carbon atom with a negative charge. Such proton abstraction is catalyzed by transketolase.[5][14][22]
The carbanions attack the carbonyl carbon of the substrate, in the step 6, xylulose 5-phosphate or, in the reverse reaction, sedoheptulose 7-phosphate, whereas in the step 8, xylulose 5-phosphate or, in the reverse reaction, fructose 6-phosphate.
Taking as an example the forward reaction of step 6, the covalent adduct between thiamine pyrophosphate and xylulose 5-phosphate undergoes fragmentation, via the cleavage of the C2-C3 bond of xylulose 5-phosphate, to form glyceraldehyde 3-phosphate, that is released, and a two carbon unit, a negatively charged hydroxyethyl group, that remains bound to C-2 of the thiazolium ring.
Catalytic Mechanism of Transketolase
The negative charge on the hydroxyethyl intermediate is stabilized by the thiazolium ring of thiamine pyrophosphate because of the positively charged nitrogen atom that acts as an electron trap. Therefore, thiazolium ring provides an electron deficient or electrophilic structure that can delocalize by resonance the carbanion electrons.
Then, the condensation occurs between the hydroxyethyl group and the ribose 5-phosphate, the acceptor aldehyde substrate, via carbanion attack on the aldehyde carbon of ribose 5-phosphate, to form a covalent adduct bound to thiamine pyrophosphate.
Finally, the cleavage of the adduct leads to the release of sedoheptulose 7-phosphate, and regenerates the TPP carbanion.
Transaldolase
Discovered in 1953 by Horecker and Smyrniotis in the brewer’s yeast, assigned to the species Saccharomyces cerevisiae, it catalyzes, in the seventh step of the pentose phosphate pathway, the transfer of a three carbon unit from a donor substrate, sedoheptulose 7-phosphate, to an acceptor substrate, glyceraldehyde 3-phosphate, to form fructose 6-phosphate and erythrose 4-phosphate.[18]
Note: Like in transketolase catalyzed reactions, the carbon unit donor is a ketose while the acceptor is an aldose.
In the reverse reaction, the donor substrate is fructose 6-phosphate, while the acceptor substrate is erythrose 4-phosphate.
Catalytic mechanism of transaldolase
Unlike transketolase, transaldolase does not require a cofactor for activity.
The reaction occurs in two step, an aldol cleavage and an aldol condensation. Below, the catalytic mechanism of E. coli transaldolase B is analyzed, taking as an example the forward reaction leading to erythrose 4-phosphate and fructose 6-phosphate synthesis.
In the first step an ε-amino group of a lysine residue (Lys132) in the active site, after a proton transfer to a glutamic acid residue (Glu96) mediated by a water molecule, performs a nucleophilic attack on the carbonyl carbon of sedoheptulose 7-phosphate, that is, on the C-2 atom. The result is the formation of a carbinolamine with sedoheptulose 7-phosphate.[5][14][18][22]
Catalytic Mechanism of Transaldolase
In the second step, the removal of a water molecule from carbinolamine leads to the formation of an enzyme-bound imine or Schiff base intermediate; this step, too, involves the transfer of a proton from Glu96 to the “catalytic” water molecule.
Note: This enzyme-substrate covalent intermediate is quite similar to that formed in the reaction catalyzed by aldolase (EC 4.1.2.13) in the fourth step of glycolysis.
In the next step, the carboxylic group of an aspartic acid residue (Asp17) extracts a proton from the hydroxyl group bound to C-4, leading to the cleavage of the C–C bond between C-3 and C-4. This reaction is an aldol cleavage and releases the first product, erythrose 4-phosphate, an aldose, whereas a three-carbon carbanion remains bound to the enzyme and is stabilized by resonance, like in transketolase catalyzed reactions. In fact, like the nitrogen atom in the thiazolium ring of thiamine pyrophosphate, the nitrogen atom with a positive charge of the Schiff base acts as an electron trap stabilizing the negative charge carried by the carbanion.
Once the acceptor substrate glyceraldehyde 3-phosphate is in the active site, the carbanion performs a nucleophilic attack on the carbonyl carbon of glyceraldehyde 3-phosphate to form, by aldol condensation, a new C–C bond and an enzyme-bound ketose.
Then, the hydrolysis of the Schiff base releases fructose 6-phosphate, a ketose and the second product of the reaction. At this point, a new reaction cycle can start.
Finally, as seen previously, in the eighth step of the pentose phosphate pathway, transketolase catalyzes the synthesis of fructose 6-phosphate and glyceraldehyde 3-phosphate from erythrose 4-phosphate and xylulose 5-phosphate.
Cell’s need for NADPH, ribose 5-phosphate and ATP
From the molecular point of view, the fate of glucose 6-phosphate depends, to a large extent, on the relative activities of the enzymes that metabolize it in glycolysis and in the pentose phosphate pathway, in particular phosphofructokinase 1 (PFK-1) (EC 2.7.1.11) and glucose 6-phosphate dehydrogenase, whose activities that are highly regulated.
PFK-1 is inhibited when ATP and/or citrate concentrations increase, namely, when the energy charge of the cell is high, whereas it is activated when AMP and/or fructose 2,6-bisphosphate concentrations increase, namely, when the energy charge of the cell is low. Thus, when the energy charge of the cell is high, the carbon flow, and therefore the flow of glucose 6-phosphate, through the glycolytic pathway decreases.[20][21]
Glucose 6-phosphate dehydrogenase is inhibited by NADPH and acyl-CoAs, intermediates in fatty acid biosynthesis.[15] Thus, when the cytosolic levels of NADPH increases, the flow of glucose 6-phosphate through the pentose phosphate pathway is inhibited, whereas if NADPH levels drop, the inhibition disappears, the pathway switches on again, and NADPH and ribose 5-phosphate are synthesized.
Therefore, depending on the cell’s need for ATP, NADPH and ribose 5-phosphate, some reactions of glycolysis and the pentose phosphate pathway can be combined in novel ways to emphasize the synthesis of needed metabolites, also exploiting the fact that the non-oxidative phase of the hexose monophosphate shunt is essentially controlled by the availability of the substrates.
The four principal possibilities are described below.[2]
The need for NADPH is much greater than that for ribose 5-phosphate and ATP
When much more NADPH than ribose 5-phosphate is needed, and there is no need for additional ATP to be produced, namely, the energy charge of the cell is high, glucose 6-phosphate enters the pentose phosphate pathway and is completely oxidized to CO2. Such metabolic conditions are found, for example, in the adipose tissue during fatty acid synthesis.
Through a combination of the reactions of the non-oxidative phase and of some reactions of gluconeogenesis, namely, those catalyzed by triose phosphate isomerase (EC 5.3.1.1), aldolase (EC 4.1.2.13), phosphohexose isomerase (EC 5.3.1.9), and fructose 1,6-bisphosphatase (EC 3.1.3.11), six molecules of ribulose 5-phosphate are converted into five molecules of glucose 6-phosphate. Thus, it is possible to state that the reactions of the non-oxidative phase allow the reactions of the oxidative phase to proceed.
Three groups of reactions can be identify.
In the first group there are the reactions catalyzed by the enzymes of the oxidative phase, leading to the formation of two molecules of NADPH and one molecule of ribulose 5-phosphate.
In the second group there are the reactions catalyzed by the enzymes phosphopentose epimerase, ribose 5-phosphate isomerase, transketolase and transaldolase, namely, those of the non-oxidative phase of the pathway, that lead to the conversion of ribulose 5-phosphate to fructose 6-phosphate and glyceraldehyde 3-phosphate.
Finally, fructose 6-phosphate and glyceraldehyde 3-phosphate can be recycled to glucose 6-phosphate via some reactions of gluconeogenesis, so that the cycle can begin again.
The sum of the last two reactions shows that six molecules of ribulose 5-phosphate are converted to five molecules of glucose 6-phosphate.
6 Ribulose 5-phosphate+ H2O → 5 Glucose 6-phosphate + Pi
The sum of the reactions of the first, second and third group gives the overall reaction:
Glucose 6-phosphate + 12 NADP+ + 7 H20 → 6 CO2 + 12 NADPH + 12 H+ + Pi
Therefore, one molecule of glucose 6-phosphate, via six cycles of the pentose phosphate pathway coupled with some reactions of gluconeogenesis, is converted to six molecules of CO2, with the concomitant production of 12 molecules of NADPH, and without net production of ribose-5-phosphate.
The need for NADPH and ATP is much greater than that for ribose 5-phosphate
When much more NADPH than ribose 5-phosphate is needed, and the energy charge of the cell is low, that is, there is a need for ATP, ribulose 5-phosphate formed in the oxidative phase of the pentose phosphate pathway is converted to fructose 6-phosphate and glyceraldehyde 3-phosphate through the reactions of the non-oxidative phase. These two intermediates, through the reactions of glycolysis, are oxidized to pyruvate with concomitant ATP production.
The net reaction is:
If the cell requires more ATP, the pyruvate produced can be oxidized through the citric acid cycle.
Conversely, if there is no need for additional ATP to be produced, the carbon skeleton of pyruvate can be used as a building block in several biosynthetic pathways.
Note: As in the previous case, there is no net production of ribose 5-phosphate.
The need for ribose 5-phosphate is much greater than that for NADPH
When much more ribose 5-phosphate than NADPH is needed, as in rapidly dividing cells in which there is a high rate of synthesis of nucleotides, precursors of DNA, the reactions of the oxidative phase of the pentose phosphate pathway are bypassed, and there is no synthesis of NADPH. Conversely, because the reactions of the non-oxidative phase are easily reversible, the drop in ribose 5-phosphate levels, due to its rapid use, stimulates its synthesis.
What happens is that, through the glycolytic pathway, most of the glucose 6-phosphate is converted to fructose 6-phosphate and glyceraldehyde 3-phosphate. Then, transaldolase and transketolase lead to the synthesis of ribose 5-phosphate and xylulose 5-phosphate. Xylulose 5-phosphate, through the reactions catalyzed by phosphopentose epimerase and ribose 5-phosphate isomerase, is converted to ribose 5-phosphate.
The net reaction is:
Under this metabolic conditions therefore, what happens is an interplay between reactions of glycolysis and of the non-oxidative phase of the phosphogluconate pathway, with the latter in the direction of ribose 5-phosphate synthesis.
It should be noted no metabolites return to glycolysis.
The needs for ribose 5-phosphate and NADPH are balanced
If one molecule of ribose 5-phosphate and two molecules of NADPH per molecule of glucose 6-phosphate metabolized satisfy the metabolic needs of the cell, the reactions that predominate are those of the oxidative phase and that catalyzed by ribose 5-phosphate isomerase.
The net reaction is:
Under this metabolic conditions, too, no metabolites return to glycolysis.
References
^ abc Au S.W.N., Gover S., Lam V.M.S., Adams M.J. Human glucose-6-phosphate dehydrogenase: the crystal structure reveals a structural NADP+ molecule and provides insights into enzyme deficiency. Structure 2000;8(3):293-303. doi:10.1016/S0969-2126(00)00104-0
^ abcd Berg J.M., Tymoczko J.L., and Stryer L. Biochemistry. 5th Edition. W. H. Freeman and Company, 2002
^ Brodie A.F., Lipmann F. Identification of a gluconolactonase. J Biol Chem 1955;212(2):677-85. doi:10.1016/S0021-9258(18)71006-5
^ Cosgrove M.S., Naylor C., Paludan S., Adams M.J., Richard Levy H. On the mechanism of the reaction catalyzed by glucose 6-phosphate dehydrogenase. Biochemistry 1998;37(9);2759-2767. doi:10.1021/bi972069y
^ Hanau S., Montin K., Cervellati C., Magnani M., Dallocchio F. 6-Phosphogluconate dehydrogenase mechanism: evidence for allosteric modulation by substrate. J Biol Chem 2010;285(28):21366-21371. doi:10.1074/jbc.M110.105601
^ ab Horecker B.L. The pentose phosphate pathway. J Biol Chem 2002;277(50):47965-47971. doi:10.1074/jbc.X200007200
^ Jelakovic S., Kopriva S., Süss K-H, Schulz G.E. Structure and catalytic mechanism of the cytosolic D-ribulose-5-phosphate 3-epimerase from rice. J Mol Biol 2003;326:127-135. doi:10.1016/S0022-2836(02)01374-8
^ Kabashima T., Kawaguchi T., Wadzinski B.E., Uyeda K. Xylulose 5-phosphate mediates glucose-induced lipogenesis by xylulose 5-phosphate-activated protein phosphatase in rat liver. Proc Natl Acad Sci USA 2003;100:5107-5112. doi:10.1073/pnas.0730817100
^ ab Kochetov G.A., Solovjeva O.N. Structure and functioning mechanism of transketolase. Biochim Biophys Acta 2014;1844(9):1608-1618. doi:10.1016/j.bbapap.2014.06.003
^ Levy H.R. Glucose-6-phosphate dehydrogenase from Leuconostoc mesenteroides. Biochem Soc Trans. 1989 Apr;17(2):313-5. doi:10.1042/bst0170313
^ abcd Michal G., Schomburg D. Biochemical pathways. An atlas of biochemistry and molecular biology. 2nd Edition. John Wiley J. & Sons, Inc. 2012
^ abcdef Nelson D.L., Cox M.M. Lehninger. Principles of biochemistry. 6th Edition. W.H. Freeman and Company, 2012
^ abcd Patra K.C., Hay N. The pentose phosphate pathway and cancer. Trends Biochem Sci 2014;39(8):347-354. doi:10.1016/j.tibs.2014.06.005
^ abc Rosenthal M.D., Glew R.H. Medical Biochemistry – Human Metabolism in Health and Disease. John Wiley J. & Sons, Inc., 2009
^ Ruda G.F., Campbell G., Alibu V.P., Barrett M.P., Brenk R., Gilbert I.H. Virtual fragment screening for novel inhibitors of 6-phosphogluconate dehydrogenase. Bioorg Med Chem 2010;18(14):5056-62. doi:10.1016/j.bmc.2010.05.077
^ abcd Samland A.K., Sprenger G.A. Transaldolase: from biochemistry to human disease. Int J Biochem Cell Biol 2009;41(7):1482-1494. doi:10.1016/j.biocel.2009.02.001
^ Sprenger G.A. Genetics of pentose-phosphate pathway enzymes of Escherichia coli K-12. Arch Microbiol 1995;164(5):324-30. doi:10.1007/BF02529978
^ Van Schaftingen E., Hers H-G. Inhibition of fructose-1,6-bisphosphatase by fructose-2,6-bisphosphate. Proc Natl Acad Sci USA 1981;78(5):2861-2863. doi:10.1073/pnas.78.5.2861
^ Van Schaftingen E., Jett M-F., Hue L., Hers H-G. Control of liver 6-phosphofructokinase by fructose 2,6-bisphosphate and other effectors. Proc Natl Acad Sci USA 1981;78(6):3483-3486. doi:10.1073/pnas.78.6.3483
^ abcdefg Voet D. and Voet J.D. Biochemistry. 4th Edition. John Wiley J. & Sons, Inc. 2011
^ Zhang R., Andersson C.E., Savchenko A., Skarina T., Evdokimova E., Beasley S., Arrowsmith C.H., Edwards A.M., Joachimiak A., Mowbray S.L. Structure of Escherichia coli ribose-5-phosphate isomerase: a ubiquitous enzyme of the pentose phosphate pathway and the Calvin cycle. Structure 2003;11(1):31-42. doi:10.1016/S0969-2126(02)00933-4
Glycolysis, from Greek word glykys, meaning “sweet”, and lysis, meaning “dissolution or breakdown”, can be defined as the sequence of enzymatic reactions that, in the cytosol, also in the absence of oxygen, leads to the conversion of one molecule of glucose, a six carbon sugar, to two molecules of pyruvate, a three carbon compound, with the concomitant production of two molecules of ATP, the universal energy currency in biological systems.[5]
The Glycolytic Pathway
Glycolysis, which evolved before a substantial amount of oxygen had accumulated in the atmosphere, is the metabolic pathway with the largest flux of carbon in most living cells, and is present in almost all organisms.
This pathway, not requiring oxygen, played a crucial role in metabolic processes during the first 2 billion years of evolution of life, and probably represents the most ancient biological mechanism for extracting energy from organic molecules when oxygen availability is low. Moreover, glycolysis is a source of precursors for aerobic catabolism and for various biosynthetic processes.
Note: glycolysis is also known as the Embden-Meyerhof pathway, named after Gustav Embden and Otto Meyerhof, the two researchers who elucidated the entire pathway in the muscle.[2][5]
The development of biochemistry has gone hand in hand with the elucidation of glucose metabolism, especially glycolysis, the first metabolic pathway to have been elucidated.[2][5]
Though the elucidation of this metabolic pathway was worked out in the ‘40 of the last century, the key discovery about glucose metabolism was made in 1897, quite by accident, following a problem arose a year earlier, when a German chemist, M. Hahn, in attempting to obtain and preserve cell-free protein extracts of yeast, encountered difficulties in its conservation. A colleague, Hans Buchner, remembering a method for preserving jams, suggested to add sucrose to the extract.
Eduard Buchner, Hans’s brother, put the idea of Hans into practice, and observed that the solution produced bubbles. This prompted Eduard to conclude that a fermentation was occurring, a quite surprising discovery. Indeed fermentation, according to Pasteur’s assertion in 1860, was inextricably tied to living cells, whereas it was now demonstrated that it could also occur outside them. Briefly, these two researchers refuted the vitalist dogma and had a pivotal role in starting modern biochemistry.
Eduard Buchner was awarded the Nobel Prize in Chemistry in 1907 for this research, and was the first of several researchers who won the award for their discoveries concerning glycolysis.
It was later demonstrated, working with muscle extracts, that many of the reactions of lactic fermentation were the same of those of alcoholic fermentation, thus revealing the underlying unity in biochemistry.
As previously mentioned, glycolysis was then fully elucidated in the first half of the last century largely due to the work of researchers such as Gerty and Carl Cori, Carl Neuberg, Arthur Harden, William Young, Jacob Parnas, Otto Warburg, Hans von Euler-Chelpin, Gustav Embden and Otto Meyerhof. In particular, Warburg and von Euler-Chelpin elucidated the whole pathway in yeast, and Embden and Meyerhof in muscle in the 30’s.
Why is it so important?
Glycolysis is essential to most living cells both from the energy point of view and as a source of precursors for many other metabolic pathways. And the rate of carbon flow through glycolysis, namely, the amount of glucose converted to pyruvate per unit time, is regulated to meet these two basic needs for the cell.[7]
From the energetic point of view, although glycolysis is a relatively inefficient pathway, it can occur in the absence of oxygen, the condition in which life evolved on Earth and that many contemporary cells, both eukaryotic and prokaryotic, experience. Here are some examples.
In most animals, muscles exhibit an activity-dependent anaerobiosis, namely, they can work anaerobically for short periods. For example, when animals, but also athletes, perform high intense exercises, their need for ATP exceeds body’s ability to supply oxygen to the muscle. In such situation, muscles function, albeit for a short period of time, anaerobically.
Another example is the cornea of the eye, a poorly vascularized tissue.
Many microorganisms live in environments where oxygen is low or absent, such as deep water, soil, but also skin pores. And a variety of microorganisms called obligate anaerobes cannot survive in the presence of oxygen, a highly reactive molecule. Examples are Clostridium perfringens, Clostridium tetani, and Clostridium botulinum, that cause gangrene, tetanus and botulism, respectively.
It should also be underlined that glycolysis also plays a key role in those cells and tissues in which glucose is the sole source of energy, such as:
red blood cells, lacking mitochondria,
sperm cells;
the brain, which can also use ketone bodies for fuel in times of low glucose;
the adrenal medulla.
A similar situation is also found in the plant world where many aquatic plants and some plant tissues specialized in starch accumulation, such as potato tubers, use glucose as the main source of energy.
Note: There are organisms that are facultative anaerobes, namely organisms that can survive in the presence and in the absence of oxygen, acting aerobically or anaerobically, respectively. Examples are animals belonging to the genus Mytilus, which display a habitat-dependent anaerobiosis, a condition similar to the activity-dependent anaerobiosis seen in muscle.
Finally, it should not be forgotten that under aerobic conditions, in cells with mitochondria, glycolysis constitutes the upper part of the metabolic pathway leading to the complete oxidation of glucose to carbon dioxide (CO2) and water for energy purposes.
Glycolysis as a Source of Building Blocks
Some glycolytic intermediates, for example glucose 6-phosphate (G-6-P), fructose 6-phosphate (F-6-P) or dihydroxyacetone phosphate (DHAP), may be used as building blocks in several metabolic pathways, such as those leading to glycogen synthesis, and the synthesys of fatty acids, triglycerides, nucleotides, some amino acids, and 2,3-bisphosphoglycerate (2,3-BPG).
Sequence of reactions
The 10 steps that make up glycolysis can be divided into two phases.
The first, called the preparatory phase, consists of 5 steps and starts with the conversion of glucose to fructose 1,6-bisphosphate (F-1,6-BP) through three enzymatic reactions, namely, a phosphorylation at C-1, an isomerization, and a second phosphorylation, this time at C-6, with consumption of 2 ATP. Fructose 1,6-bisphosphate is then cleaved into two phosphorylated three-carbon compounds, glyceraldehyde 3-phosphate and dihydroxyacetone phosphate. Finally, the isomerization of DHAP to a second molecule of glyceraldehyde-3- phosphate occurs. In the preparatory phase therefore a glucose is split into two molecules of glyceraldehyde 3-phosphate, and two ATP are consumed.[2][5]
In the second phase, called the payoff phase, consisting of the remaining 5 steps of the pathway, the two molecules of glyceraldehyde 3-phosphate are converted into two molecules of pyruvate, with the concomitant production of 4 ATP. So, in this phase, part of the energy present in the chemical bonds of glucose is extracted and conserved in the form of ATP. Furthermore, reducing equivalents are extracted and conserved in the form of the reduced coenzyme NADH. The metabolic fate of NADH will depend on the cell type and aerobic or anaerobic conditions.[2][5]
Note: Glucose metabolized in the glycolytic pathway derives both from glucose that enters the cell through specific membrane transporters, that in turn derives from the bloodstream, and glucose 6-phosphate produced by glycogenolysis.
Reaction 1
In the first step of the glycolytic pathway glucose is phosphorylated to glucose 6-phosphate at the expense of one ATP.
Glucose + ATP → Glucose 6-phosphate + ADP + H+
In most cells this reaction is catalyzed by hexokinase (EC 2.7.1.1), enzyme present in the cells of all organisms, and in humans with four isozyme.
Hexokinase and pyruvate kinase, the other kinase of the glycolysis, like many other kinases, require the presence of magnesium ion, Mg2+, or of another bivalent metal ion such as manganese, Mn2+, for their activity. Mg2+ binds to the ATP to form the complex MgATP2-, and in fact the true substrate of the enzyme is not ATP but this complex. It should be emphasized that the nucleophilic attack by a hydroxyl group (-OH) of glucose at the terminal phosphorus atom of the ATP is facilitated by the action of Mg2+ that interacts with the negative charges of the phosphoryl groups of the nucleoside triphosphate.
The formation of the phosphoester bond between a phosphoryl group and the hydroxyl group at C-6 of glucose is thermodynamically unfavorable and requires energy to proceed, energy that is provided by the ATP. Indeed, while the phosphorylation of glucose at C-6 by inorganic phosphate has a ΔG°’ of 13.8 kJ/mol (3.3 kcal/mol), namely, it is an endergonic reaction, the hydrolysis of ATP to ADP and Pi has ΔG°’ of -30.5 kJ/mol (-7.3 kcal/mol), namely, it is an exergonic reaction. The net reaction has a ΔG°’ of (-30.5 + 13.8) = -16.7 kJ/mol (-7.3 + 3.3 = -4.0 kcal/mol). Under cellular conditions the reaction is even more favorable, with a ΔG equal to -33.5 kJ/mol (-8.0 kcal/mol).
Therefore, this is an essentially irreversible reaction.
Note: In biochemistry, phosphorylations are fundamental reactions catalyzed by enzymes called kinases, a subclass of transferases. Kinases catalyze the transfer of the terminal phosphoryl group, or γ-phosphoryl group, of a nucleoside triphosphate to an acceptor nucleophile to form a phosphoester bond. Specifically, hexokinase catalyzes the transfer of the γ-phosphoryl group of ATP to a variety of hexoses, that is, sugars with six carbons, such as fructose and mannose, in addition to glucose.
The importance of glucose phosphorylation
The phosphorylation of glucose has some functions.[2]
Glucose 6-phosphate, due to its negative charge and because there are no transporters for phosphorylated sugars in the plasma membrane, cannot diffuse out of the cell. Thus, after the initial phosphorylation, no further energy is needed to keep the phosphorylated molecule within the cell, despite the large difference between its intra- and extracellular concentrations.
Similar considerations are valid for each of the eight phosphorylated intermediates between glucose 6-phosphate and pyruvate.
The rapid phosphorylation of glucose maintains a low intracellular concentration of the hexose, thus favoring its facilitated diffusion into the cell.
Phosphorylation causes an increase in the energy content of the molecule, that is, it starts to destabilize it, thus facilitating its further metabolism.
Other possible fates of glucose 6-phosphate
Glucose 6-phosphate is a key metabolite of glucose metabolism. In fact, in addition to be metabolized in the glycolytic pathway, in anabolic conditions it can have other fates. Here are some examples.
It can be used in the synthesis of:
glycogen, a polysaccharide stored mainly in the liver and muscle;
complex polysaccharides present in the extracellular matrix; galactose;
glucosamine and other sugars used for protein glycosylation.
NADPH, needed for reductive biosynthesis, such as fatty acid, cholesterol, steroid hormone, and deoxyribonucleotide biosynthesis, and for preventing oxidative damage in cells such as erythrocytes;
ribose 5-phosphate, used in nucleotide synthesis but also in NADH, FADH2 and coenzyme A synthesis.
Reaction 2
In the second step of the glycolysis, the isomerization of glucose 6-phosphate, an aldose, to fructose 6-phosphate, a ketose, occurs. This reaction is catalyzed by phosphoglucose isomerase, also known as phosphohexose isomerase or glucose phosphate isomerase (EC 5.3.1.9).
Glucose 6-phosphate ⇄ Fructose 6-phosphate
These molecules are an example of functional group isomerism.
Like hexokinase, phosphoglucose isomerase requires the presence of Mg2+.
The ΔG°’ of the reaction is 1.7 kJ/mol (0.4 kcal/mol), while the ΔG is -2.5 kJ/mol (-0.6 kcal/mol). These small values indicate that the reaction is close to equilibrium and is easily reversible.
The reaction essentially consists in the shift of the carbonyl group at C-1 of the open-chain form of glucose 6-phosphate to C-2 of the open-chain form of fructose 6-phosphate.
Phosphoglucose Isomerase Reaction
The enzymatic reaction can be divided at least into three steps. Since in aqueous solution both hexoses are primarily present in the cyclic form, the enzyme must first open the ring of G-6P, catalyze the isomerization, and, finally, the formation of the five-membered ring of F-6-P.
This isomerization is a critical step for glycolytic pathway, as it prepares the molecule for the subsequent two steps.
Why?
The phosphorylation that occurs in the third step requires the presence of an alcohol group at C-1, and not of a carbonyl group.
In the fourth step, the covalent bond between C-3 and C-4 is cleaved, and this reaction is facilitated by the presence of the carbonyl group at C-2.
Reaction 3
In the third step of the glycolytic pathway, a second phosphorylation reaction occurs. Phosphofructokinase 1 or PFK-1 (EC 2.7.1.11) catalyzes the phosphorylation of fructose 6-phosphate at C-1 to form fructose 1,6-bisphosphate, at the expense of one ATP.
PFK-1 is so named to distinguish it from phosphofructokinase 2 or PFK-2 (EC 2.7.1.105), the enzyme that catalyzes the phosphorylation of fructose 6-phosphate to fructose 2,6-bisphosphate.
Like the reaction catalyzed by hexokinase/glucokinase, this phosphorylation, too, is an essentially irreversible step, irreversibility, once again, achieved by coupling, by phosphofructokinase 1, with the hydrolysis of ATP. In fact, phosphorylation of fructose 6-phosphate by inorganic phosphate is endergonic, with a ΔG°’ of 16.3 kJ/mol (3.9 kcal/mol), whereas, when the reaction is coupled to the hydrolysis of ATP, the overall equation becomes exergonic, with a ΔG°’ of -14.2 kJ/mol (-3.4 kcal/mol) and a ΔG of -22.2 kJ/mol (-5.3 kcal/mol).
While hexokinase allows to trap glucose inside the cell, phosphofructokinase 1 prevents glucose to be used for glycogen synthesis or the production of other sugars, but is instead metabolized in the glycolytic pathway. In fact, unlike glucose 6-phosphate, fructose 1,6-bisphosphate cannot be used directly in other metabolic pathways than glycolysis/gluconeogenesis, that is, phosphofructokinase 1 catalyzes the first “committed” step of the glycolytic pathway. Such reactions are usually catalyzed by enzymes regulated allosterically, that prevent the accumulation of both intermediates and final products. PFK-1 is no exception, being subject to allosteric regulation by positive and negative effectors that signal the energy level and the hormonal status of the organism.
Some protists and bacteria, and perhaps all plants, have a phosphofructokinase that uses pyrophosphate (PPi) as a donor of the phosphoryl group in the synthesis of F-1,6-BP. This reaction has a ΔG°’ of -2.9 kJ/mol (-12.1 kcal/mol).
Fructose 6-phosphate + PPi → Fructose 1,6-bisphosphate + Pi
Note: The prefix bis– in bisphosphate, as fructose 1,6-bisphosphate, indicates that there are two phosphoryl groups are bonded to different atoms.
The prefix di– in diphosphate, as in adenosine diphosphate, indicates that there are two phosphoryl groups connected by an anhydride bond to form a pyrophosphoryl group, namely, they are directly bonded to one another.
Similar rules also apply to the nomenclature of molecules that have three phosphoryl groups standing apart, such as inositol 1,4,5-trisphosphate, or connected by anhydride bonds, such as ATP or guanosine triphosphate or GTP.
Reaction 4
In the fourth step of the glycolysis, fructose 1,6-bisphosphate aldolase, often called simply aldolase (EC 4.1.2.13), catalyzes the reversible cleavage of fructose 1,6-bisphosphate into glyceraldehyde 3-phosphate, an aldose, and dihydroxyacetone phosphate, a ketose. The enzyme cleaves the bond between C-3 and C-4.
All glycolytic intermediates downstream to this reaction are three-carbon molecules, instead of six-carbon molecules as the previous ones.
The ΔG°’ of the reaction in the direction of glyceraldehyde 3-phosphate and dihydroxyacetone phosphate production is of 23.8 kJ/mol (5.7 kcal/mol), and the Km is approximately 10-4 M, values that would indicate that the reaction does not proceed as written from left to right. However, under normal cellular conditions, due to the lower concentrations of the reactants, the ΔG is -1.3 kJ/mol (-0.3 kcal/mol), a very small value, thus the reaction is easily reversible, that is, essentially to equilibrium.
Note: The name “aldolase” derives from the nature of the reverse reaction, from right to left as written, that is, an aldol condensation.
Reaction 5
Of the two products of the previous reaction, glyceraldehyde 3-phosphate goes directly into the second phase of the glycolytic pathway. Conversely, DHAP is not on the direct pathway of glycolysis and must be converted, isomerized, to glyceraldehyde 3-phosphate to continue through the pathway. This isomerization is catalyzed by triose phosphate isomerase (EC 5.3.1.1).
Triose phosphate isomerase, in converting dihydroxyacetone phosphate into glyceraldehyde 3-phosphate, catalyzes the transfer of a hydrogen atom from C-1 to C-2, that is, catalyzes an intramolecular oxidation-reduction. And in essence, after the enzyme reaction, the carbons C-1, C-2 and C-3 of the starting glucose to become equivalent, chemically indistinguishable, from the carbons C-6, C-5 and C-4, respectively.
Therefore, the net result of the last two steps of glycolysis is the production of two molecules of glyceraldehyde 3-phosphate.
The ΔG°’ of the reaction is of 7.5 kJ/mol (1.8 kcal/mol), while the ΔG is 2.5 kJ/mol (0.6 kcal/mol). Although at equilibrium dihydroxyacetone phosphate represent about 96 percent of the triose phosphates, the reaction proceeds readily towards the formation of glyceraldehyde 3-phosphate because of the subsequent step of the glycolytic pathway that removes the glyceraldehyde 3-phosphate produced.
One of the distinguishing features of triose phosphate isomerase is the great catalytic efficiency. The enzyme is in fact considered kinetically perfect. Why? The enzyme enhances the isomerization rate by a factor of 1010 compared with that obtained with a catalyst such as acetate ion. Indeed, the Kcat/KM ratio for the isomerization of glyceraldehyde 3-phosphate is equal to 2×10⁸ M-1s-1, value close to the diffusion-controlled limit. Thus, the rate-limiting step in the reaction catalyzed by triose phosphate isomerase is diffusion-controlled encounter of enzyme and substrate.
From the energetic point of view, the last two steps of glycolysis are unfavorable, with ΔG°’ of 31.3 kJ/mol (7.5 kcal/mol), whereas the net ΔG°’ of the first five reactions is of 2.1 kJ/mol (0.5 kcal/mol), with a Keq of about 0.43. And it is the free energy derived from the hydrolysis two ATP that, under standard-state conditions, makes the value of the overall equilibrium constant close to one. If instead we consider ΔG, it is quite negative, -56.8 kJ/mol (-13.6 kcal/mol).
Notice that dihydroxyacetone phosphate may also be reduced to glycerol 3-phosphate in the reaction catalyzed by cytosolic glycerol 3-phosphate dehydrogenase (EC 1.1.1.8).
The enzyme acts as a bridge between glucose and lipid metabolism because the glycerol 3-phosphate produced is used in the synthesis of lipids such as triacylglycerols.
This reaction is an important source of glycerol 3-phosphate in adipose tissue and small intestine.
Reaction 6
In the sixth step of the glycolysis, the first step of the second phase, the payoff phase, glyceraldehyde 3-phosphate dehydrogenase (EC 1.2.1.12) catalyses the oxidation of glyceraldehyde 3-phosphate to 1,3-bisphosphoglycerate (1,3-BPG), with the concomitant reduction of NAD+ to NADH.
This is the first of the two glycolytic reactions in which the chemical energy needed for the subsequent synthesis of ATP is harvested and made available; the other reaction is catalyzed by enolase (EC 4.2.1.11). Why?
This reaction is the sum of two processes.
In the first reaction, the oxidation of the aldehyde group to a carboxyl group occurs, step in which NAD+ is used as oxidizing agent. The reaction is quite exergonic, with a ∆G’° of -43 kJ/mol (-10.3 kcal/mol).
In the second reaction, the formation of the bond between the carboxylic group at C-1 of 1,3-bisphosphoglycerate and orthophosphate occurs, to form an anhydride called acyl phosphate. The reaction is quite endergonic, with a ∆G’° of 49.3 kJ/mol (11.8 kcal/mol).
These two chemical processes must not take place in succession but must be coupled in order to allow the formation of the acyl phosphate because the oxidation of the aldehyde group is used to drive the formation of the anhydride, with an overall ΔG°’ of 6.3 kJ/mol (1.5 kcal/mol), and a ΔG of 2.5 kJ/mol (0.6 kcal/mol), both slightly endergonic.
Therefore, the free energy that might be released as heat is instead conserved by the formation of the acyl phosphate.
Note: The reversible reduction of the nicotinamide ring of NAD+ or NADP+ is due to the loss of two hydrogen atoms by another molecule, in this case the aldehyde group of glyceraldehyde 3-phosphate, that undergoes oxidation, and to the subsequent transfer of a hydride ion, the equivalent of two electrons and a proton, to the nicotinamide ring. The other proton removed from the substrate is released to the aqueous solution. Below, the half reactions for both coenzymes.
NAD+ + 2 e– + 2 H+ → NADH + H+
NADP+ + 2 e– + 2 H+ → NADH + H+
Reaction 7
In the seventh step of the glycolytic pathway, phosphoglycerate kinase (EC 2.7.2.3) catalyzes the transfer of the high-energy phosphoryl group from the acyl phosphate of 1,3-BPG to ADP to form ATP and 3-phosphoglycerate (3-PG).
1,3-Bisphosphoglycerate + ADP + H+ ⇄ 3-Phosphoglycerate + ATP
ΔG°’ is of -18.5 kJ/mol (-4.4 kcal/mol), namely, it is an exergonic reaction, whereas ΔG is 1.3 kJ/mol (0.3 kcal/mol).
The high phosphoryl-transfer potential of the acyl phosphate is used to phosphorylate ADP. The production of ATP in this manner is called substrate-level phosphorylation. In other words, part of the energy released during the oxidation of the aldehyde group in the sixth step is now conserved by the synthesis of ATP from the ADP and Pi.
The reaction catalyzed by phosphoglycerate kinase is the first reaction of glycolysis in which part of the chemical energy present in glucose molecule is conserved as ATP. And, because the reactions catalyzed by aldolase and triose phosphate isomerase, step 4 and 5, respectively, lead to the formation of two molecules of glyceraldehyde 3-phosphate per molecule of glucose, in this step two ATP are produced and the ATP debt created by the preparatory phase, steps 1 and 3, respectively, is “paid off”.
It should be noted that the enzyme is named for the reverse reaction, from right to left as written, that is, the phosphorylation of 3-phosphoglycerate to form 1,3-bisphosphoglycerate at the expense of one ATP.
Indeed, this enzyme, like all other enzymes, is able to catalyze the reaction in both directions. And the direction leading to the synthesis of 1,3-bisphosphoglycerate occurs during the photosynthetic CO2 fixation and gluconeogenesis.
The sixth and seventh reactions of glycolysis, are, as a whole, an energy-coupling process in which the common intermediate is 1,3-bisphosphoglycerate. While the reaction leading to the synthesis of 1,3-BPG is endergonic, with a ΔG°’ of 6.3 kJ/mol (1.5 kcal/mol), the second reaction is strongly exergonic, with a ΔG°’ of -18.5 kJ/mol (-4,4 kcal/mol). The overall ΔG°’ is -12.2 kJ/mol (-2.9 kcal/mol), namely, the reaction catalyzed by phosphoglycerate kinase is sufficiently exergonic to pull even the previous one, too, making the overall reaction exergonic.
Glyceraldehyde 3-phosphate + ADP + Pi + NAD+ ⇄ 3-Phosphoglycerate + ATP + NADH + H+
In reality, phosphoglycerate kinase reaction is sufficiently exergonic to pull also the reactions catalyzed by aldolase and triose phosphate isomerase.
What is substrate-level phosphorylation?
Substrate-level phosphorylation is defined as the production of ATP by the transfer of a phosphoryl group from a substrate to ADP, a process involving chemical intermediates and soluble enzymes.
There is also a second type of phosphorylation for the synthesis of ATP called oxidative phosphorylation, a process involving not chemical intermediates and soluble enzymes but transmembrane proton gradients and membrane-bound enzymes.
Because the standard free energy of hydrolysis of the phosphoryl group of 3-phosphoglycerate is equal to 12.5 kJ/mol (-3 kcal/mol), it is not sufficient to produce ATP by phosphoryl group transfer. In the two subsequent reactions of glycolysis, 3-phosphoglycerate is converted to phosphoenolpyruvate (PEP), a molecule with a phosphoryl group transfer potential sufficiently elevated to allow the synthesis of ATP.
Reaction 8
In the eighth step of the glycolysis, 3-phosphoglycerate is converted into 2-phosphoglycerate (2-PG), in a reversible reaction catalyzed by phosphoglycerate mutase (EC 5.4.2.1). The reaction requires Mg2+, and has a very small ΔG, equal to about 0.8 kJ/mol (0.2 kcal/mol) and a ΔG°’ of 4.4 kJ/mol (1.1 kcal/mol).
Phosphoglycerate mutase is a mutase, enzymes that catalyze intramolecular group transfers, in this case the transfer of a phosphoryl group from C-3 to C-2 of the 3-phosphoglycerate. Mutases, in turn, are a subclass of isomerases.
The mechanism by which this reaction takes place depends on the type of organism studied. For example, in yeast or in rabbit muscle the reaction occurs in two steps and involves the formation of phosphoenzyme intermediates. In the first step, a phosphoryl group bound to a histidine residue in the active site of the enzyme is transferred to the hydroxyl group at C-2 of 3-PG to form 2,3-bisphosphoglycerate. In the next step, the enzyme acts as a phosphatase converting 2,3-BPG into 2-phosphoglycerate; however, the phosphoryl group at C-3 is not released but linked to the histidine residue of the active site to regenerate the intermediate enzyme-His-phosphate. Schematically:
Notice that the phosphoryl group of 2-phosphoglycerate is not the same as that of the substrate 3-phosphoglycerate.
Approximately once in every 100 catalytic cycles, 2,3-BPG dissociates from the active site of the enzyme, leaving it unphosphorylated, that is, in the inactive form. The inactive enzyme may be reactivated by binding 2,3-bisphosphoglycerate, which must, therefore, be present in the cytosol to ensure the maximal activity of the enzyme. And 2,3-BPG is present in small, but sufficient amounts in most cells, except for red blood cells, where it acts as an allosteric inhibitor, too, reducing the affinity of hemoglobin for oxygen, and has a concentration of 4-5 mM.
Note: 3-Phosphoglycerate can also be used for the biosynthesis of serine, from which glycine and cysteine derive. The biosynthesis of serine begins with the reaction catalyzed by phosphoglycerate dehydrogenase (EC 1.1.1.95). The enzyme catalyzes the oxidation of 3-phosphoglycerate to 3-phosphohydroxypyruvate and the concomitant reduction of NAD+ to NADH. This reaction is also the rate-limiting step of this biosynthetic pathway, because serine inhibits the activity of the enzyme.
Synthesis of 2,3-bisphosphoglycerate and the Rapoport-Luebering pathway
1,3-Bisphosphoglycerate can be also converted into 2,3-bisphosphoglycerate.
In red blood cells this reaction is catalyzed by the bisphosphoglycerate mutase,[6] one of the three isoforms of phosphoglycerate mutase found in mammals. The enzyme requires the presence of 3-phosphoglycerate as it catalyzes the intermolecular transfer of a phosphoryl group from C-1 of 1,3-bisphosphoglycerate to the C-2 of 3-phosphoglycerate. Therefore, 3-phosphoglycerate becomes 2,3-BPG, while 1,3-BPG is converted into 3-phosphoglycerate. The mutase enzyme activity has EC number 5.4.2.4.
Synthesis of 2,3-BPG
2,3-Bisphosphoglycerate can then be hydrolyzed to 3-phosphoglycerate in the reaction catalyzed by the phosphatase activity of bisphosphoglycerate mutase, that removes the phosphoryl group at C-2. This activity has EC number 3.1.3.13. The enzyme is also able to catalyze the interconversion of 2-phosphoglycerate and 3-phosphoglycerate, therefore, it is a trifunctional enzyme. 3-Phosphoglycerate can then re-enter the glycolytic pathway. This detour from glycolysis, also called Rapoport-Luebering pathway, that leads to the synthesis of 3-phosphoglycerate without any ATP production.
The other two isoforms of phosphoglycerate mutase, phosphoglycerate mutase 1 or type M, present in the muscle, and phosphoglycerate mutase 2 or type B, present in all other tissues, are able to catalyze, in addition to the interconversion of the 2-phosphoglycerate and 3-phosphoglycerate, the two steps of Rapoport-Luebering pathway, although with less efficacy than the glycolytic reaction. Therefore, they are trifunctional enzymes.
Reaction 9
In the ninth step of the glycolytic pathway, 2-phosphoglycerate is dehydrated to form phosphoenolpyruvate, an enol, in a reversible reaction catalyzed by enolase.
2-Phosphoglycerate ⇄ Phosphoenolpyruvate + H2O
The reaction requires Mg2+ that stabilizes the enolic intermediate that is formed during the process.
The ΔG°’ of the reaction is 7.5 kJ/mol (1.8 kcal/mol), while ΔG -3.3 kJ/mol (-0.8 kcal/mol).
Like 1,3-BPG, phosphoenolpyruvate has a phosphoryl group transfer potential high enough to allow ATP formation. Why does this phosphoryl group have a high free energy of hydrolysis?
Although phosphoenolpyruvate and 2-phosphoglycerate contain nearly the same amount of metabolic energy with respect to decomposition to CO2, H20 and Pi, 2-PG dehydration leads to a redistribution of energy such that the standard free energy of hydrolysis of the phosphoryl groups vary as described below:
-17.6 kJ/mol (-4.2 kcal/mol) for 2-phosphoglycerate, a phosphoric ester;
-61.9 kJ/mol (-14.8 kcal/mol) for phosphoenolpyruvate, an enol phosphate.
What happens is that the phosphoryl group traps PEP in its unstable enol form. When, in the last step of glycolysis, phosphoenolpyruvate donates the phosphoryl group to ADP, ATP and the enol form of pyruvate are formed. The enol form of pyruvate is unstable and tautomerizes rapidly and nonenzymatically to the more stable keto form, that predominates at pH 7. So, the high phosphoryl-transfer potential of PEP is due to the subsequent enol-keto tautomerization of pyruvate.
Reaction 10
In the final step of the glycolysis, pyruvate kinase (EC 2.7.1.40) catalyzes the transfer of the phosphoryl group from phosphoenolpyruvate to ADP to form pyruvate and ATP. This is the second substrate-level phosphorylation of glycolysis.
Phosphoenolpyruvate + ADP + H+ → Pyruvate + ATP
The enzyme is a tetramer and, like PFK-1, is a highly regulated. Indeed, it has binding sites for numerous allosteric effectors. Moreover, in vertebrates, there are at least three isozymes of pyruvate kinase, of which the M type predominates in muscle and brain, while the L type in liver. These isozymes have many properties in common, whereas differ in the response to hormones such as glucagon, epinephrine and insulin.
The enzyme activity is stimulated by potassium ion (K+) and some other monovalent cations.
The reaction is essentially irreversible, with a ΔG°’ of -31.4 kJ/mol (-7.5 kcal/mol), and a ΔG of -16.7 kJ/mol (-4.0 kcal/mol), largely due, as anticipated in the previous paragraph, to the tautomerization of the pyruvate from the enol form to the more stable keto form.
Spontaneous Tautomerization of Pyruvate
And, of the -61.9 kJ/mol (14.8 kcal/mol) released from the hydrolysis of the phosphoryl group of PEP, nearly half is conserved in the formation of the phosphoanhydride bond between ADP and Pi, whose ΔG°’ is of -30.5 kJ/mol (-7.3 kcal/mol). The remaining energy, -31.4 kJ/mol (-7.5 kcal/mol), is the driving force that makes the reaction proceed towards ATP production.
While the reaction catalyzed by phosphoglycerate kinase, in the seventh step of the glycolytic pathway, pays off the ATP debt of the preparatory phase, the reaction catalyzed by pyruvate kinase allows a net gain of two ATP.
Fate of NADH and pyruvate
Glycolysis produces 2 NADH, 2 ATP, and 2 pyruvate molecules per molecule of glucose.
NADH must be reoxidized to NAD+ to allow glycolysis to proceed.[2] NAD+, a coenzyme that is produced from the vitamin B3, also known as niacin, is present in limited amounts in the cytosol, ≤ 10-5M, a value well below than that of glucose metabolized in a few minutes, and must be continuously regenerated. Therefore, the final step of the glycolytic pathway is the regeneration of NAD+ from NADH through aerobic or anaerobic pathways, each of which involves pyruvate. Such pathways allow, therefore, maintenance of the redox balance of the cell.
Pyruvate is a versatile metabolite that can enter several metabolic pathways, both anabolic and catabolic, depending on the type of cell, the energy state of the cell and the availability of oxygen.[5]
Catabolic Fates of Pyruvate
With the exception of some variations encountered in bacteria, exploited, for example, in food industry for the production of various foods such as many cheeses, there are essentially three pathways in which pyruvate may enter:
reduction to lactate, through lactic acid fermentation;
reduction to ethanol or ethyl alcohol, through alcoholic fermentation;
aerobic oxidation.
This allows glycolysis to proceed in both anaerobic and aerobic conditions.
It is therefore possible to state that the catabolic fate of the carbon skeleton of glucose is influenced by the cell type, the energetic state of the cell, and the availability of oxygen.
Lactic acid fermentation
In animals, with few exceptions, and in many microorganisms when oxygen availability is insufficient to meet the energy requirements of the cell, or if the cell is without mitochondria, the pyruvate produced by glycolysis is reduced to lactate in the cytosol, in a reaction catalyzed by lactate dehydrogenase (EC 1.1.1.27).
Pyruvate + NADH + H+ ⇄ Lactate + NAD+
In the reaction, pyruvate, by accepting electrons from NADH, is reduced to lactate, while NAD+ is regenerated. And the overall equilibrium of the reaction strongly favors the formation of lactate, as shown by the value of ΔG°’ of -25.1 kJ/mol (-6 kcal/mol).
The conversion of glucose to lactate is called lactic acid fermentation. The overall equation of the process is:
Glucose + 2 Pi + 2 ADP + 2H+ → 2 Lactate + 2 ATP + 2 H2O
Notice that fermentation, discovered by Louis Pasteur who defined it “la vie sans l’air”, is a metabolic pathway that:
extracts energy from glucose and stores it as ATP;
does not consume oxygen;
does not change the concentration of NAD+ or NADH.
With regard to coenzymes, neither NAD+ nor NADH appears in the overall equation, although both are crucial in the process, that is, no net oxidation-reduction occurs. In other words, in the conversion of glucose, C6H12O6, to lactate, C3H6O3, the ratio of hydrogen to carbon atoms of the reactants and products does not change.
From an energy point of view, it should however be emphasized that fermentation extracts only a small amount of the chemical energy of glucose.
In humans, much of the lactate produced enters the Cori cycle for glucose production via gluconeogenesis. We can also state that lactate production shifts part of the metabolic load from the extrahepatic tissues, such as skeletal muscle during intense bouts of exercise, like a 200-meter, when the rate of glycolysis can almost instantly increase 2,000-fold, to the liver.
In contrast to skeletal muscle that releases lactate into the venous blood, the heart muscle is able to take up and use it for fuel, due to its completely aerobic metabolism and to the properties of the heart isozyme of lactate dehydrogenase, referred to as H4. Therefore, portion of the lactate released by skeletal muscle engaged in intense exercise is used by the heart muscle for fuel.
Note: Lactate produced by microorganisms during lactic acid fermentation is responsible for both the scent and taste of sauerkraut, namely, fermented cabbage, as well as for the taste of soured milk.
Alcoholic fermentation
In microorganisms such as brewer’s and baker’s yeast, in certain plant tissues, and in some invertebrates and protists, pyruvate, under hypoxic or anaerobic conditions, may be reduced in two steps to ethyl alcohol or ethanol, with release of CO2.
The first step involves the non-oxidative decarboxylation of pyruvate to form acetaldehyde, an essentially irreversible reaction catalyzed by pyruvate decarboxylase (EC 4.1.1.1), an enzyme that requires Mg2+ and thiamine pyrophosphate, a coenzyme derived from vitamin thiamine or vitamin B1. The enzyme is absent in vertebrates and in other organisms that perform lactic acid fermentation.
In the second step, acetaldehyde is reduced to ethanol in a reaction catalyzed by alcohol dehydrogenase (EC 1.1.1.1), an enzyme that contains a bound zinc atom in its active site. In the reaction, NADH supplies the reducing equivalents and is oxidized to NAD+. At neutral pH, the equilibrium of the reaction lies strongly toward ethyl alcohol formation.
The conversion of glucose to ethanol and CO2 is called alcoholic fermentation. The overall reaction is:
Glucose + 2 Pi + 2 ADP + 2 H+ → 2 Ethanol + 2 CO2 + 2 ATP + 2 H2O
And, as for lactic fermentation, even in alcoholic fermentation no net oxidation-reduction occurs.
Alcoholic fermentation is the basis of the production of beer and wine. Notice that the CO2 produced by brewer’s yeast is responsible for the characteristics “bubbles” in beer, champagne and sparkling wine, while that produced by baker’s yeast causes dough to rise.
Fate of pyruvate and NADH under aerobic conditions
In cells with mitochondria and under aerobic conditions, the most common situation in multicellular and many unicellular organisms, the oxidation of NADH and pyruvate catabolism follow distinct pathways.
Pyruvate, in the mitochondrial matrix, is first converted to acetyl-CoA in the reactions catalyzed by the pyruvate dehydrogenase complex, one of the mitochondrial multienzyme complexes. In the reaction, an oxidative decarboxylation, pyruvate loses a carbon atom as CO2, and the remaining two carbon units iare bound to Coenzyme A to form acetyl-coenzyme A or acetyl-CoA.
Pyruvate + NAD+ + CoA → acetyl-CoA + CO2 + NADH + H+
The acetyl group of acetyl-CoA is then completely oxidized to CO2 in the citric acid cycle, with production of NADH and FADH2. The pyruvate dehydrogenase complex therefore represents a bridge between glycolysis, which occurs in the cytosol, and the citric acid cycle, which occurs in the mitochondrial matrix.
In turn, electrons derived from oxidations that occur during glycolysis are transported into mitochondria via the reduction of cytosolic intermediates. In this way, in the cytosol NADH is oxidized to NAD+, while the reduced intermediate, once in the mitochondrial matrix, is reoxidized through the transfer of its reducing equivalents to Complex I of the mitochondrial electron transport chain. Here the electrons flow to oxygen to form H2O, a transfer that supplies the energy needed for the synthesis of ATP through the process of oxidative phosphorylation. Of course, also the electrons carried by NADH formed by pyruvate dehydrogenase complex reactions and citric acid cycle and by FADH2 formed by citric acid cycle meet a similar fate.
Note: FADH2 transfers its reducing equivalents not to Complex I but to Complex II.
Anabolic fates of pyruvate
Under anabolic conditions, the carbon skeleton of pyruvate may have fates other than complete oxidation to CO2 or conversion to lactate. In fact, after its conversion to acetyl-CoA, it may be used, for example, for the synthesis of fatty acids, or of the amino acid alanine.
Glycolysis and ATP production
In the glycolytic pathway the glucose molecule is degraded to two molecules of pyruvate.
During the first phase, the preparatory phase, two ATP are consumed per molecule of glucose in the reactions catalyzed by hexokinase and PFK-1. In the second phase, the payoff phase, 4 ATP are produced through substrate-level phosphorylation in the reactions catalyzed by phosphoglycerate kinase and pyruvate kinase. So there is a net gain of two ATP per molecule of glucose used. In addition, in the reaction catalyzed by glyceraldehyde 3-phosphate dehydrogenase, two molecules of NADH are produced for each glucose molecule.[5]
Energy Changes of Glycolytic Reactions
The overall ΔG°’ of glycolysis is -85 kJ/mol (-20.3 kcal/mol), value resulting from the difference between the ΔG°’ of the conversion of glucose into two pyruvate molecules, -146 kJ/mol (-34,9 kcal/mol), and the ΔG°’ of the formation of ATP from ADP and Pi, 2 x 30.5 kJ/mol = 61 kJ / mol (2 x 7.3 kcal/mol = 14.6 kcal/mol). Here are the two reactions.
Glucose + 2 NAD+ → 2 Pyruvate + 2 NADH + 2 H+
2 ADP + 2 Pi → 2 ATP + 2 H2O
The sum of the two reactions gives the overall equation of glycolysis.
Thus, under standard conditions, the amount of released energy stored within ATP is (61/146) x 100 = 41.8 percent.
Notice that the overall equation of glycolysis can also be derived by considering all the reagents, ATP, NAD+, ADP, and Pi and all the products.
Cancelling the common terms on both sides of the equation, we obtain the overall equation shown above.
ATP production under anaerobic conditions
Under anaerobic conditions, regardless of what is the metabolic fate of pyruvate, conversion to lactate, ethanol or other molecules, there is no additional production of ATP downstream of glycolysis.
Therefore, under these conditions, glycolysis extracts only a small fraction of the chemical energy of the glucose molecule, energy equal to 2840 kJ/mol (679 kcal/mol) released as a result of its conversion to CO2 and H2O. Indeed, only 146 kJ/mol are released in the conversion of a glucose molecule to two pyruvate molecules, equal to 5 percent, [(146/2,840) x 100], of the available chemical energy. Therefore, pyruvate still contains most of the chemical energy of the hexose.
Similarly, the 4 electrons carried by NADH produced in step 6 of glycolysis cannot be used for ATP production.
In lactic acid fermentation, the ΔG°’ associated with the conversion of a glucose molecule to two molecules of lactate is -183.6 kJ/mol (-43.9 kcal/mol), and 33.2 percent of such free energy, [(61/183.6) x 100] is stored within ATP, whereas it is 41.8 percent in the conversion of a glucose molecule to two molecules of pyruvate.
It should be noted that under actual conditions the amount of free energy required for the synthesis of ATP from ADP and Pi is much higher than that required under standard conditions, namely, approximately 50 percent of the energy released is stored within ATP.
ATP production under aerobic conditions
Under aerobic conditions, in cells with mitochondria, the amount of chemical energy that can be extracted from glucose and stored within ATP is much greater than under anaerobic conditions.
If we consider the two NADH produced during glycolysis, the flow of their 4 reducing equivalents along the mitochondrial electron transport chain allows the production of 2-3 ATP per electron pair through oxidative phosphorylation. Therefore, 6 to 8 ATP are produced when one molecule of glucose is converted into two molecules of pyruvate, 2 from glycolysis and 4-6 from oxidative phosphorylation.
Note: The amount of ATP produced from the reducing equivalents of NADH depends upon the mechanism by which they are shuttled into mitochondria.
On the other hand, if we analyze the coordinated and consecutive action of glycolysis, the pyruvate dehydrogenase complex, citric acid cycle, mitochondrial electron transport chain and oxidative phosphorylation, much more energy can be extracted from glucose and stored within ATP. In this case, according to what reported by Lehninger, 30 to 32 ATP are produced for each glucose molecule, although recent estimates suggest a net production equal to 29.85 ATP/glucose, or 29.38 ATP/glucose if also ATP formed from GTP, in turn produced by the citric acid cycle, is exported. Considering both estimates, the production of ATP is about 15 times greater than under anaerobic condition.
Feeder pathways
Other carbohydrates besides glucose, both simple and complex, can be catabolized via glycolysis, after enzymatic conversion to one of the glycolytic intermediates.[2][7]
Among the most important are:
the monosaccharides galactose, fructose, and the less common mannose.
Feeder Pathways for Glycolysis
At the intestinal level, starch and disaccharides encounter the enzymes responsible for carbohydrate digestion. Then, the absorption of monosaccharides released or derived from diet occur. Once in the venous circulation, monosaccharides reach the liver through the portal vein. This organ is the main site where they are metabolized.
Glycogen and starch
Regarding the phosphorolytic breakdown of starch and endogenous glycogen refer to the corresponding articles.
Fructose
Under physiological conditions, the liver removes much of the ingested fructose from the bloodstream before it can reach extrahepatic tissues.
The hepatic pathway for the conversion of the monosaccharide to intermediates of glycolysis consists of several steps.
In the first step fructose is phosphorylated to fructose 1-phosphate at the expense of one ATP. This reaction is catalyzed by fructokinase (EC 2.7.1.4), and requires the presence of Mg2+.
Fructose + ATP → Fructose 1-phosphate + ADP + H+
As for glucose, fructose phosphorylation traps the molecule inside the cell.
In the second step fructose 1-phosphate aldolase catalyzes the hydrolysis, an aldol cleavage, of fructose 1-phosphate to dihydroxyacetone phosphate and glyceraldehyde.
Dihydroxyacetone phosphate is an intermediate of the glycolytic pathway and, after conversion to glyceraldehyde 3-phosphate, may flow through the pathway. Conversely, glyceraldehyde is not an intermediate of the glycolysis, and is phosphorylated to glyceraldehyde 3-phosphate at the expense of one ATP. The reaction is catalyzed by triose kinase (EC 2.7.1.28), and requires the presence of Mg2+.
Glyceraldehyde + ATP → Glyceraldehyde 3-phosphate + ADP + H+
In hepatocytes, therefore, a molecule of fructose is converted to two molecules of glyceraldehyde 3-phosphate, at the expense of two ATP, as for glucose.
In extrahepatic sites, such as skeletal muscle, kidney or adipose tissue, fructokinase is not present, and fructose enters the glycolytic pathway as fructose 6-phosphate. In fact, as previously seen, hexokinase can catalyze the phosphorylation of fructose at C-6.
Fructose + ATP → Fructose 6-phosphate + ADP + H+
However, the affinity of the enzyme for fructose is about 20 times lower than for glucose, so in the hepatocyte, where glucose is much more abundant than fructose, or in the skeletal muscle under anaerobic conditions, that is, when glucose is the preferred fuel, little amounts of fructose 6-phosphate are formed.
Conversely, in adipose tissue, fructose is more abundant than glucose, so that its phosphorylation by hexokinase is not competitively inhibited to a significant extent by glucose. In this tissue, therefore, fructose 6-phosphate synthesis is the entry point into glycolysis for the monosaccharide.
With regard to the metabolic effects of fructose, it is important to underline that in the liver the monosaccharide, being phosphorylated at C-1, enters glycolysis at triose phosphate level, thus downstream to the reaction catalyzed by PFK-1, an enzyme that plays a key role in the regulation of the flow of carbon through this metabolic pathway. Conversely, when fructose is phosphorylated at C-6, it enters the glycolytic pathway upstream of PFK-1.
Sorbitol
Fructose is the entry point into glycolysis for sorbitol, a sugar present in many fruits and vegetables, and used as a sweetener and stabilizer, too. In the liver, sorbitol dehydrogenase (EC 1.1.99.21) catalyzes the oxidation of sorbitol to fructose. The enzyme is also part of the polyol pathway, for the conversion of glucose to fructose.
Sorbitol + NAD+ → Fructose + NADH + H+
The reaction requires the presence of zinc ion, and occurs in the cytosol.
Galactose
Galactose, for the most part derived from intestinal digestion of the lactose, once in the liver is converted, via the Leloir pathway, to glucose 1-phosphate.
The metabolic fate of glucose 1-phosphate depends on the energy status of the cell.
Under conditions promoting glucose storage, glucose 1-phosphate can be channeled to glycogen synthesis. Conversely, under conditions that favor the use of glucose as fuel, glucose 1-phosphate is isomerized to glucose 6-phosphate in the reversible reaction catalyzed by phosphoglucomutase (EC 5.4.2.2).
Glucose 1-phosphate ⇄ Glucose 6-phosphate
In turn, glucose 6-phosphate can be channeled to glycolysis and be used for energy production, or dephosphorylated to glucose in the reaction catalyzed by glucose 6-phosphatase, and then released into the bloodstream.
Mannose
Mannose is present in various dietary polysaccharides, glycolipids and glycoproteins. In the intestine, it is released from these molecules, absorbed, and, once reached the liver, is phosphorylated at C-6 to form mannose 6-phosphate, in the reaction catalyzed by hexokinase.
Mannose + ATP → Mannose 6-phosphate + ADP + H+
The sugar phosphate is then isomerized to fructose 6-phosphate in the reaction catalyzed by mannose 6-phosphate isomerase (EC 5.3.1.8.).
Mannose 6-phosphate ⇄ Fructose 6-phosphate</p
Regulation of glycolysis
The flow of carbon through the glycolytic pathway is regulated in response to metabolic conditions, both inside and outside the cell, essentially to meet two needs: the production of ATP and the supply of precursors for biosynthetic reactions.
And in the liver, to avoid wasting energy, glycolysis and gluconeogenesis are reciprocally regulated so that when one pathway is active, the other slows down. During evolution this was achieved by selecting different enzymes to catalyze the essentially irreversible reactions of the two pathways, whose activity are regulated separately. Indeed, if these reactions proceeded simultaneously at high speed, they would create a futile cycle or substrate cycle.[7] A such fine regulation could not be achieved if a single enzyme operates in both directions.
The control of the glycolysis involves essentially the reactions catalyzed by hexokinase, PFK-1, and pyruvate kinase, whose activity is regulated through:
allosteric modifications, that occur on a timescale of milliseconds and are instantly reversible;
covalent modifications, that is, phosphorylations and dephosphorylations, that occur on a timescale of seconds;
changes in enzyme concentrations, resulting from changes in the rate of their synthesis and/or degradation, that occur on a timescale of hours.
Note: The main regulatory enzymes of gluconeogenesis are pyruvate carboxylase (EC 6.4.1.1) and fructose 1,6-bisphosphatase (EC 3.1.3.11).
Hexokinase
In humans, hexokinase has four tissue specific isozymes, designated as hexokinase I, II, III, and IV, encoded by as many genes.[2][5]
Hexokinase I is the predominant isozyme in the brain, whereas in skeletal muscle hexokinase I and II are present, accounting for 70-75 percent and 25-30 percent of the isozymes, respectively.
Hexokinase IV, also known as glucokinase (EC 2.7.1.2), is mainly present in hepatocytes and beta cells of the pancreas, where it is the predominant isozyme. In the liver it catalyzes, with glucose 6-phosphatase, the substrate cycle between glucose and glucose 6-phosphate. Glucokinase differs from the other hexokinase isozymes in kinetic and regulatory properties.[1]
Note: Isoenzymes or isozymes are different proteins that catalyze the same reaction, and that generally differ in kinetic and regulatory properties, subcellular distribution, or in the cofactors used. They may be present in the same species, in the same tissue or even in the same cell.
Comparison of the kinetic properties of hexokinase isozymes
The kinetic properties of hexokinase I, II, and III are similar.
Hexokinase I and II have a Km for glucose of 0.03 mM and 0.1 mM, respectively. Therefore, these isoenzymes work very efficiently at normal blood glucose levels, 4-5 mM.[7]
Conversely, glucokinase has a high Km for glucose, approximately 10 mM; this means that the enzyme works efficiently only when blood glucose concentration is high, for example after a meal rich in carbohydrates with a high glycemic index.
Regulation of the activity of hexokinases I-III
Hexokinases I-III are allosterically inhibited by glucose 6-phosphate, the product of their reaction. This ensures that glucose 6-phosphate does not accumulate in the cytosol when glucose is not needed for energy, for glycogen synthesis, for the pentose phosphate pathway, or as a source of precursors for biosynthetic pathways, leaving, at the same time, the monosaccharide in the blood, available for other organs and tissues. For example, when PFK-1 is inhibited, fructose 6-phosphate accumulates and then, due to phosphoglucose isomerase reaction, glucose 6-phosphate accumulates. Therefore, inhibition of PFK-1 leads to inhibition of hexokinases I-III.
In skeletal muscle, the activity of hexokinase I and II is coordinated with that of GLUT4, a low Km glucose transporter (5mM), whose translocation to the plasma membrane is induced by both insulin and physical activity. The combined action of GLUT4 on plasma membrane and hexokinase in the cytosol maintains a balance between glucose uptake and its phosphorylation. Because blood glucose concentration is between 4 and 5 mmol/L, its entry into the myocyte through GLUT4 may cause an increase in its concentration sufficient to saturate, or near saturate the enzyme, which therefore operates at or near its Vmax.
Regulation of the activity of hepatic glucokinase
Glucokinase differs in three respects from hexokinases I-III, and is particularly suitable for the role that the liver plays in the regulation of blood glucose levels.[1] Why?
As previously said, glucokinase has a Km for glucose of about 10 mM, much higher than the Km for glucose of hexokinases I-III, and higher than the value of fasting blood glucose levels (4-5 mM) as well. In the liver, where it is the predominant hexokinase isoenzyme, its role is to provide glucose 6-phosphate for the synthesis of glycogen and fatty acids. The activity of glucokinase is linked to that of GLUT2, the major glucose transporter in hepatocytes, with a high Km for glucose, approximately 10 mM. Hence, GLUT2 is very active when blood glucose concentration is high, rapidly equilibrating sugar concentrations in cytosol of hepatocytes and blood. Under such conditions glucokinase is active and converts glucose to glucose 6-phosphate, and, due to high Km for glucose, its activity continues to increase even when the intracellular concentration of the monosaccharide reaches or exceeds 10 mM. Therefore, the rate at which glucose uptake and phosphorylation occurs are determined by the value of blood glucose level itself. On the other hand, when glucose availability is low, its concentration in the cytosol of hepatocytes is just as low, much lower than the Km for glucose of glucokinase, so that glucose produced through gluconeogenesis and/or glycogenolysis is not phosphorylated and can leave the cell.
A similar situation also occurs in pancreatic beta cells, where the GLUT2/glucokinase system causes the intracellular G-6-P concentration to equalize with glucose concentration in the blood, allowing the cells to detect and respond to hyperglycemia.
Unlike hexokinases I-III, glucokinase is not inhibited by glucose 6-phosphate, that is, is not product inhibited, and catalyzes its synthesis even when it accumulates.
Glucokinase is inhibited by the reversible binding of glucokinase regulatory protein or GKRP, a liver-specific regulatory protein.[4] The mechanism of inhibition by GKRP occurs via the anchorage of glucokinase inside the nucleus, where it is separated from the other glycolytic enzymes.
Regulation of Glucokinase Activity
The binding between glucokinase and GKRP is much tighter in the presence of fructose 6-phosphate, whereas it is weakened by glucose and fructose 1-phosphate.
In the absence of glucose, glucokinase is in its super-opened conformation that has low activity. The rise in cytosolic glucose concentration causes a concentration dependent transition of glucokinase to its close conformation, namely, its active conformation that is not accessible for glucokinase regulatory protein. Hence, glucokinase is active and no longer inhibited.
Notice that fructose 1-phosphate is present in the hepatocyte only when fructose is metabolized. Hence, fructose relieves the inhibition of glucokinase by glucokinase regulatory protein. Example
After a meal rich in carbohydrates, blood glucose levels rise, glucose enters the hepatocyte through GLUT2, and then moves inside the nucleus through the nuclear pores. In the nucleus glucose determines the transition of glucokinase to its close conformation, active and not accessible to GKRP, allowing glucokinase to diffuse in the cytosol where it phosphorylates glucose.
Conversely, when glucose concentration declines, such as during fasting when blood glucose levels may drop below 4 mM, glucose concentration in hepatocytes is low, and fructose 6-phosphate binds to GKRP allowing it to bind tighter to glucokinase. This results in a strong inhibition of the enzyme. This mechanism ensures that the liver, at low blood glucose levels, does not compete with other organs, primarily the brain, for glucose.
In the cell, fructose 6-phosphate is in equilibrium with glucose 6-phosphate, due to phosphoglucose isomerase reaction. Through its association with GKRP, fructose 6-phosphate allows the cell to decrease glucokinase activity, so preventing the accumulation of intermediates.
To sum up, when blood glucose levels are normal, glucose is phosphorylated mainly by hexokinases I-III, whereas when blood glucose levels are high glucose can be phosphorylated by glucokinase as well.
Regulation of phosphofructokinase 1 activity
Phosphofructokinase 1 is the key control point of carbon flow through the glycolysis.
The enzyme, in addition to substrate binding sites, has several binding sites for allosteric effectors.
ATP, citrate, and hydrogen ions are allosteric inhibitors of the enzyme, whereas AMP, Pi and fructose 2,6-bisphosphate are allosteric activators.[8][9]
Regulation of PFK 1 and Fructose 1,6-bisphosphatase
It should be noted that ATP, an end product of glycolysis, is also a substrate of phosphofructokinase 1. Indeed, the enzyme has two binding sites for the nucleotide: a low-affinity regulatory site, and a high affinity substrate site.
What do allosteric effectors signal?
ATP, AMP and Pi signal the energy status of the cell.
The activity of PFK-1 increases when the energy charge of the cell is low, namely, when there is a need for ATP, whereas it decreases when the energy charge of the cell is high, namely when ATP concentration in the cell is high. How?
When the nucleotide is produced faster than it is consumed, its cellular concentration is high. Under such condition ATP, binding to its allosteric site, inhibits PFK-1 by reducing the affinity of the enzyme for fructose 6-phosphate. From the kinetic point of view, the increase in ATP concentration modifies the relationship between enzyme activity and substrate concentration, chancing the hyperbolic fructose 6-phosphate velocity curve into a sigmoidal one, and then, increasing Km for the substrate. However, under most cellular conditions, ATP concentration does not vary much. For example, during a vigorous exercise ATP concentration in muscle may lower of about 10 percent compared to the resting state, whereas glycolysis rate varies much more than would be expected by such reduction.
When ATP consumption exceeds its production, ADP and AMP concentrations rise, in particular that of AMP, due to the reaction catalyzed by adenylate kinase (EC 2.7.4.3), that form ATP from ADP.
ADP + ADP ⇄ ATP + AMP
The equilibrium constant, Keq, of the reaction is:
Keq = [ATP][AMP]/[ADP]2= 0.44
Under normal conditions, ADP and AMP concentrations are about 10 percent and often less than 1 percent of ATP concentration, respectively. Therefore, considering that the total adenylate pool is constant over the short term, even a small reduction in ATP concentration leads, due to adenylate kinase activity, to a much larger relative increase in AMP concentration. In turn, AMP acts by reversing the inhibition due to ATP.
Therefore, the activity of phosphofructokinase 1 depends on the cellular energy status:
when ATP is plentiful, enzyme activity decreases;
when AMP levels increase and ATP levels fall, enzyme activity increases.
Why isn’t ADP a positive effector of PFK-1? There are two reasons.
When the energy charge of the cell falls, ADP is used to regenerate ATP, in the reaction catalyzed by adenylate kinase Moreover, as previously said, a small reduction in ATP levels leads to larger-percentage changes in ADP levels and, above all, in AMP levels.
Hydrogen ions inhibit PFK-1. Such inhibition prevents, by controlling the rate of glycolysis, excessive lactate buildup and the consequent fall of blood pH.
Citrate is an allosteric inhibitor of PFK-1 that acts by enhancing the inhibitory effect of ATP.
It is the product of the first step of the citric acid cycle, a metabolic pathway that provides building blocks for biosynthetic pathways and directs electrons into mitochondrial electron transport chain for ATP synthesis via oxidative phosphorylation. High citrate levels in the cytosol mean that, in the mitochondria, an overproduction of building blocks is occurring and the current energy are met, namely, the citric acid cycle has reached saturation. Under such conditions glycolysis, that feeds the cycle under aerobic condition, can slow down, sparing glucose.
So, it should be noted that PFK-1 couples glycolysis and the citric acid cycle.
In the liver, the central control point of glycolysis and gluconeogenesis is the substrate cycle between F-6-P and F-1,6-BP, catalyzed by PFK-1 and fructose 1,6-bisphosphatase.
The liver plays a pivotal role in maintaining blood glucose levels within the normal range.
When blood glucose levels drop, glucagon stimulates hepatic glucose synthesis, via both glycogenolysis and gluconeogenesis, and at the same time signals the liver to stop consuming glucose to meet its needs.
Conversely, when blood glucose levels are high, insulin causes the liver to use glucose for energy, and to synthesize glycogen, and triglycerides.
In this context, the regulation of glycolysis and gluconeogenesis is mediated by fructose 2,6-bisphosphate, a molecule that allows the liver to play a major role in regulating blood glucose levels, and whose levels are controlled by insulin and glucagon.
As a result of binding to its allosteric site on PFK-1, fructose 2,6-bisphosphate increases the affinity of the enzyme for fructose 6-phosphate, its substrate, while decreases its affinity for the allosteric inhibitors citrate and ATP. It is remarkable to note that under physiological concentrations of the substrates and positive and negative allosteric effectors, phosphofructokinase 1 would be virtually inactive in the absence of fructose 2,6-bisphosphate.
On the other hand, the binding of fructose 2,6-bisphosphate to fructose 1,6-bisphosphatase inhibits the enzyme, even in the absence of AMP, another allosteric inhibitor of the enzyme.
Due to these effects, fructose 2,6-bisphosphate increases the net flow of glucose through glycolysis.
Another metabolite involved in the control of the flow of carbon through glycolysis and gluconeogenesis is xylulose 5-phosphate,[3] a product of the pentose phosphate pathway, whose concentration in hepatocytes rises after ingestion of a carbohydrate-rich meal. The molecule, by activating protein phosphatase 2A, finally leads to an increase in the concentration of fructose 2,6-bisphosphate, and then to an increase in the flow of carbon through glycolysis and to a reduction in the flow of carbon through gluconeogenesis.
Regulation of pyruvate kinase activity
A further control point of carbon flow through glycolysis and gluconeogenesis is the substrate cycle between phosphoenolpyruvate and pyruvate, catalyzed by pyruvate kinase for glycolysis, and by the combined action of pyruvate carboxylase and phosphoenolpyruvate carboxykinase (EC 4.1.1.32) for gluconeogenesis.[5][7]
All isozymes of pyruvate kinase are allosterically inhibited by high concentrations of ATP, long-chain fatty acids, and acetyl-CoA, all signs that the cell is in an optimal energy status. Alanine, too, that can be synthesized from pyruvate through a transamination reaction, is an allosteric inhibitor of pyruvate kinase; its accumulation signals that building blocks for biosynthetic pathways are abundant.
Regulation of Pyruvate Kinase Activity
Conversely, pyruvate kinase is allosterically activated by fructose 1,6-bisphosphate, the product of the first committed step of glycolysis. Therefore, F-1,6-BP allows pyruvate kinase to keep pace with the flow of intermediates. It should be underlined that, at physiological concentration of PEP, ATP and alanine, the enzyme would be completely inhibited without the stimulating effect of F-1,6-BP.
The hepatic isoenzyme, but not the muscle isoenzyme, is also subject to regulation through phosphorylation by:
protein kinase A or PKA, activated by the binding of glucagon to the specific receptor or epinephrine to β-adrenergic receptors;
calcium/calmodulin dependent protein kinase or CAMK, activated by the binding of epinephrine to α1-adrenergic receptors.
Phosphorylation of the enzyme decreases its activity, by increasing the Km for phosphoenolpyruvate, and slows down glycolysis.
For example, when the blood glucose levels are low, glucagon-induced phosphorylation decreases pyruvate kinase activity. The phosphorylated enzyme is also less readily stimulated by fructose 1,6-bisphosphate but more readily inhibited by alanine and ATP. Conversely, the dephosphorylated form of pyruvate kinase is more sensitive to fructose 1,6-bisphosphate, and less sensitive to ATP and alanine. In this way, when blood glucose levels are low, the use of glucose for energy in the liver slows down, and the sugar is available for other tissues and organs, such as the brain. However, it should be noted that pyruvate kinase does not undergo glucagon-induced phosphorylation in the presence of fructose 1,6-bisphosphate.
An increase in the insulin/glucagon ratio, on the other hand, leads to dephosphorylation of the enzyme and then to its activation. The dephosphorylated enzyme is more readily stimulated by its allosteric activators F-1,6-BP, and less readily inhibited by allosteric inhibitors alanine and ATP.
References
ab de la Iglesia N., Mukhtar M., Seoane J., Guinovart J.J., & Agius L. The role of the regulatory protein of glucokinase in the glucose sensory mechanism of the hepatocyte. J Biol Chem OK 2000;275(14):10597-10603. doi: 10.1074/jbc.275.14.10597
^ Kabashima T., Kawaguchi T., Wadzinski B.E., Uyeda K. Xylulose 5-phosphate mediates glucose-induced lipogenesis by xylulose 5-phosphate-activated protein phosphatase in rat liver. Proc Natl Acad Sci USA 2003;100:5107-5112. doi:10.1073/pnas.0730817100
^ Kaminski M.T., Schultz J., Waterstradt R., Tiedge M., Lenzen S., Baltrusch S. Glucose-induced dissociation of glucokinase from its regulatory protein in the nucleus of hepatocytes prior to nuclear export. BBA – Molecular Cell Research 2014;1843(3):554-564. doi:10.1016/j.bbamcr.2013.12.002
^ abcdefghi Nelson D.L., M. M. Cox M.M. Lehninger. Principles of biochemistry. 6th Edition. W.H. Freeman and Company, 2012
^ Oslund R.C., Su X., Haugbro M., Kee J-M., Esposito M., David Y., Wang B., Ge E., Perlman D.H., Kang Y., Muir T.W., & Rabinowitz J.D. Bisphosphoglycerate mutase controls serine pathway flux via 3-phosphoglycerate. Nat Chem Biol 2017;13:1081-1087. doi:10.1038/nchembio.2453
^ abcdefg Stipanuk M.H., Caudill M.A. Biochemical, physiological, and molecular aspects of human nutrition. 3rd Edition. Elsevier health sciences, 2012
^ Van Schaftingen E., and Hers H-G. Inhibition of fructose-1,6-bisphosphatase by fructose-2,6-bisphosphate. Proc Natl Acad Sci USA 1981;78(5):2861-2863. doi:10.1073/pnas.78.5.2861
^ Van Schaftingen E., Jett M-F., Hue L., and Hers H-G. Control of liver 6-phosphofructokinase by fructose 2,6-bisphosphate and other effectors. Proc Natl Acad Sci USA 1981;78(6):3483-3486. doi:10.1073/pnas.78.6.3483
Gluconeogenesis is a metabolic pathway that leads to the synthesis of glucose from pyruvate and other non-carbohydrate precursors, even in non-photosynthetic organisms.[1][6]
It occurs in all microorganisms, fungi, plants and animals, and the reactions are essentially the same, leading to the synthesis of one glucose molecule from two pyruvate molecules. Therefore, it is in essence glycolysis in reverse, which instead goes from glucose to pyruvate, and shares seven enzymes with it.[5]
Gluconeogenesis and Glycolysis Pathways
Glycogenolysis is quite distinct from gluconeogenesis: it does not lead to de novo production of glucose from non-carbohydrate precursors, as shown by its overall reaction:
Glycogen or (glucose)n → n glucose molecules
The following discussion will focus on gluconeogenesis that occurs in higher animals, and in particular in the liver of mammals.
Maintaining blood glucose within the normal range, 3.3 to 5.5 mmol/L (60 and 99 mg/dL), is essential because many cells and tissues depend, largely or entirely, on glucose to meet their ATP demands; examples are red blood cells, neurons, skeletal muscle working under low oxygen conditions, the medulla of the kidney, the testes, the lens and the cornea of the eye, and embryonic tissues. For example, glucose requirement of the brain is about 120 g/die that is equal to:
over 50 percent of the total body stores of the monosaccharide, about 210 g, of which 190 g are stored as liver and muscle glycogen, and 20 g are found in free form in body fluids;
about 75 percent of the daily glucose requirement, about 160 g.[1]
During fasting, as in between meals or overnight, the blood glucose levels are maintained within the normal range due to hepatic glycogenolysis, and to the release of fatty acids from adipose tissue and ketone bodies by the liver. Fatty acids and ketone bodies are preferably used by skeletal muscle, thus sparing glucose for cells and tissues that depend on it, primarily red blood cells and neurons. However, after about 18 hours of fasting or during intense and prolonged exercise, glycogen stores are depleted and may become insufficient. At that point, if no carbohydrates are ingested, gluconeogenesis becomes important.
And, the importance of gluconeogenesis is further emphasized by the fact that if the blood glucose levels fall below 2 mmol/L, unconsciousness occurs.
The excretion of pyruvate would lead to the loss of the ability to produce ATP through aerobic respiration, i.e. more than 10 molecules of ATP for each molecule of pyruvate oxidized.
Where does it occur?
In higher animals, gluconeogenesis occurs in the liver, kidney cortex and epithelial cells of the small intestine, that is, the enterocytes.[5]
Quantitatively, the liver is the major site of gluconeogenesis, accounting for about 90 percent of the synthesized glucose, followed by kidney cortex, with about 10 percent.[1] The key role of the liver is due to its size; in fact, on a wet weight basis, the kidney cortex produces more glucose than the liver.
In the kidney cortex, gluconeogenesis occurs in the cells of the proximal tubule, the part of the nephron immediately following the glomerulus. Much of the glucose produced in the kidney is used by the renal medulla, while the role of the kidney in maintaining blood glucose levels becomes more important during prolonged fasting and liver failure. It should, however, be emphasized that the kidney has no significant glycogen stores, unlike the liver, and contributes to maintaining blood glucose homeostasis only through gluconeogenesis and not through glycogenolysis.
Part of the gluconeogenesis pathway also occurs in the skeletal muscle, cardiac muscle, and brain, although at very low rate.
In adults, muscle is about 18 the weight of the liver; therefore, its de novo synthesis of glucose might have quantitative importance. However, the release of glucose into the circulation does not occur because these tissues, unlike liver, kidney cortex, and enterocytes, lack glucose 6-phosphatase (EC 3.1.3.9), the enzyme that catalyzes the last step of gluconeogenesis.[6] Therefore, the production of glucose 6-phosphate, including that from glycogenolysis, does not contribute to the maintenance of blood glucose levels, and only helps to restore glycogen stores, in the brain small and limited mostly to astrocytes. For these tissues, in particular for skeletal muscle due to its large mass, the contribution to blood glucose homeostasis results only from the small amount of glucose released in the reaction catalyzed by enzyme debranching (EC 3.2.1.33) of glycogenolysis.
With regard to the cellular localization, most of the reactions occur in the cytosol, some in the mitochondria, and the final step) within the endoplasmic reticulum cisternae.
Irreversible steps
As previously said, gluconeogenesis is in essence glycolysis in reverse. And, of the ten reactions that constitute gluconeogenesis, seven are shared with glycolysis; these reactions have a ΔG close to zero, therefore easily reversible. However, under intracellular conditions, the overall ΔG of glycolysis is about -63 kJ/mol (-15 kcal/mol) and of gluconeogenesis about -16 kJ/mol (-3.83 kcal/mol), namely, both the pathways are irreversible.[5]
The irreversibility of the glycolytic pathway is due to three strongly exergonic reactions, that cannot be used in gluconeogenesis, and listed below.
The phosphorylation of glucose to glucose 6-phosphate, catalyzed by hexokinase (EC 2.7.1.1) or glucokinase (EC 2.7.1.2).
ΔG = -33.4 kJ/mol (-8 kcal/mol)
ΔG°’ = -16.7 kJ/mol (-4 kcal/mol)
The phosphorylation of fructose 6-phosphate to fructose 1,6-bisphosphate, catalyzed by phosphofructokinase-1 or PFK-1 (EC 2.7.1.11)
ΔG = -22.2 kJ/mol (-5.3 kcal/mol)
ΔG°’ = -14.2 kJ/mol (-3.4 kcal/mol)
The conversion of phosphoenolpyruvate or PEP to pyruvate, catalyzed by pyruvate kinase (EC 2.7.1.40)
ΔG = -16.7 kJ/mol (-4.0 kcal/mol)
ΔG°’ = -31.4 kJ/mole (-7.5 kcal/mol)
In gluconeogenesis, these three steps are bypassed by enzymes that catalyze irreversible steps in the direction of glucose synthesis.[6] This ensures the irreversibility of the metabolic pathway.
Below, such reactions are analyzed.
From pyruvate to phosphoenolpyruvate
The first step of gluconeogenesis that bypasses an irreversible step of glycolysis, namely the reaction catalyzed by pyruvate kinase, is the conversion of pyruvate to phosphoenolpyruvate.[8]
Phosphoenolpyruvate is synthesized through two reactions catalyzed, in order, by the enzymes:
pyruvate carboxylase (EC 6.4.1.1);
phosphoenolpyruvate carboxykinase or PEP carboxykinase (EC 4.1.1.32).
Pyruvate → Oxaloacetate → Phosphoenolpyruvate
Pyruvate carboxylase catalyzes the carboxylation of pyruvate to oxaloacetate, with the consumption of one ATP. The enzyme requires the presence of magnesium or manganese ions
Pyruvate + HCO3–+ ATP → Oxaloacetate + ADP + Pi
The enzyme, discovered in 1960 by Merton Utter, is a mitochondrial protein composed of four identical subunits, each with catalytic activity. The subunits contain a biotin prosthetic group, covalently linked by amide bond to the ε-amino group of a lysine residue, that acts as a carrier of activated CO2 during the reaction. An allosteric binding site for acetyl-CoA is also present in each subunit.
It should be noted that the reaction catalyzed by pyruvate carboxylase, leading to the production of oxaloacetate, also provides intermediates for the citric acid cycle or Krebs cycle.
Phosphoenolpyruvate carboxykinase is present, approximately in the same amount, in mitochondria and cytosol of hepatocytes. The isoenzymes are encoded by separate nuclear genes.
The enzyme catalyzes the decarboxylation and phosphorylation of oxaloacetate to phosphoenolpyruvate, in a reaction in which GTP acts as a donor of high-energy phosphate. PEP carboxykinase requires the presence of both magnesium and manganese ions. The reaction is reversible under normal cellular conditions.
Oxaloacetate + GTP ⇄ PEP + CO2 + GDP
During this reaction, a CO2 molecule, the same molecule that is added to pyruvate in the reaction catalyzed by pyruvate carboxylase, is removed. Carboxylation-decarboxylation sequence is used to activate pyruvate, since decarboxylation of oxaloacetate facilitates, makes thermodynamically feasible, the formation of phosphoenolpyruvate.
More generally, carboxylation-decarboxylation sequence promotes reactions that would otherwise be strongly endergonic, and also occurs in the citric acid cycle, in the pentose phosphate pathway, also called the hexose monophosphate pathway, and in the synthesis of fatty acids.
The levels of PEP carboxykinase before birth are very low, while its activity increases several fold a few hours after delivery. This is the reason why gluconeogenesis is activated after birth.
The sum of the reactions catalyzed by pyruvate carboxylase and phosphoenolpyruvate carboxykinase is:
Pyruvate + ATP + GTP + HCO3– → PEP + ADP + GDP + Pi + CO2
ΔG°’ of the reaction is equal to 0.9 kJ/mol (0.2 kcal/mol), while standard free energy change associated with the formation of pyruvate from phosphoenolpyruvate by reversal of the pyruvate kinase reaction is + 31.4 kJ/mol (7.5 kcal/mol).
Although the ΔG°’ of the two steps leading to the formation of PEP from pyruvate is slightly positive, the actual free-energy change (ΔG), calculated from intracellular concentrations of the intermediates, is very negative, -25 kJ/mol (-6 kcal/mol). This is due to the fast consumption of phosphoenolpyruvate in other reactions, that maintains its concentration at very low levels. Therefore, under cellular conditions, the synthesis of PEP from pyruvate is irreversible.[5]
It is noteworthy that the metabolic pathway for the formation of phosphoenolpyruvate from pyruvate depends on the precursor: pyruvate or alanine, or lactate.
Phosphoenolpyruvate precursors: pyruvate or alanine
The bypass reactions described below predominate when alanine or pyruvate is the glucogenic precursor.
Pyruvate carboxylase is a mitochondrial enzyme, therefore pyruvate must be transported from the cytosol into the mitochondrial matrix. This is mediated by transporters located in the inner mitochondrial membrane, referred to as MPC1 and MPC2. These proteins, associating, form a hetero-oligomer that facilitates pyruvate transport.[4]
Pyruvate can also be produced from alanine in the mitochondrial matrix by transamination, in the reaction catalyzed by alanine aminotransferase (EC 2.6.1.2), while the amino group is then converted into urea through the urea cycle.
Conversion of Pyruvate and Alanine to Phosphoenolpyruvate
Since the enzymes involved in the later steps of gluconeogenesis, except glucose-6-phosphatase, are cytosolic, the oxaloacetate produced in the mitochondrial matrix is transported into the cytosol. However, there are no oxaloacetate transporters in the inner mitochondrial membrane. The transfer to the cytosol occurs as a result of its reduction to malate, that, on the contrary, can cross the inner mitochondrial membrane. The reaction is catalyzed by mitochondrial malate dehydrogenase (EC 1.1.1.37), an enzyme also involved in the citric acid cycle, where the reaction proceeds in the reverse direction. In the reaction NADH is oxidized to NAD+.
Oxaloacetate + NADH + H+ ⇄ Malate + NAD+
Although ΔG°’ of the reaction is highly positive, under physiological conditions, ΔG is close to zero, and the reaction is easily reversible.
Malate crosses the inner mitochondrial membrane through a component of the malate-aspartate shuttle, the malate-α-ketoglutarate transporter. Once in the cytosol, the malate is re-oxidized to oxaloacetate in the reaction catalyzed by cytosolic malate dehydrogenase. In this reaction NAD+ is reduced to NADH.
Malate + NAD+ → Oxaloacetate + NADH + H+
Note: Malate-aspartate shuttle is the most active shuttle for the transport of NADH-reducing equivalents from the cytosol into the mitochondria. It is found in mitochondria of liver, kidney, and heart.
The reaction enables the transport into the cytosol of mitochondrial reducing equivalents in the form of NADH.[8] This transfer is needed for gluconeogenesis to proceed, as in the cytosolic the NADH, oxidized in the reaction catalyzed by glyceraldehydes 3-phosphate dehydrogenase (EC 1.2.1.12), is present in very low concentration, with a [NADH]/[NAD+] ratio equal to 8×10⁻⁴, about 100,000 times lower than that observed in the mitochondria.[5]
Finally, the oxaloacetate is converted to phosphoenolpyruvate in the reaction catalyzed by PEP carboxykinase.
Phosphoenolpyruvate precursor: lactate
Lactate is one of the major gluconeogenic precursors. It is produced for example by:
red blood cells, that are completely dependent on anaerobic glycolysis for ATP production;
skeletal muscle during intense exercise, that is, under low oxygen condition, when the rate of glycolysis exceeds the rate of the citric acid cycle and oxidative phosphorylation.[5]
When lactate is the gluconeogenic precursor, PEP synthesis occurs through a different pathway than that previously seen. In the hepatocyte cytosol NAD+ concentration is high and the lactate is oxidized to pyruvate in the reaction catalyzed by the liver isoenzyme of lactate dehydrogenase (EC 1.1.1.27). In the reaction NAD+ is reduced to NADH.
Lactate + NAD+ → Pyruvate + NADH + H+
The production of cytosolic NADH makes unnecessary the export of reducing equivalents from the mitochondria.
Pyruvate enters the mitochondrial matrix to be converted to oxaloacetate in the reaction catalyzed by pyruvate carboxylase. In the mitochondria, oxaloacetate is converted to phosphoenolpyruvate in the reaction catalyzed by mitochondrial pyruvate carboxylase. Phosphoenolpyruvate exits the mitochondria through an anion transporter located in the inner mitochondrial membrane, and, once in the cytosol, continues in the gluconeogenesis pathway.
Note: the synthesis of glucose from lactate may be considered as the part of the Cori cycle that takes place in the liver.
From fructose 1,6-bisphosphate to fructose 6-phosphate
The second step of gluconeogenesis that bypasses an irreversible step of the glycolytic pathway, namely the reaction catalyzed by PFK-1, is the dephosphorylation of fructose 1,6-bisphosphate to fructose 6-phosphate.
This reaction, catalyzed by fructose 1,6-bisphosphatase or FBPasi-1 (EC 3.1.3.11), a Mg2+ dependent enzyme located in the cytosol, leads to the hydrolysis of the C-1 phosphate of fructose 1,6-bisphosphate, without production of ATP.
Fructose 1,6-bisphosphate + H2O → Fructose 6-phosphate + Pi
The ΔG°’ of the reaction is -16.3 kJ/mol (-3.9 kcal/mol), therefore an irreversible reaction.
From glucose 6-phosphate to glucose
The third step of gluconeogenesis that bypasses an irreversible step of the glycolytic pathway, namely the reaction catalyzed by hexokinase or glucokinase, is the dephosphorylation of glucose 6-phosphate to glucose.
This reaction is catalyzed by the catalytic subunit of glucose 6-phosphatase, a protein complex located in the membrane of the endoplasmic reticulum of hepatocytes, enterocytes and cells of the proximal tubule of the kidney.[8] Glucose 6-phosphatase complex is composed of a glucose 6-phosphatase catalytic subunit and a glucose 6-phosphate transporter called glucose 6-phosphate translocase or T1.
Glucose 6-phosphatase catalytic subunit has the active site on the luminal side of the organelle. This means that the enzyme catalyzes the release of glucose not in the cytosol but in the lumen of the endoplasmic reticulum.
Glucose 6-phosphate, both resulting from gluconeogenesis, produced in the reaction catalyzed by glucose 6-phosphate isomerase or phosphoglucose isomerase (EC 5.3.1.9), and glycogenolysis, produced in the reaction catalyzed by phosphoglucomutase (EC 5.4.2.2), is located in the cytosol, and must enter the lumen of the endoplasmic reticulum to be dephosphorylated. Its transport is mediated by glucose-6-phosphate translocase.
The catalytic subunit of glucose 6-phosphatase, a Mg2+-dependent enzyme, catalyzes the last step of both gluconeogenesis and glycogenolysis. And, like the reaction catalyzed by fructose 1,6-bisphosphatase, this reaction leads to the hydrolysis of a phosphate ester.
Glucose 6-phosphate + H2O → Glucose + Pi
It should also be underlined that, due to orientation of the active site, the cell separates this enzymatic activity from the cytosol, thus avoiding that glycolysis, that occurs in the cytosol, is aborted by enzyme action on glucose 6-phosphate.
The ΔG°’ of the reaction is -13.8 kJ/mol (-3.3 kcal/mol), therefore it is an irreversible reaction. If instead the reaction were that catalyzed by hexokinase/glucokinase in reverse, it would require the transfer of a phosphate group from glucose 6-phosphate to ADP. Such a reaction would have a ΔG equal to +33.4 kJ/mol (+8 kcal/mol), and then strongly endergonic. Similar considerations can be made for the reaction catalyzed by FBPase-1.
Glucose and Pi group seem to be transported into the cytosol via different transporters, referred to as T2 and T3, the last one an anion transporter.
Finally, glucose leaves the hepatocyte via the membrane transporter GLUT2, enters the bloodstream and is transported to tissues that require it. Conversely, under physiological conditions, as previously said, glucose produced by the kidney is mainly used by the medulla of the kidney itself.
Gluconeogenesis: energetically expensive
Like glycolysis, much of the energy consumed is used in the irreversible steps of the process.[5]
Six high-energy phosphate bonds are consumed: two from GTP and four from ATP. Furthermore, two molecules of NADH are required for the reduction of two molecules of 1,3-bisphosphoglycerate in the reaction catalyzed by glyceraldehyde 3-phosphate dehydrogenase. The oxidation of NADH causes the lack of production of 5 molecules of ATP that are synthesized when the electrons of the reduced coenzyme are used in oxidative phosphorylation.
Also these energetic considerations show that gluconeogenesis is not simply glycolysis in reverse, in which case it would require the consumption of two molecules of ATP, as shown by the overall glycolytic equation.
At least in the liver, ATP needed for gluconeogenesis derives mostly from the oxidation of fatty acids or of the carbon skeletons of the amino acids, depending on the available “fuel”.
Coordinated regulation of gluconeogenesis and glycolysis
If glycolysis and gluconeogenesis were active simultaneously at a high rate in the same cell, the only products would be ATP consumption and heat production, in particular at the irreversible steps of the two pathways, and nothing more.
For example, considering PFK-1 and FBPasi-1:
ATP + Fructose 6-phosphate → ADP + Fructose 1,6-bisphosphate
Fructose 1,6-bisphosphate + H2O → Fructose 6-phosphate + Pi
The sum of the two reactions is:
ATP + H2O → ADP + Pi + Heat
Two reactions that run simultaneously in opposite directions result in a futile cycle or substrate cycle.
The modulation of the activity of involved enzymes occurs through:
allosterical mechanisms;
covalent modifications, such as phosphorylation and dephosphorylation;
changes in the concentration of the involved enzymes, due to changes in their synthesis/degradation ratio.
Allosteric mechanisms are very rapid and instantly reversible, taking place in milliseconds. The others, triggered by signals from outside the cell, such as hormones, like insulin, glucagon, or epinephrine, take place on a time scale of seconds or minutes, and, for changes in enzyme concentration, hours.
This allows a coordinated regulation of the two pathways, ensuring that when pyruvate enters gluconeogenesis, the flux of glucose through the glycolytic pathway slows down, and vice versa.
Regulation of gluconeogenesis
The regulation of gluconeogenesis and glycolysis involves the enzymes unique to each pathway, and not the common ones.[1]
While the major control points of glycolysis are the reactions catalyzed by PFK-1 and pyruvate kinase, the major control points of gluconeogenesis are the reactions catalyzed by fructose 1,6-bisphosphatase and pyruvate carboxylase.
The other two enzymes unique to gluconeogenesis, glucose-6-phosphatase and PEP carboxykinase, are regulated at transcriptional level.
Pyruvate carboxylase
In the mitochondrion, pyruvate can be converted to:
acetyl-CoA, in the reactions catalyzed by pyruvate dehydrogenase complex, reaction that connects glycolysis to the Krebs cycle;
oxaloacetate, in the reaction catalyzed by pyruvate carboxylase, to continue in the gluconeogenesis pathway.
The metabolic fate of pyruvate depends on the availability of acetyl-CoA, that is, by the availability of fatty acids in the mitochondrion.
When fatty acids are available, their beta-oxidation leads to the production of acetyl-CoA, that enters the Krebs cycle and leads to the production of GTP and NADH. When the energy needs of the cell are met, oxidative phosphorylation slows down, the [NADH]/[NAD+] ratio increases, NADH inhibits the citric acid cycle, and acetyl-CoA accumulates in the mitochondrial matrix.[1][5]
Acetyl-CoA is a positive allosteric effector of pyruvate carboxylase, and a negative allosteric effector of pyruvate kinase. Moreover, it inhibits pyruvate dehydrogenase complex both through feedback inhibition and phosphorylation through the activation of a specific kinase.
Fates for Pyruvate
This means that when the energy charge of the cell is high, the formation of acetyl-CoA from pyruvate slows down, while the conversion of pyruvate to glucose is stimulated. Therefore acetyl-CoA is a molecule that signals that additional glucose oxidation for energy is not required and that glucogenic precursors can be used for the synthesis and storage of glucose.
Conversely, when acetyl-CoA levels decrease, the activity of pyruvate kinase and of the pyruvate dehydrogenase complex increases, and therefore also the flow of metabolites through the citric acid cycle. This supplies energy to the cell.
Summarizing, when the energy charge of the cell is high pyruvate carboxylase is active, and that the first control point of gluconeogenesis determines what will be the fate of pyruvate in the mitochondria.
Fructose 1,6-bisphosphatase
The second major control point in gluconeogenesis is the reaction catalyzed by fructose 1,6-bisphosphatase. The enzyme is allosterically inhibited by AMP. Therefore, when AMP levels are high, and consequently ATP levels are low, gluconeogenesis slows down. This means that, as previously seen, FBPase-1 is active when the energy charge of the cell is sufficiently high to support de novo synthesis of glucose.
Conversely, PFK-1, the corresponding glycolytic enzyme, is allosterically activated by AMP and ADP and allosterically inhibited by ATP and citrate, the latter resulting from the condensation of acetyl-CoA and oxaloacetate. Therefore:
when AMP levels are high, gluconeogenesis slows down, and glycolysis accelerates;
when ATP levels are high or when acetyl-CoA or citrate are present in adequate concentrations, gluconeogenesis is promoted, while glycolysis slows down.
The increase in citrate levels indicates that the activity of the citric acid cycle can slow down; in this way, pyruvate can be used in glucose synthesis.
PFK-1, FBPase-1 and fructose 2,6-bisphosphate
The liver plays a key role in maintaining blood glucose homeostasis: this requires regulatory mechanisms that coordinate glucose consumption and production. Two hormones are mainly involved: glucagon and insulin.[6] They act intracellularly through fructose 2,6-bisphosphate or F2,6BP, an allosteric effector of PFK-1 and FBPase-1. This molecule is structurally related to fructose 1,6-bisphosphate, but is not an intermediate in glycolysis or gluconeogenesis.[1]
It was discovered in 1980 by Emile Van Schaftingen and Henri-Gery Hers, as a potent activator of PFK-1. In the subsequent year, the same researchers showed that it is also a potent inhibitor of FBPase-1.[9][10]
Fructose 2,6-bisphosphate, by binding to the allosteric site on PFK-1, reduces the affinity of the enzyme for ATP and citrate, allosteric inhibitors, and at the same time increases the affinity of the enzyme for fructose 6-phosphate, its substrate. PFK-1, in the absence of fructose 2,6-bisphosphate, and in the presence of physiological concentrations of ATP, fructose 6-phosphate, and of allosteric effectors AMP, ATP and citrate, is practically inactive. Conversely, the presence of fructose 2,6-bisphosphate activates PFK-1, thus stimulating glycolysis in the hepatocytes. At the same time fructose 2,6-bisphosphate slows down gluconeogenesis by inhibiting fructose 1,6-bisphosphatase, even in the absence of AMP. However, the effects of fructose-2,6-bisphosphate and AMP on FBPase-1 activity are synergistic.
F2,6BP: Regulation of Glycolysis and Gluconeogenesis
Fructose-2,6-bisphosphate concentration is regulated by the relative rates of synthesis and degradation. It is synthesized from fructose 6-phosphate in the reaction catalyzed by phosphofructokinase-2 or PFK-2 (EC 2.7.1.105), and is hydrolyzed to fructose 6-phosphate in the reaction catalyzed by fructose 2,6-bisphosphatase or FBPasi-2 (EC 3.1.3.46). These two enzymatic activities are located on a single bifunctional enzyme or tandem enzyme. In the liver, the balance of these two enzymatic activities is regulated by insulin and glucagon, as described below.
Glucagon
It is released into the circulation when blood glucose levels drop, signaling the liver to reduce glucose consumption for its own needs and to increase de novo synthesis of glucose and its release from glycogen stores.
After binding to specific membrane receptors, glucagon stimulates hepatic adenylate cyclase (EC 4.6.1.1) to synthesize 3′,5′-cyclic AMP or cAMP, that activates cAMP-dependent protein kinase or protein kinase A or PKA (EC 2.7.11.11). The kinase catalyzes the phosphorylation, at the expense of one molecule of ATP, of a specific serine residue (Ser32) of PFK-2/FBPase-2. As a result of the phosphorylation, phosphatase activity increases while kinase activity decreases. Such reduction, due to the increase in the Km for fructose 6-phosphate, causes a decrease in the levels of fructose 2,6-bisphosphate, that, in turn, inhibits glycolysis and stimulates gluconeogenesis. Therefore, in response to glucagon, hepatic production of glucose increases, enabling the organ to counteract the fall in blood glucose levels.
Note: glucagon, like adrenaline, stimulates gluconeogenesis also by increasing the availability of substrates such as glycerol and amino acids.
Insulin
After binding to specific membrane receptors, insulin activates a protein phosphatase, the phosphoprotein phosphatase 2A or PP2A, that catalyzes the removal of the phosphate group from PFK-2/FBPase-2, thus increasing PFK-2 activity and decreasing FBPase-2 activity. (At the same time, insulin also stimulates a cAMP phosphodiesterase that hydrolyzes cAMP to AMP). This increases the level of fructose 2,6-bisphosphate, that, in turn, inhibits gluconeogenesis and stimulates glycolysis.
In addition, fructose 6-phosphate allosterically inhibits FBPase-2, and activates PFK-2. It should be noted that the activities of PFK-2 and FBPase-2 are inhibited by their reaction products. However, the main effectors are the level of fructose 6-phosphate and the phosphorylation state of the enzyme.
Glucose 6-phosphatase
Unlike pyruvate carboxylase and fructose-1,6-bisphosphatase, the catalytic subunit of glucose-6-phosphatase is not subject to allosteric or covalent regulation. The modulation of its activity occurs at the transcriptional level.[7] Low blood glucose levels and glucagon, namely, factors that lead to increased glucose production, and glucocorticoids stimulate its synthesis, that, conversely, is inhibited by insulin.
Also, the Km for glucose 6-phosphate is significantly higher than the range of physiological concentrations of glucose 6-phosphate itself. This is why it is said that the activity of the enzyme is almost linearly dependent on the concentration of the substrate, that is, enzyme is controlled by the level of substrate.
PEP carboxykinase
The enzyme is regulated mainly at the level of synthesis and degradation. For example, high levels of glucagon or fasting increase protein production through the stabilization of its mRNA and the increase in its transcription rate. High blood glucose levels or insulin have opposite effects.
Xylulose 5-phosphate
Xylulose 5-phosphate, a product of the pentose phosphate pathway, is a recently discovered regulatory molecule. It stimulates glycolysis and inhibits gluconeogenesis by controlling the levels of fructose 2,6-bisphosphate in the liver.
When blood glucose levels increase, e.g. after a meal high in carbohydrates, the activation of glycolysis and hexose monophosphate pathway occurs in the liver. Xylulose 5-phosphate produced activates protein phosphatase 2A, that, as previously said, dephosphorylates PFK-2/FBPase-2, thus inhibiting FBPase-2 and stimulating PFK-2. This leads to an increase in the concentration of fructose 2,6-bisphosphate, and then to the inhibition of gluconeogenesis and stimulation of glycolysis, resulting in increased production of acetyl-CoA, the main substrate for the synthesis of lipids.[2] At the same time, an increase in flow through the hexose monophosphate shunt occurs, leading to the production of NADPH, a source of electrons for lipid synthesis. Finally, PP2A also dephosphorylates carbohydrate-responsive element-binding protein or ChREBP, a transcription factor that activates the expression of hepatic genes for lipid synthesis. Therefore, in response to an increase in blood glucose levels, lipid synthesis is stimulated.
It is therefore evident that xylulose 5-phosphate is a key regulator of carbohydrate and fat metabolism.
Precursors
Besides the aforementioned pyruvate, the major gluconeogenic precursors are lactate, glycerol, the majority of the amino acids, and, more generally, any compound that can be converted to pyruvate or oxaloacetate.[1]
Glycerol
Glycerol is released by lipolysis in adipose tissue. With the exception of propionyl-CoA, it is the only part of the lipid molecule that can be used for de novo synthesis of glucose in animals.
Glycerol enters gluconeogenesis, or glycolysis, depending on the cellular energy charge, as dihydroxyacetone phosphate or DHAP, whose synthesis occurs in two steps.
In the first step, glycerol is phosphorylated to glycerol 3-phosphate, in the reaction catalyzed by glycerol kinase (EC 2.7.1.30), with the consumption of one ATP.
Glycerol + ATP → Glycerol 3-phosphate + ADP + Pi
The enzyme is absent in adipocytes but present in the liver; this means that glycerol needs to reach the liver to be further metabolized.
Glycerol 3-phosphate is then oxidized to dihydroxyacetone phosphate, in the reaction catalyzed by glycerol 3-phosphate dehydrogenase (EC 1.1.1.8). In this reaction NAD+ is reduced to NADH.
During prolonged fasting, glycerol is the major gluconeogenic precursor, accounting for about 20 percent of glucose production.[3]
Glucogenic amino acids
Pyruvate and oxaloacetate are the entry points for the glucogenic amino acids, i.e. those whose carbon skeleton or part of it can be used for de novo synthesis of glucose.
Amino acids result from the catabolism of proteins, both food and endogenous proteins, like those of skeletal muscle during the fasting state or during intense and prolonged exercise.
The catabolic processes of each of the twenty amino acids that made up the proteins converge to form seven major products, acetyl-CoA, acetoacetyl-CoA, α-ketoglutarate, succinyl-CoA, fumarate, oxaloacetate, and pyruvate.
Except acetyl-CoA, acetoacetyl-CoA , the other five molecules can be used for gluconeogenesis. This means that gluconeogenic amino acids may also be defined as those whose carbon skeleton or part of it can be converted to one or more of the above molecules.
Below, the entry points of the gluconeogenic amino acids are shown.
Pyruvate: alanine, cysteine, glycine, serine, threonine and tryptophan.
Oxaloacetate: aspartate and asparagine.
α-Ketoglutarate: glutamate, arginine, glutamine, histidine and proline.
Succinyl-CoA: isoleucine, methionine, threonine and valine.
Fumarate: phenylalanine and tyrosine.
Glucogenic and Ketogenic Amino Acids
α-Ketoglutarate, succinyl-CoA and fumarate, intermediates of the citric acid cycle, enter the gluconeogenic pathway after conversion to oxaloacetate.
The utilization of the carbon skeletons of the amino acids requires the removal of the amino group. Alanine and glutamate, the key molecules in the transport of amino groups from extrahepatic tissues to the liver, are major glucogenic amino acids in mammals. Alanine is the main gluconeogenic substrate for the liver; this amino acid is shuttled to the liver from muscle and other peripheral tissues through the glucose-alanine cycle.
Ketogenic amino acids
Acetyl-CoA and acetoacetyl-CoA cannot be used for gluconeogenesis and are precursors of fatty acids and ketone bodies. The stoichiometry of the citric acid cycle elucidates why they cannot be used for de novo synthesis of glucose.
Acetyl-CoA, in the reaction catalyzed by citrate synthase, condenses with oxaloacetate to form citrate, a molecule with 6 carbon atoms instead of 4 as oxaloacetate. However, although the two carbon atoms from acetyl-CoA become part of the oxaloacetate molecule, two carbon atoms are oxidized and removed as CO2, in the reactions catalyzed by isocitrate dehydrogenase (EC 1.1.1.42) and α-ketoglutarate dehydrogenase complex. Therefore, acetyl-CoA does not yield any net carbon gain for the citric acid cycle.
Furthermore, the reaction leading to the formation of acetyl-CoA from pyruvate, catalyzed by the pyruvate dehydrogenase complex, that is the bridge between glycolysis and the Krebs cycle, is irreversible, and there is no other pathway to convert acetyl-CoA to pyruvate.
For this reason, amino acids whose catabolism produces acetyl-CoA and/or acetoacetyl-CoA, are termed ketogenic.
Only leucine and lysine are exclusively ketogenic.
Note: Plants, yeasts, and many bacteria can use acetyl-CoA for de novo synthesis of glucose as they do have the glyoxylate cycle. This cycle has four reactions in common with the citric acid cycle, two unique enzymes, isocitrate lyase (EC 4.1.3.1) and malate synthase (EC 2.3.3.9), but lacks the decarboxylation reactions. Therefore, organisms that have such pathway are able to use fatty acids for gluconeogenesis.
Five amino acids, isoleucine, phenylalanine, tyrosine, threonine and tryptophan, are both glucogenic and ketogenic, because part of their carbon backbone can be used for gluconeogenesis, while the other gives rise to ketone bodies.
Propionate
Propionate, which belongs to the group of short-chain fatty acids, is a gluconeogenic precursor because, as propionyl-CoA, the active molecule, can be converted to succinyl-CoA.
Below, the different sources of propionate are analyzed.
It may arise from beta-oxidation of odd-chain fatty acids such as margaric acid, a saturated fatty acid with 17 carbon atoms. Such fatty acids are rare compared to even-chain fatty acids, but present in significant amounts in the lipids of some marine organisms, ruminants, and plants. In the last pass through the β-oxidation sequence, the substrate is a five carbon fatty acid. This means that, once oxidized and cleaved to two fragments, it produces an acetyl-CoA and propionyl-CoA.
Another source is the oxidation of branched-chain fatty acids, with alkyl branches with an odd number of carbon atoms. An example is phytanic acid, produced in ruminants by oxidation of phytol, a breakdown product of chlorophyll.
In ruminants, propionate is also produced from glucose. Glucose is released from breakdown of cellulose by bacterial cellulase (EC 3.2.1.4) in the rumen, one of the four chambers that make up the stomach of these animals. These microorganisms then convert, through fermentation, glucose to propionate, which, once absorbed, may be used for gluconeogenesis, synthesis of fatty acids, or be oxidized for energy.[5]
In ruminants, in which gluconeogenesis tends to be a continuous process, propionate is the major gluconeogenic precursor.
Propionate may also result from the catabolism of valine, leucine, and isoleucine.
In the colon, propionate is produced by bacteria of the gut microbiota through anaerobic fermentation of non-digestible carbohydrates, such as resistant starch and fibers. Absorbed by the enterocytes, the unmetabolized portion passes into the portal circulation and reaches the liver where it can enter gluconeogenesis.
The oxidation of propionyl-CoA to succinyl-CoA involves three reactions that occur in the liver and other tissues.
In the first reaction, propionyl-CoA is carboxylated to D-methylmalonyl-CoA in the reaction catalyzed by propionyl-CoA carboxylase (EC 6.4.1.3), a biotin-requiring enzyme. This reaction consumes one ATP.
Propionyl-CoA + HCO3– + ATP → D-methylmalonyl-CoA+ ADP + Pi
In the subsequent reaction, catalyzed by methylmalonyl-CoA epimerase (EC 5.1.99.1), D-methylmalonyl-CoA is epimerized to its L-stereoisomer.
D-Methylmalonyl-CoA ⇄ L-Methylmalonyl-CoA
Finally, L-methylmalonyl-CoA undergoes an intramolecular rearrangement to succinyl-CoA, in the reaction catalyzed by methylmalonyl-CoA mutase (EC 5.4.99.2). This enzyme requires 5-deoxyadenosylcobalamin or coenzyme B12, a derivative of cobalamin or vitamin B12, as a coenzyme.
^ Kabashima T., Kawaguchi T., Wadzinski B.E., Uyeda K. Xylulose 5-phosphate mediates glucose-induced lipogenesis by xylulose 5-phosphate-activated protein phosphatase in rat liver. Proc Natl Acad Sci USA 2003;100:5107-5112. doi:10.1073/pnas.0730817100
^ Kuriyama H. et all. Coordinated regulation of fat-specific and liver-specific glycerol channels, aquaporin adipose and aquaporin 9. Diabetes 2002;51(10):2915-2921. 10.2337/diabetes.51.10.2915
^ McCommis K.S. and Finck B.N. Mitochondrial pyruvate transport: a historical perspective and future research directions. Biochem J 2015;466(3):443-454. doi:10.1042/BJ20141171
^ abcdefghi Nelson D.L., M. M. Cox M.M. Lehninger. Principles of biochemistry. 6th Edition. W.H. Freeman and Company, 2012
^ abcde Rosenthal M.D., Glew R.H. Medical biochemistry – Human metabolism in health and disease. John Wiley J. & Sons, Inc., Publication, 2009
^ Soty M., Chilloux J., Delalande F., Zitoun C., Bertile F., Mithieux G., and Gautier-Stein A. Post-Translational regulation of the glucose-6-phosphatase complex by cyclic adenosine monophosphate is a crucial determinant of endogenous glucose production and is controlled by the glucose-6-phosphate transporter. J Proteome Res 2016;15(4):1342-1349. doi:10.1021/acs.jproteome.6b00110
^ abc Stipanuk M.H., Caudill M.A. Biochemical, physiological, and molecular aspects of human nutrition. 3rd Edition. Elsevier health sciences, 2012
^ Van Schaftingen E., and Hers H-G. Inhibition of fructose-1,6-bisphosphatase by fructose-2,6-bisphosphate. Proc Natl Acad Sci USA 1981;78(5):2861-2863. doi:10.1073/pnas.78.5.2861
^ Van Schaftingen E., Jett M-F., Hue L., and Hers H-G. Control of liver 6-phosphofructokinase by fructose 2,6-bisphosphate and other effectors. Proc Natl Acad Sci USA 1981;78(6):3483-3486. doi:10.1073/pnas.78.6.3483
The glucose-alanine cycle, or Cahill cycle, proposed for the first time by Mallette, Exton and Park, and Felig et al. between 1969 and 1970, consists of a series of steps through which extrahepatic tissues, for example the skeletal muscle, export pyruvate and amino groups as alanine to the liver, and receive glucose from the liver via the bloodstream.[1][4]
The main steps of the glucose-alanine cycle are summarized below.[5][6]
When in extrahepatic tissues amino acids are used for energy, pyruvate, derived from glycolysis, is used as amino group acceptor, forming alanine, a nonessential amino acid.
Alanine diffuses into the bloodstream and reaches the liver.
In the liver, the amino group of alanine is transferred to alpha-ketoglutarate to form pyruvate and glutamate, respectively.
The amino group of glutamate mostly enters the urea cycle, and in part acts as a nitrogen donor in many biosynthetic pathways.
Pyruvate enters gluconeogenesis and is used for glucose synthesis.
The newly formed glucose diffuses into the bloodstream and reaches the peripheral tissues where, due to glycolysis, is converted into pyruvate that can accept amino groups from the free amino acids, thus closing the cycle.
Therefore, the glucose-alanine cycle provides a link between the metabolism of carbohydrates and amino acids, as schematically described below.[6]
Glucose → Pyruvate → Alanine → Pyruvate → Glucose
Glucose-Alanine Cycle
The glucose-alanine cycle occurs not only between the skeletal muscle, the first tissue in which it was observed, and the liver, but involves other cells and extrahepatic tissues including cells of the immune system, such as lymphoid organs.
The analysis of the steps of the glucose-alanine cycle is made considering the cycle between skeletal muscle and the liver.
Both intracellular and extracellular proteins are continuously hydrolyzed to the constituent amino acids and resynthesized, and the rate at which these processes occur is balanced precisely, thereby preventing loss of fat free mass.[3]
However, under catabolic conditions, such as intense and prolonged exercise or fasting, the rate of muscle protein breakdown exceeds synthesis. This leads to the liberation of amino acids, some of which are used for energy and others for gluconeogenesis. And the oxidation of the carbon skeletons of amino acids, in particular branched chain amino acids or BCAA, leucine, isoleucine and valine, may be a significant source of energy for the muscle. For example, after about 90 minutes of strenuous exercise, amino acid oxidation in muscle provides 10-15 percent of the energy needed for contraction.
The utilization of the carbon skeletons of amino acids for energy involves the removal of the amino group, and then the excretion of amino nitrogen in a non-toxic form.[5][6]
The removal of the alpha-amino group occurs by transamination, that can be summarized as follows:
alpha-Keto acid + Amino acid ⇄ New amino acid + New alpha-keto acid
Such reactions, catalyzed by enzymes called aminotransferases or transaminases (EC 2.6.1-) are freely reversible.
Branched chain amino acids, for example, transfer the amino group to alpha-ketoglutarate or 2-oxoglutaric acid, to form glutamate and the α-keto acid derived from the original amino acid, in a reaction catalyzed by branched chain aminotransferase or BCAT (EC 2.6.1.42).
The glucose-alanine cycle in skeletal muscle
In skeletal muscle, the newly formed glutamate may react with ammonia to form glutamine, for many tissues and organs, such as the brain, the major vehicle for interorgan transport of nitrogen.[7] The reaction is catalyzed by the cytosolic enzyme glutamine synthetase (EC 6.3.1.2), and consumes an ATP.
Glutamate + NH4+ + ATP → Glutamine + ADP + Pi
In this case, glutamate leaves the Cahill cycle.
Alternatively, and in contrast to what happens in most of the other tissues, the newly formed glutamate may transfer the amino group to pyruvate, derived from glycolysis, to form alanine and alpha-ketoglutarate. This transamination is catalyzed by alanine aminotransferase or ALT (EC 2.6.1.2), an enzyme found in most animal and plant tissues.
The alanine produced and that derived directly from protein breakdown, and muscle proteins are rich in alanine, can leave the cell and be carried by the bloodstream to the liver; in this way the amino group reaches the liver. And the rate at which alanine formed by transamination of pyruvate is transferred into the circulation is proportional to the intracellular pyruvate production.
Note: Alanine and glutamine are the major sources of nitrogen and carbon in interorgan amino acid metabolism.
The glucose-alanine cycle in the liver
Once in the liver, a hepatic alanine aminotransferase catalyzes a transamination in which alanine, the major gluconeogenic amino acid, acts as an amino group donor and alpha-ketoglutarate as an alpha-keto acid acceptor.[6] The products of the reaction are pyruvate, i.e. the carbon skeleton of alanine, and glutamate.
Glutamate, in the reaction catalyzed by glutamate dehydrogenase (EC 1.4.1.2), an enzyme present in the mitochondrial matrix, forms ammonium ion, which enters the urea cycle, and alpha-ketoglutarate, which can enter the Krebs cycle. This reaction is an anaplerotic reaction that links amino acid metabolism with the citric acid cycle.[6]
However, glutamate can also react with oxaloacetate to form aspartate and alpha-ketoglutarate, in a reaction catalyzed by aspartate aminotransferase (EC 2.6.1.1). Aspartate is involved in the formation of urea as well as in the synthesis of purines and pyrimidines.
Also the pyruvate produced may have different metabolic fates: it can be oxidized for ATP production, and then leave the glucose-alanine cycle, or enter the gluconeogenesis pathway, and thus continue in the cycle.
The glucose produced is released from the liver into the bloodstream and delivered to various tissues that require it, as the skeletal muscle, in which it is used for pyruvate synthesis. In turn, the newly formed pyruvate may react with glutamate, thus closing the cycle.
Transaminases
As previously mentioned, the removal of the amino group from amino acids occurs through transamination. These reactions are catalyzed by enzymes called aminotransferases or transaminases.[6]
They are cytosolic enzymes, present in all cells and particularly abundant in the liver, kidney, intestine and muscle; they require pyridoxal phosphate or PLP, the active form of vitamin B6 or pyridoxine, as a coenzyme, which is tightly bound to the active site.
In transamination reactions, the amino group of free amino acids, except of threonine and lysine, is channeled towards a small number of keto acids, notably pyruvate, oxaloacetate and alpha-ketoglutarate.
Cells contain different types of aminotransferases: many are specific for alpha-ketoglutarate as alpha-keto acid acceptor, but differ in specificity for the amino acid, from which they are named. Examples are the aforementioned alanine aminotransferase, also called alanine transaminase and glutamic pyruvic transferase or GPT, and aspartate aminotransferase or AST, also called glutamic-oxaloacetic transaminase or GOT.
It should be underlined that there is no net deamination in these reactions, no loss of amino groups, as the alpha-keto acid acceptor is aminated and the amino acid deaminated.
It transports nitrogen in a non-toxic form from peripheral tissues to the liver.
It transports pyruvate, a gluconeogenic substrate, to the liver.
It removes pyruvate from peripheral tissues. This leads to a higher production of ATP from glucose in these tissues. In fact, the NADH produced during glycolysis can enter the mitochondria and be oxidized through oxidative phosphorylation.
It allows to maintain a relatively high concentration of alanine in hepatocytes, sufficient to inhibit protein degradation.
It may play a role in host defense against infectious diseases.
Finally, it is important to underline that there is no net synthesis of glucose in the glucose-alanine cycle.
Energy cost
Like the Cori cycle, also the glucose-alanine cycle has an energy cost, equal to 3-5 ATP.
The part of the cycle that takes place in peripheral tissues involves the production of 5-7 ATP per molecule of glucose:
2 ATP are produced by glycolysis;
3-5 ATP derive from NADH/FADH2.
Instead in the liver, gluconeogenesis and the urea cycle cost 10 ATP:
6 ATP are consumed in the during gluconeogenesis per molecule of glucose synthesized;
4 ATP are consumed in the urea cycle per molecule of urea synthesized.
The glucose-alanine cycle, like the Cori cycle, shifts part of the metabolic burden from extrahepatic tissues to the liver.[6] However, the energy cost paid by the liver is justified by the advantages that the cycle brings to the whole body, as it allows, in particular conditions, an efficient breakdown of proteins in extrahepatic tissues, especially skeletal muscle, which in turn allows to obtain gluconeogenic substrates as well as the use of amino acids for energy in extrahepatic tissues.
Similarities and differences with the Cori cycle
There are some analogies between the two cycles, which are listed below.[6][7]
The Cahill cycle partially overlaps the Cori cycle when pyruvate is converted to glucose and the monosaccharide is transported to extrahepatic tissues, in which it is converted again to pyruvate via the glycolytic pathway.
The entry into gluconeogenesis pathway is similar for the two cycles: both alanine and lactate are converted to pyruvate.
Like the Cori cycle, the glucose-alanine cycle occurs between different cell types, unlike metabolic pathways such as glycolysis, citric acid cycle or gluconeogenesis that occur within individual cells
Cori cycle vs Glucose-Alanine Cycle
Below, some differences between the two cycles.
The main difference concerns the three carbon intermediate that from peripheral tissues reach the liver: lactate in the Cori cycle, and alanine in the glucose-alanine cycle.
Another difference concerns the fate of the NADH produced by glycolysis in peripheral tissues.
In the Cori cycle, the coenzyme acts as reducing agent to reduce pyruvate to lactate, in the reaction catalyzed by lactate dehydrogenase (EC 1.1.1.27).
In the glucose-alanine cycle, this reduction does not occur and the electrons of NADH can be transported into the mitochondria via the malate-aspartate and glycerol 3-phosphate shuttles, generating NADH, the first shuttle, and FADH2, the other shuttle. And the yield of ATP from NADH and FADH2 is 2.5 and 1.5, respectively.
Finally, from the previous point, it is clear that, unlike the Cori cycle, the Cahill cycle requires the presence of oxygen and mitochondria in the peripheral tissues.
References
^ Felig P., Pozefsk T., Marlis E., Cahill G.F. Alanine: key role in gluconeogenesis. Science 1970;167(3920):1003-1004. doi:10.1126/science.167.3920.1003
^ Gropper S.S., Smith J.L., Groff J.L. Advanced nutrition and human metabolism. Cengage Learning, 2009
^ Lecker S.H., Goldberg A.L. and Mitch W.E. Protein degradation by the ubiquitin–proteasome pathway in normal and disease states. J Am Soc Nephrol 2006;17(7):1807-1819.doi:10.1681/ASN.2006010083
^ Mallette L. E., Exton J.H., and Park C.R. Control of gluconeogenesis from amino acids in the perfused rat liver. J Biol Chem 1969;244(20):5713-5723. doi:10.1016/S0021-9258(18)63618-X
^ abc Moran L.A., Horton H.R., Scrimgeour K.G., Perry M.D. Principles of Biochemistry. 5th Edition. Pearson, 2012
^ abcdefgh Nelson D.L., Cox M.M. Lehninger. Principles of biochemistry. 6th Edition. W.H. Freeman and Company, 2012
^ abc Wu G. Amino acids: biochemistry and nutrition. CRC Press, 2010
The Cori cycle, or glucose-lactate cycle, was discovered by Carl Ferdinand Cori and Gerty Theresa Radnitz, a husband-and-wife team, in the ‘30s and ‘40s of the last century . They demonstrated the existence of a metabolic cooperation between the skeletal muscle working under low oxygen conditions and the liver. This cycle can be summarized as follows:
the conversion of glucose to lactic acid, or lactate, by anaerobic glycolysis in skeletal muscle cells;
the diffusion of lactate from muscle cells into the bloodstream, by which it is transported to the liver;
the conversion of lactate to glucose by hepatic gluconeogenesis;
the diffusion of glucose from the hepatocytes into the bloodstream, by which it is transported back to the skeletal muscle cells, thereby closing the cycle.
Summarizing, we have: part of the lactate produced in skeletal muscle is converted to glucose in the liver, and transported back to skeletal muscle, thus closing the cycle.
Glucose → Lactate → Glucose
The importance of this cycle is demonstrated by the fact that it may account for about 40% of plasma glucose turnover.
In addition to skeletal muscle, this metabolic cooperation was also demonstrated between other extrahepatic tissues and liver. Indeed, like the glucose-alanine cycle, the glucose-lactate cycle is active between the liver and all those tissues that do not completely oxidize glucose to CO2 and H2O, in which case pyruvate for conversion to lactate or, by transamination, to alanine would lack.
In addition to skeletal muscle cells, examples of cells that continually produce lactic acid are red blood cells, immune cells in the lymph nodules, proliferating cells in the bone marrow, and epithelial cells in the skin.
Notice that skeletal muscle produces lactate even at rest, although at low rate.
The Cori Cycle
From a biochemical point of view, the Cori cycle links gluconeogenesis with anaerobic glycolysis, using different tissues to compartmentalize opposing metabolic pathways. In fact, in the same cell, regardless of the cell type, these metabolic pathways are not very active simultaneously. Glycolysis is more active when the cell requires ATP; by contrast, when the demand for ATP is low, gluconeogenesis, in those cells where it occurs, is more active.
And it is noteworthy that, although traditionally the metabolic pathways, such as glycolysis, citric acid cycle, or gluconeogenesis, are considered to be confined within individual cells, the Cori cycle, as well as the glucose-alanine cycle, occurs between different cell types.
Finally, it should be underscored that the Cori cycle also involves the renal cortex, particularly the proximal tubules, another site where gluconeogenesis occurs.
Steps of the Cori cycle
The analysis of the steps of the Cori cycle is made considering the lactate produced by red blood cells and skeletal muscle cells.
Mature red blood cells are devoid of mitochondria, nucleus and ribosomes, and obtain the necessary energy only by glycolysis. The availability of NAD+ is essential for glycolysis to proceed as well as for its rate: the oxidized form of the coenzyme is required for the oxidation of glyceraldehyde 3-phosphate to 1,3-bisphosphoglycerate in the reaction catalyzed by glyceraldehyde 3-phosphate dehydrogenase (EC 1.2.1.12).
The accumulation of NADH is avoided by the reduction of pyruvate to lactate, in the reaction catalyzed by lactate dehydrogenase (EC 1.1.1.27), where NADH acts as reducing agent.
Pyruvate + NADH + H+ → Lactate + NAD+
The skeletal muscle, particularly fast-twitch fibers which contain a reduced number of mitochondria, under low oxygen condition, such as during intense exercise, produces significant amounts of lactate. In fact, in such conditions:
the rate of pyruvate production by glycolysis exceeds the rate of its oxidation by the citric acid cycle, so that less than 10% of the pyruvate enters the citric acid cycle;
the rate at which oxygen is taken up by the cells is not sufficient to allow aerobic oxidation of all the NADH produced.
And, like in red blood cells, the reaction catalyzed by lactate dehydrogenase, regenerating NAD+, allows glycolysis to proceed.
However, lactate is an end product of metabolism that must be converted back into pyruvate to be used.
The plasma membrane of most cells is freely permeable to both pyruvate and lactate that can thus reach the bloodstream. And, regarding for example the skeletal muscle, the amount of lactate that leaves the cell is greater than that of pyruvate due to the high NADH/NAD+ ratio in the cytosol and to the catalytic properties of the skeletal muscle isoenzyme of LDH.
Once into the bloodstream, lactate reaches the liver, which is its major user, where it is oxidized to pyruvate in the reaction catalyzed by the liver isoenzyme of lactate dehydrogenase.
Lactate + NAD+ → Pyruvate + NADH + H+
In the hepatocyte, this oxidation is favored by the low NADH/NAD+ ratio in the cytosol.
Then, pyruvate enters the gluconeogenesis pathway to be converted into glucose.
Glucose leaves the liver, enters into the bloodstream and is delivered to the muscle, as well as to other tissues and cells that require it, such as red blood cells and neurons, thus closing the cycle.
Lactate dehydrogenase
The enzyme is a tetramer composed of two different types of subunits, designed as:
H subunit (heart) or B chain;
M subunit (muscle) or A chain.
The H subunit predominates in the heart, whereas the M subunit predominates in the skeletal muscle and liver. Typically, tissues in which a predominantly or exclusively aerobic metabolism occurs, such as the heart, synthesize H subunits to a greater extent than M subunits, whereas tissues in which anaerobic metabolism is important, such as skeletal muscle, synthesize M subunits to a greater extent than H subunits.
The two subunits associate in 5 different ways to form homopolymers, that is, macromolecules formed by repeated, identical subunits, or heteropolymers, that is, macromolecules formed by different subunits. Different LDH isoenzymes have different catalytic properties, as well as different distribution in various tissues, as indicated below:
H4, also called type 1, LDH1, or A4, a homopolymer of H subunits, is found in cardiac muscle, kidney, and red blood cells;
H3M1, also called type 2, LDH2, or A3B, has a tissue distribution similar to that of LDH1;
H2M2, also called type 3, LDH3, or A2B2, is found in the spleen, brain, white cells, kidney, and lung;
H1M3, also called type 4, LDH4, or AB3, is found in the spleen, lung, skeletal muscle, lung, red blood cells, and kidney;
M4, also called type 5, LDH5, or B4, a homopolymer of M subunits, is found in the liver, skeletal muscle, and spleen.
The H4 isoenzyme has a higher substrate affinity than the M4 isoenzyme, and is allosterically inhibited by high levels of pyruvate, its product, whereas the M4 isoenzyme is not.
The other LDH isoenzymes have intermediate properties, depending on the ratio between the two types of subunits.
It is thought that the H4 isoenzyme is the most suitable for catalyzing the oxidation of lactate to pyruvate that, in the heart, due to its exclusively aerobic metabolism, is then completely oxidized to CO2 and H2O. Instead, the M4 isoenzyme is the main isoenzyme found in skeletal muscle, most suitable for catalyzing the reduction of pyruvate to lactate, thus allowing glycolysis to proceed in anaerobic conditions.
Other metabolic fates of lactate
From the above, it is clear that lactate is not a metabolic dead end, a waste product of glucose metabolism.
And it may have a different fate from that entering the Cori cycle.
For example, in skeletal muscle during recovery following an exhaustive exercise, that is, when oxygen is again available, or if the exercise is of low intensity, lactate is re-oxidized to pyruvate, due to NAD+ availability, and then completely oxidized to CO2 and H20, with a greater production of ATP than in anaerobic condition. In such conditions, the energy stored in NADH will be released, yielding on average 2.5 ATP per molecule of NADH.
In addition, lactate can be taken up by exclusively aerobic tissues, such as heart, to be oxidized to CO2 and H20.
Energy cost
The Cori cycle results in a net consumption of 4 ATP.
The gluconeogenic leg of the cycle consumes 2 GTP and 4 ATP per molecule of glucose synthesized, that is, 6 ATP.
ATP-consuming reactions are catalyzed by:
pyruvate carboxylase (EC 6.4.1.1): one ATP;
phosphoenolpyruvate carboxykinase (EC 4.1.1.32): one GTP;
glyceraldehyde 3-phosphate dehydrogenase (EC 1.2.1.12): one ATP.
Since two molecules of lactate are required for the synthesis of one molecule of glucose, the net cost is 2 x 3 = 6 high energy bonds per molecule of glucose.
Conversely, the glycolytic leg of the cycle produces only 2 ATP per molecule of glucose.
Therefore, more energy is required to produce glucose from lactate than that obtained by anaerobic glycolysis in extrahepatic tissues. This explains why the Cori cycle cannot be sustained indefinitely.
Is the Cori cycle a futile cycle?
The continuous breakdown and resynthesis of glucose, feature of the Cori cycle, might seem like a waste of energy. Indeed, this cycle allows the effective functioning of many extrahepatic cells at the expense of the liver and partly of the renal cortex. Therefore, it is therefore more correct to define it as a substrate cycle rather than a futile cycle. Below, two examples.
Red blood cells
These cells, lacking a nucleus, ribosomes, and mitochondria, are smaller than most other cells. Their small size allows them to pass through tiny capillaries. However, the lack of mitochondria makes them completely dependent on anaerobic glycolysis for ATP production. Then, the lactate is partly disposed of by the liver and renal cortex.
Skeletal muscle
Its cells, and particularly fast-twitch fibers contracting under low oxygen conditions, such as during intense exercise, produce much lactate.
In such conditions, anaerobic glycolysis leads to the production of 2 ATP per molecule of glucose, 3 if the glucose comes from muscle glycogen, therefore, much lower than the 29-30 ATP produced by the complete oxidation of the monosaccharide. However, the rate of ATP production by anaerobic glycolysis is greater than that produced by the complete oxidation of glucose. Therefore, to meet the energy requirements of contracting muscle, anaerobic glycolysis is an effective means of ATP production. But this could lead to an intracellular accumulation of lactate, and a consequent reduction in intracellular pH. Obviously, such accumulation does not occur, due also to the Cori cycle, in which the liver pays the cost of the disposal of a large part of the muscle lactate, thereby allowing the muscle to use ATP for the contraction.
And the oxygen debt, which always occurs after a strenuous exercise, is largely due to the increased oxygen demand of the hepatocytes, in which the oxidation of fatty acids, their main fuel, provides the ATP required for gluconeogenesis from lactate.
During trauma, sepsis, burns, or after major surgery, an intense cell proliferation occurs in the wound, that is a hypoxic tissue, and in bone marrow. This in turn results in greater production of lactate, an increase in the flux through the Cori cycle and an increase in ATP consumption in the liver, which, as previously said, is supported by an increase in the oxidation of fatty acids. Hence, the nutrition plan provided to these patients must be taken into account this increase in energy consumption.
A similar condition seems to occur also in cancer patients with progressive weight loss.
The Cori cycle is also important during overnight fasting and starvation.
Cori cycle and glucose-alanine cycle
These cycles are metabolic pathways that contribute to ensure a continuous delivery of glucose to tissues for which the monosaccharide is the primary source of energy.
The main difference between the two cycles consists in the three carbon intermediate which is recycled: in the Cori cycle, carbon returns to the liver in the form of pyruvate, whereas in the glucose-alanine cycle in the form of alanine.
For more information, see: glucose-alanine cycle.
Bile salts and bile acids are polar cholesterol derivatives, and represent the major route for the elimination of the steroid from the body.
They are molecules with similar but not identical structures, and diverse physical and biological characteristics.
They are synthesized in the liver, stored in the gallbladder, secreted into the duodenum, and finally, for the most part, reabsorbed in the ileum.
Because at physiological pH these molecules are present as anions, the terms bile acid and bile salts are used herein as synonyms.
Bile salts have similarities and differences with cholesterol molecule.
Like the steroid, they have a nucleus composed of four fused rings: three cyclohexane rings, labeled A, B and C, and a cyclopentane ring, labeled D. This structure is the perhydrocyclopentanophenanthrene, more commonly known as steroid nucleus.
Bile Acids and Their Conjugates
In higher vertebrates, they have 24 carbon atoms, as the side chain is three carbons shorter than the original. In lower vertebrates, bile acids have 25, 26, or 27 carbon atoms. The side chain ends with a carboxyl group, ionized at pH 7, that can be linked to the amino acid glycine or taurine.
In addition to the hydroxyl group at position 3, they have hydroxyl groups at positions 7 and/or 12.
All this makes them much more polar than cholesterol.
Since A and B rings are fused in cis configuration, the planar structure of the steroid nucleus is curved, and it is possible to identify:
a concave side, which is hydrophilic because the hydroxyl groups and the carboxyl group of the side chain, with or without the linked amino acid, are oriented towards it;
a convex side, which is hydrophobic because the methyl groups present at position 18 and 19 are orientated towards it.
Cholic Acid Structure
Therefore, having both polar and nonpolar groups, they are amphiphilic molecules and excellent surfactants. However, their chemical structure makes them different from many other surfactants, often composed of a polar head region and a nonpolar tail.
Primary, conjugated and secondary bile salts
Primary bile acids are those synthesized directly from cholesterol in the hepatocytes. In humans, the most important are cholic acid and chenodeoxycholic acid, which make up 80 percent of all bile acids. Before being secreted into the biliary tree, they are almost completely conjugated, up to 98 percent, with the glycine or taurine, to form glycoconjugates and tauroconjugates, respectively. In particular, approximately 75 percent of cholic acid and chenodeoxycholic acid are conjugated with glycine, to form glycocholic acid and glycochenodeoxycholic acid, the remaining 25 percent with taurine, to form taurocholic acid and taurochenodeoxycholic.
Synthesis of Conjugated Bile Acids
Conjugated bile acids are molecules with more hydrophilic groups than unconjugated bile acids, therefore with a increased emulsifying capacity. In fact, conjugation decreases the pKa of bile acids, from about 6, a value typical of non-conjugated molecules, to about 4 for glycocholic acid, and about 2 for taurocholic acid. This makes that conjugated bile acids are ionized in a broader range of pH to form the corresponding salts.
The hydrophilicity of the common acid and bile salts decreases in the following order: glycine-conjugated < taurine-conjugated < lithocholic acid < deoxycholic acid < chenodeoxycholic acid < cholic acid < ursodeoxycholic acid.
Finally, conjugation also decreases the cytotoxicity of primary bile acids.
Secondary bile acids are formed from primary bile acids which have not been reabsorbed from the small intestine. Once they reach the colon, they can undergo several modifications by bacteria of the gut microbiota, which is part of the larger human microbiota, to form secondary bile acids, which, along with short-chain fatty acids, are two major type of bacterial metabolites produced in the gut. They make up the remaining 20 percent of the body’s bile acid pool.
Another way of categorizing bile salts is based on their conjugation with glycine and taurine and their degree of hydroxylation. On this basis, three categories are identified.
Trihydroxy conjugates, such as taurocholic acid and glycocholic acid.
Dihydroxy conjugates, such as glycodeoxycholic acid, glycochenodeoxycholic acid, taurochenodeoxycholic acid, and taurodeoxycholic acid. They account for about 60 percent of bile salts present in the bile.
Unconjugated forms, such as cholic acid, deoxycholic acid, chenodeoxycholic acid, and lithocholic acid.
Function of bile acids
All their physiological functions are performed in the conjugated form.
They are the major route for the elimination of cholesterol from human body.
Indeed, humans do not have the enzymes to break open the cyclohexane rings or the cyclopentane ring of the steroid nucleus, nor to oxidize cholesterol to CO2 and water.
The other mechanism to eliminate the steroid from the body is as cholesterol per se in the bile.
Bile salts are strong surfactants. And in particular, di- and trihydroxy conjugates are the best surfactants among bile acids, much more effective than unconjugated counterparts, since they have more polar groups.
Once in contact with apolar lipids in the lumen of the small intestine, the convex apolar surface interacts with the apolar lipids, such as triglycerides, cholesterol esters, and ester of fat-soluble vitamins, whereas the concave polar surface interacts with the surrounding aqueous medium. This increases the dispersion of apolar lipids in the aqueous medium, as it allows the formation of tiny lipid droplets, increasing the surface area for:
lipase activity, mainly pancreatic lipase, (bile salts also play a direct role in the activation of this enzyme);
intestinal esterase activity.
Subsequently, they facilitate lipid absorption, as well as absorption of fat soluble vitamins by the intestinal mucosa, thanks to the formation of mixed micelles.
Bile acids perform a similar function in the gallbladder where, forming mixed micelles with phospholipids, they prevent the precipitation of cholesterol.
Note: as a consequence of the arrangement of polar and nonpolar groups, bile acids form micelles in aqueous solution, usually made up of less than 10 monomers, as long as their concentration is above the so-called critical micellar concentration or CMC.
At the intestinal level, they modulate the secretion of pancreatic enzymes and cholecystokinin.
In the small and large intestine, they have a potent antimicrobial activity, mainly deoxycholic acid, in particular against Gram-positive bacteria. This activity may be due to oxidative DNA damage, and/or to the damage of the cell membrane. Therefore, they play an important role in the prevention of bacterial overgrowth, but also in the regulation of gut microbiota composition.
In the last few years, it becomes apparent their regulatory role in the control of energy metabolism, and in particular for the hepatic glucose handling.
Enterohepatic circulation
After fat intake, enteroendocrine cells of the duodenum secrete cholecystokinin into the blood stream. Hormone binding to receptors on smooth muscle cells of the gallbladder promotes their contraction; the hormone also causes the relaxation of the sphincter of Oddi. All this results in the secretion of the bile, and therefore of bile acids into the duodenum.
Under physiological conditions, human bile salt pool is constant, and equal to about 3-5 g. This is made possible by two processes:
their intestinal reabsorption;
their de novo synthesis.
Up to 95 percent of the secreted bile salts is reabsorbed from the gut, not together with the products of lipid digestion, but through a process called enterohepatic circulation.
It is an extremely efficient recycling system, which seems to occur at least two times for each meal, and includes the liver, the biliary tree, the small intestine, the colon, and the portal circulation through which reabsorbed molecules return to the liver. Such recirculation is necessary since liver’s capacity to synthesize bile acids is limited and insufficient to satisfy intestinal needs if the bile salts were excreted in the feces in high amounts.
Most of the bile salts are reabsorbed into the distal ileum, the lower part of the small intestine, by a sodium-dependent transporter within the brush border of the enterocytes, called sodium-dependent bile acid transporter or ASBT, which carries out the cotransport of a molecule of bile acid and two sodium ions.
Within the enterocyte, it is thought that bile acids are transported across the cytosol to the basolateral membrane by the ileal bile acid-binding protein or IBABP. They cross the basolateral membrane by the organic solute transporter alpha-beta or OSTalpha/OSTbeta, pass into the portal circulation, and, bound to albumin, reach the liver.
It should be noted that a small percentage of bile acids reach the liver through the hepatic artery.
A hepatic level, their extraction is very efficient, with a first-pass extraction fraction ranging from 50 to 90 percent, a percentage that depends on bile acid structure. The uptake of conjugated bile acids is mainly mediated by a Na+-dependent active transport system, that is, the sodium-dependent taurocholate cotransporting polypeptide or NTCP. However, a sodium-independent uptake can also occur, carried out by proteins of the family of organic anion transporting polypeptides or OATP, mainly OATP1B1 and OATP1B3.
The rate limiting step in the enterohepatic circulation is their canalicular secretion, largely mediated by the bile salt export pump or BSEP, in an ATP-dependent process. This pump carries monoanionic bile salts, which are the most abundant. Bile acids conjugated with glucuronic acid or sulfate, which are dianionic, are transported by different carriers, such as MRP2 and BCRP.
Note: Serum levels of bile acids vary on the basis of the rate of their reabsorption, and therefore they are higher during meals, when the enterohepatic circulation is more active.
Intestinal metabolism
Bile acids which escape ileal absorption pass into the colon where they partly undergo modifications by intestinal microbiota and are converted to secondary bile acids.
The main reactions are listed below.
Deconjugation
On the side chain, hydrolysis of the C24 N-acyl amide bond can occur, with release of unconjugated bile acids and glycine or taurine. This reaction is catalyzed by bacterial hydrolases present both in the small intestine and in the colon.
7alpha-Dehydroxylation
Quantitatively, it is the most important reaction, carried out by colonic bacterial dehydratases that remove the hydroxyl group at position 7 to form 7-deoxy bile acids. In particular, deoxycholic acid is formed from cholic acid, and lithocholic acid, a toxic secondary bile acid, from chenodeoxycholic acid.
It should be noted that 7alpha-dehydroxylation, unlike oxidation and epimerization, can only occur on unconjugated bile acids, and therefore, deconjugation is an essential prerequisite.
Oxidation and epimerization
They are reactions involving the hydroxyl groups at positions 3, 7 and 12, catalyzed by bacterial hydroxysteroid dehydrogenases. For example, ursodeoxycholic acid derives from the epimerization of chenodeoxycholic acid.
Intestinal Metabolism of Bile Acids
Some of the secondary bile acids are then reabsorbed from the colon and return to the liver. In the hepatocytes, they are reconjugated, if necessary, and resecreted. Those that are not reabsorbed, are excreted in the feces.
Whereas oxidations and deconjugations are carried out by a broad spectrum of anaerobic bacteria, 7alpha-dehydroxylations is carried out by a limited number of colonic anaerobes.
7alpha-Dehydroxylations and deconjugations increase the pKa of the bile acids, and therefore their hydrophobicity, allowing a certain degree of passive absorption across the colonic wall.
The increase of hydrophobicity is also associated with an increased toxicity of these molecules. And a high concentration of secondary bile acids in the bile, blood, and feces has been associated to the pathogenesis of colon cancer.
Soluble fibers and reabsorption
The reabsorption of bile salts can be reduced by chelating action of soluble fibers, such as those found in fresh fruits, legumes, oats and oat bran, which bind them, decreasing their uptake. In turn, this increases bile acid de novo synthesis, up-regulating the expression of the 7alpha-hydroxylase and sterol 12alpha-hydroxylase, and thereby reduces hepatocyte cholesterol concentration.
The depletion of hepatic cholesterol increases the expression of the LDL receptor, and thus reduces plasma concentration of LDL cholesterol. On the other hand, it also stimulates the synthesis of HMG-CoA reductase, the key enzyme in cholesterol biosynthesis.
Note: Some anti-cholesterol drugs act by binding bile acids in the intestine, thereby preventing their reabsorption.
Synthesis
Quantitatively, bile acids are the major product of cholesterol metabolism.
As previously said, enterohepatic circulation and their de novo synthesis maintain a constant bile acid pool size. In particular, de novo synthesis allows the replacement of bile salts excreted in the faces, about 5-10 percent of the body pool, namely ~ 0.5 g/day.
Below, the synthesis of cholic acid and chenodeoxycholic acid, and their conjugation with the amino acids taurine and glycine, is described.
There are two main pathways for bile acid synthesis: the classical pathway and the alternative pathway. In addition, some other minor pathways will also be described.
De Novo Synthesis of Primary Bile Acids and Their Conjugates
The classical or neutral pathway
In humans, up to 90 percent of bile salts are produced via the classical pathway, also referred to as “neutral” pathway since intermediates are neutral molecules.
It is a metabolic pathway present only in the liver, that consists of reactions catalyzed by enzymes localized in the cytosol, endoplasmic reticulum, peroxisomes, and mitochondria, and whose end products are the conjugates of cholic acid and chenodeoxycholic acid.
The first reaction is the hydroxylation at position 7 of cholesterol, to form 7alpha-hydroxycholesterol. The reaction is catalyzed by cholesterol 7alpha-hydroxylase or CYP7A1 (E.C. 1.14.14.23). It is an enzyme localized in the endoplasmic reticulum, and catalyzes the rate-limiting step of the pathway.
7alpha-Hydroxycholesterol undergoes oxidation of the 3beta-hydroxyl group and the shift of the double bond from the 5,6 position to the 4,5 position, to form 7alpha-hydroxy-4-cholesten-3-one. The reaction is catalyzed by 3beta-hydroxy-Δ5-C27-steroid oxidoreductase or HSD3B7 (E.C. 1.1.1.181), an enzyme localized in the endoplasmic reticulum.
7alpha-Hydroxy-4-cholesten-3-one can follow two routes:
to enter the pathway that leads to the synthesis of cholic acid, through the reaction catalyzed by 7alpha-hydroxy-4-cholesten-3-one12alpha-monooxygenase or sterol 12alpha-hydroxylase or CYP8B1 (E.C. 1.14.18.8), an enzyme localized in the endoplasmic reticulum;
to enter the pathway that leads the synthesis of chenodeoxycholic acid, through the reaction catalyzed by 3-oxo-Δ4-steroid 5beta-reductase or AKR1D1 (E.C. 1.3.1.3), a cytosolic enzyme.
It should be underlined that the activity of sterol 12alpha-hydroxylase determines the ratio of cholic acid to chenodeoxycholic acid, and, ultimately, the detergent capacity of bile acid pool. And in fact, the regulation of sterol 12alpha-hydroxylase gene transcription is one of the main regulatory step of the classical pathway.
Therefore, if 7alpha-hydroxy-4-cholesten-3-one proceeds via the reaction catalyzed by sterol 12alpha-hydroxylase, the following reactions will occur.
7alpha-Hydroxy-4-cholesten-3-one is hydroxylated at position 12 by sterol 12alpha-hydroxylase, to form 7alpha,12alpha-dihydroxy-4-cholesten-3-one.
7alpha,12alpha-Dihydroxy-4-cholesten-3-one undergoes reduction of the double bond at 4,5 position, in the reaction catalyzed by 3-oxo-Δ4-steroid5beta-reductase, to form 5beta-cholestan-7alpha,12alpha-diol-3-one.
5beta-Cholestan-7alpha,12alpha-diol-3-one undergoes reduction of the hydroxyl group at position 4, in the reaction catalyzed by 3 alpha-hydroxysteroid dehydrogenase or AKR1C4 (EC 1.1.1.213), a cytosolic enzyme, to form 5beta-cholestan-3 alpha,7alpha,12alpha-triol.
5beta-Cholestan-3alpha,7alpha,12alpha-triol undergoes oxidation of the side chain via three reactions catalyzed by sterol 27-hydroxylase or CYP27A1 (EC 1.14.15.15). It is a mitochondrial enzyme also present in extrahepatic tissues and macrophages, which introduces a hydroxyl group at position 27. The hydroxyl group is oxidized to aldehyde, and then to carboxylic acid, to form 3 alpha,7 alpha,12 alpha-trihydroxy-5 beta-cholestanoic acid.
3alpha,7alpha,12alpha-Trihydroxy-5beta-cholestanoic acid is activated to its coenzyme A ester, 3alpha,7alpha,12alpha-trihydroxy-5beta-cholestanoyl-CoA, in the reaction catalyzed by either very long chain acyl-CoA synthetase or VLCS (EC 6.2.1.-), or bile acid CoA synthetase or BACS (EC 6.2.1.7), both localized in the endoplasmic reticulum.
3alpha,7alpha,12alpha-Trihydroxy-5beta-cholestanoyl-CoA is transported to peroxisomes where it undergoes five successive reactions, each catalyzed by a different enzyme. In the last two reactions, the side chain is shortened to four carbon atoms, and finally cholylCoA is formed.
In the last step, the conjugation, via amide bond, of the carboxylic acid group of the side chain with the amino acid glycine or taurine occurs. The reaction is catalyzed by bile acid-CoA:amino acid N-acyltransferase or the BAAT (EC 2.3.1.65), which is predominantly localized in peroxisomes.
The reaction products are thus the conjugated bile acids: glycocholic acid and taurocholic acid.
If 7alpha-hydroxy-4-cholesten-3-one does not proceed via the reaction catalyzed by sterol 12alpha-hydroxylase, it enters the pathway that leads to the synthesis of chenodeoxycholic acid conjugates, through the reactions described below.
7alpha-Hydroxy-4-cholesten-3-one is converted to 7alpha-hydroxy-5beta-cholestan-3-one in the reaction catalyzed by 3-oxo-Δ4-steroid 5 beta-reductase.
7alpha-Hydroxy-5beta-cholestan-3-one is converted to 5beta-cholestan-3alpha,7alpha-diol in the reaction catalyzed by 3alpha-hydroxysteroid dehydrogenase.
Then, the conjugated bile acids glycochenodeoxycholic acid and taurochenodeoxycholic acid are formed by modifications similar to those seen for the conjugation of cholic acid, and catalyzed mostly by the same enzymes.
Note: Unconjugated bile acids formed in the intestine must reach the liver to be reconjugated.
The alternative or acidic pathway
It is prevalent in the fetus and neonate, whereas in adults it leads to the synthesis of less than 10 percent of the bile salts.
This pathway differs from the classical pathway in that:
the intermediate products are acidic molecules, from which the alternative name “acidic pathway”;
the oxidation of the side chain is followed by modifications of the steroid nucleus, and not vice versa;
the final products are conjugates of chenodeoxycholic acid.
The first step involves the conversion of cholesterol into 27-hydroxycholesterol in the reaction catalyzed by sterol 27-hydroxylase.
27-Hydroxycholesterol can follow two routes.
Route A
27-hydroxycholesterol is converted to 3beta-hydroxy-5-cholestenoic acid in a reaction catalyzed by sterol 27-hydroxylase.
3beta-Hydroxy-5-cholestenoic acid is hydroxylated at position 7 in the reaction catalyzed by oxysterol 7alpha-hydroxylase or CYP7B1 (EC 1.14.13.100), an enzyme localized in the endoplasmic reticulum, to form 3beta-7alpha-dihydroxy-5-colestenoic acid.
3beta-7alpha-Dihydroxy-5-cholestenoic acid is converted to 3-oxo-7alpha-hydroxy-4-cholestenoic acid, in the reaction catalyzed by 3beta-hydroxy-Δ5-C27-steroid oxidoreductase.
3-Oxo-7alpha-hydroxy-4-cholestenoic acid, as a result of side chain modifications, forms chenodeoxycholic acid, and then its conjugates.
Route B
27-Hydroxycholesterol is converted to 7alpha,27-dihydroxycholesterol in the reaction catalyzed by oxysterol 7alpha-hydroxylase and cholesterol 7alpha-hydroxylase.
7alpha,27-Dihydroxycholesterol is converted to 7alpha,26-dihydroxy-4-cholesten-3-one in the reaction catalyzed by 3beta-hydroxy-Δ5-C27-steroid oxidoreductase;
7alpha, 26-Dihydroxy-4-cholesten-3-one can be transformed directly to conjugates of chenodeoxycholic acid, or can be converted to 3-oxo-7alpha-hydroxy-4-colestenoic acid, and then undergo side chain modifications and other reactions that lead to the synthesis of the conjugates of chenodeoxycholic acid.
Minor pathways
There are also minor pathways that contribute to bile salt synthesis, although to a lesser extent than classical and alternative pathways.
For example:
A cholesterol 25-hydroxylase (EC 1.14.99.38) is expressed in the liver.
A cholesterol 24-hydroxylase or CYP46A1 (EC 1.14.14.25) is expressed in the brain, and therefore, although the organ cannot export cholesterol, it exports oxysterols.
A nonspecific 7alpha-hydroxylase has also been discovered. It is expressed in all tissues and appears to be involved in the generation of oxysterols, which may be transported to hepatocytes to be converted to chenodeoxycholic acid.
Additionally, sterol 27-hydroxylase is expressed in various tissues, and therefore its reaction products must be transported to the liver to be converted to bile salts.
Bile salts: regulation of synthesis
Regulation of bile acid synthesis occurs via a negative feedback mechanism, particularly on the expression of cholesterol 7alpha-hydroxylase and sterol 12alpha-hydroxylase.
When an excess of bile acids, both free and conjugated, occurs, these molecules bind to the nuclear receptor farnesoid X receptor or FRX, activating it: the most efficacious bile acid is chenodeoxycholic acid, while others, such as ursodeoxycholic acid, do not activate it.
FRX induces the expression of the transcriptional repressor small heterodimer partner or SHP, which in turn interacts with other transcription factors, such as liver receptor homolog-1 or LRH-1, and hepatocyte nuclear factor-4alpha or HNF-4alpha. These transcription factors bind to a sequence in the promoter region of 7alpha-hydroxylase and 12alpha-hydroxylase genes, region called bile acid response elements or BAREs, inhibiting their transcription.
One of the reasons why bile salt synthesis is tightly regulated is because many of their metabolites are toxic.
References
Chiang J.Y.L. Bile acids: regulation of synthesis. J Lipid Res 2009;50(10):1955-1966. doi:10.1194/jlr.R900010-JLR200
Gropper S.S., Smith J.L. Advanced nutrition and human metabolism. 6th Edition. Cengage Learning, 2012
Moghimipour E., Ameri A., and Handali S. Absorption-enhancing effects of bile salts. Molecules 2015;20(8); 14451-14473. doi:10.3390/molecules200814451
Monte M.J., Marin J.J.G., Antelo A., Vazquez-Tato J. Bile acids: Chemistry, physiology, and pathophysiology. World J Gastroenterol 2009;15(7):804-816. doi:10.3748/wjg.15.804
Rosenthal M.D., Glew R.H. Medical biochemistry – Human metabolism in health and disease. John Wiley J. & Sons, Inc., Publication, 2009
Sundaram S.S., Bove K.E., Lovell M.A. and Sokol R.J. Mechanisms of Disease: inborn errors of bile acid synthesis. Nat Clin Pract Gastroenterol Hepatol 2008;5(8):456-468. doi:10.1038/ncpgasthep1179
The human gastrointestinal tract is one of the most fierce and competitive ecological niches. It harbors viruses, eukaryotes, bacteria, and one member of Archaebacteria, Methanobrevibacter smithii.
Bacteria vary in proportion and amount all along the gastrointestinal tract; the greatest amount is found in the colon, which contains over 400 different species belonging to 9 phyla or divisions, of the 30 recognized phyla, hereafter referred as gut microbiota, which in turn is part of the larger human microbiota.
These are the phyla and some of their most represented genera.
Actinobacteria, Gram-positive bacteria; Bifidobacterium, Collinsella, Eggerthella, and Propionibacterium.
Bacteroidetes, Gram-negative bacteria; more than 20 genera including Bacteroides, Prevotella and Corynebacterium.
Cyanobacteria, Gram-negative bacteria.
Firmicutes, Gram-positive bacteria; at least 250 genera, including Mycoplasma, Bacillus, Clostridium, Dorea, Faecalibacterium, Ruminococcus, Eubacterium, Staphylococcus, Streptococcus, Lactobacillus, Lactococcus, Enterococcus, Sporobacter, and Roseburia.
The presence of a small subset of the bacterial world in the colon is the result of a strong selective pressure which acted, during evolution, on both the microbial colonizers, selecting organisms very well adapted to this environment, and the intestinal niche. And nevertheless, each individual harbors an unique bacterial community in his gut.
Despite the high variability existing both with regard to taxa and between individuals, it has been proposed, but not accepted by all researchers, that in most adults the bacterial gut microbiota can be classified into variants or “enterotypes”, on the basis of the ratio of the abundance of the genera Bacteroides and Prevotella. This seems to indicate that there is a limited number of well balanced symbiotic states, which could respond differently to factors such as diet, age, genetics, and drug intake.
Adult’s gut harbors a large and diverse community of DNA and RNA viruses made up of about 2,000 different genotypes, none of which is dominant. Indeed, the most abundant virus accounts for only about 6 percent of the community, whereas in infants the most abundant virus accounts over 40 percent of the community. The majority of DNA viruses are bacteriophages or phages, that is, viruses that infect bacteria. They are the most abundant biological entity on earth, with an estimated population of about 1031 units, whereas the majority of RNA viruses are plant viruses.
Factors affecting gut microbiota composition and development
The intestinal bacterial community is regulated by several factors, most of which are listed below.
The diet of the host.
It seems to be the most important factor.
Traditionally considered sterile, mother’s milk harbors a rich microbiota consisting of more than 700 species, dominated by staphylococci, streptococci, bifidobacteria and lactic acid bacteria. Therefore, it is a major source for the colonization of the breastfed infant gut, and it was suggested that this mode of colonization is closely correlated with infant’s health status, because, among other functions, it could protect against infections and contribute to the maturation of the immune system. Breast milk affects intestinal microbiota also indirectly, through the presence of oligosaccharides with prebiotic activity that stimulate the growth of specific bacterial groups including staphylococci and bifidobacteria.
A recent study has compared the intestinal microbiota of European and African children, respectively from Florence and a rural village in Burkina Faso, between the ages of 1 and 6 years old. It has highlighted the dominant role of diet over variables such as climate, geography, hygiene and health services; it was also observed the absence of significant differences in the expression of key genes regulating the immune function, which suggests a functional similarity between the two groups. Indeed infants, as long as they are breastfed, have a very similar gut microbiota, rich in Actinobacteria, mainly Bifidobacterium.
The subsequent introduction of solid foods in the two groups, a Western diet rich in animal fats and proteins in European children, and low in animal proteins but rich in complex carbohydrates in African children, leads to a differentiation in the Firmicutes/Bacteroidetes ratio between the two groups. Gram-positive bacteria, mainly Firmicutes, were more abundant than Gram-negative bacteria in European children, whereas Gram-negative bacteria, mainly Bacteroidetes, prevailed over Gram-positive bacteria in African children.
And the long-term diets are strongly associated to the enterotype partitioning. Indeed, it has been observed that:
a diet high in animal fats and proteins, i.e. a Western-type diet, leads to a gut microbiota dominated by the Bacteroides enterotype;
a diet high in complex carbohydrates, typical of agrarian societies, leads to the prevalence of the Prevotella enterotype.
Similar results emerged from the aforementioned study on children. In the Europeans, gut microbiota was dominated by taxa typical of Bacteroides enterotype, whereas in the Burkina Faso children, Prevotella enterotype dominates.
With short-term changes in the diet, 10 days, such as the switch from a low-fat and high-fiber diet to a high-fat and low-fiber diet and vice versa, changes were observed in the composition of the microbiome, within 24 hours, but no stable change in the enterotype partitioning. And this underlines as a long-term diet is needed for a change in the enterotypes of the gut microbiota.
Dietary interventions can also result in changes in the gut virome, which moves to a new state, that is, changes occur in the proportions of the pre-existing viral populations, towards which subjects on the same diet converge.
pH, bile salts and digestive enzymes.
The stomach, due to its low pH, is a hostile environment for bacteria, which are not present in high numbers, about 102-103 bacterial cells/gram of tissue. In addition to Helicobacter pylori, able to cause gastritis and gastric ulcers, microorganisms of the genus Lactobacillus are also present.
Reached the duodenum, an increase in bacterial cell number occurs, 104-105 bacterial cells/gram of tissue; and similar bacterial concentrations are present in the jejunum and proximal ileum. The low number of microorganisms present in the small intestine is due to the inhospitable environment, consequent to the fact that there is the opening of the ampulla of Vater in the descending part of the duodenum, which pours pancreatic juice and bile into the duodenum, that is, pancreatic enzymes and bile salts, which damage microorganisms.
In the terminal portion of the ileum, where the activities of pancreatic enzymes and bile salts are lower, there are about 107 bacterial cells/gram of tissue, and up to 1012-1014 bacterial cells/gram of tissue in the colon, so that bacteria represent a large proportion, about 40 percent, of the fecal mass.
The distribution of bacteria along the intestine is strategic. In the duodenum and jejunum, the amount of available nutrients is much higher than that found in the terminal portion of the ileum, where just water, fiber, and electrolytes remain. Therefore, the presence of large number of bacteria in the terminal portion of the ileum, and even more in the colon, is not a problem. The problem would be to find a high bacterial concentration in the duodenum, jejunum, and proximal parts of the ileum; and there is a disease condition, called small intestinal bacterial overgrowth or SIBO, in which the number of bacteria in the small intestine increases by about 10-15 times. This puts them in a position to compete with the host for nutrients and give rise to gastrointestinal disturbances such as diarrhea.
The geographical position and the resulting differences in lifestyle, diet, religion etc.
For example, a kind of geographical gradient occurs in the microbiota of European infants, with a higher number of Bifidobacterium species and some of Clostridium in Northern infants, whereas Southern infants have higher levels of Bacteroides, Lactobacillus and Eubacterium.
The mode of delivery.
The genetics of the host.
The health status of the infant and mother.
For example, in mothers with inflammatory bowel disease or IBD, Faecalibacterium prausnitzii, a bacterium that produces butyric acid, an important source of energy for intestinal cells, and with anti-inflammatory activity is depleted, whereas there is an increase in the number of adherent Escherichia coli.
The treatment with antibiotics.
Bacterial infections and predators.
Bacteriocins, i.e. proteins with antibacterial activity, and bacteriophages.
Phages play an important role in controlling the abundance and composition of the gut microbiota. In particular, they could play a major role in the colonization of the newborn, infecting the dominant bacteria thus allowing to another bacterial strain to become abundant.
This model of predator-prey dynamics, called “kill the winner”, suggests that the blooms of a specific bacterial species would lead to blooms of their corresponding bacteriophages, followed by a decline in their abundance. Therefore, the most abundant bacteriophage genotype will not be the same at different times. And although some the gene sequences present in the infant gut virome are stable over the first three months of life, dramatic changes occur in the overall composition of the viral community between the first and second week of life. During this time period also the bacterial community is extremely dynamic.
The competition for space and nutrients.
Composition throughout life
The development of the intestinal microbial ecosystem is a complex and crucial event in human life, highly variable from individual to individual, and influenced by the factors outlined above.
Development and Modification of Intestinal Microflora
In utero, the gut is considered sterile, but is rapidly colonized by microbes at birth, as the infant is born with an immunological tolerance instructed by the mother.
However, recent studies show the presence of bacteria in the placental tissue, umbilical cord blood, fetal membranes and amniotic fluid from healthy newborns without signs of infection or inflammation. And for example, the meconium of premature infants, born to healthy mothers, contains a specific microbiota, with Firmicutes as the main phylum, and predominance of staphylococci, whereas Proteobacteria, in particular species such as Escherichia coli, Klebsiella pneumoniae, Serratia marcescens, but also enterococci are more abundant in the faeces.
Note: The meconium is free of detectable viruses.
It seems that both vaginal and gut bacteria may gain access to the fetus, although via different route of entry: by ascending entry the vaginal ones, by dendritic cells of the immune system the gut ones. Therefore, there could exist a fetal microbiota.
Colonization occurs during delivery by a maternal inoculum, generally composed of aerobic and facultative bacteria (the newborn’s gut initially contains oxygen), then replaced by obligate anaerobes, bacteria typically present in adulthood, to which they have created a hospitable environment.
Furthermore, there is a small number of different taxa, with a relative dominance of the phyla Actinobacteria and Proteobacteria, that remains unchanged during the first month of life, but not in the subsequent ones as there is a large increase in variability and new genetic variants. Many studies underline that the initial exposure is important in defining the “trajectories” which will lead to the adult ecosystems. Additionally, these initial communities may act as a source of protective or pathogenic microorganisms.
Mother’s vaginal and fecal microbiotas are the main sources of inoculum in vaginally delivered infants. Indeed, infants harbor microbial communities dominated by species of the genera Lactobacillus, the most abundant genus in the vaginal microbiota and early gut microbiota, Bifidobacterium, Prevotella, or Sneathia. And it seems likely that anaerobes, such as members of the phyla Firmicutes and Bacteroidetes, not growing outside of their host, rely on the close contact between mother and offspring for transmission. Finally, due to the presence of oxygen in infant gut, the transmission of strict anaerobes could occur not directly at birth but at a later stage by means of spores.
The first bacteria encountered by infants born by caesarean section are those of the skin and hospital environment, and gut microbiota is dominated by species of the genera Corynebacterium, Staphylococcus and Propionibacterium, with a lower bacterial count and diversity in first weeks of life than infants born vaginally.
Further evidence supporting the hypothesis of vertical transmission is the similarity between the microbiota of meconium and samples obtained from possible sites of contamination.
These “maternal bacteria” do not persist indefinitely, and are replaced by other populations within the first year of life.
Objects, animals, mouths and skin of relatives, and breast milk are secondary sources of inoculum; and breast milk seems to have a primary role in determining the microbial succession in the gut.
The variation and diversity among children reflect instead the individuality of these microbial exposures.
Note: The delivery mode seems also to influence the immune system during the first year of life, perhaps via the influence on the development of gut microbiota. Infants born by cesarean section have:
a lower bacterial count in stool samples at one month of age, mainly due to the higher number of bifidobacteria in infants born vaginally;
a higher number of antibody secreting cells, which could reflect an excessive antigen exposure (the intestinal barrier would be more vulnerable to the passage of antigens).
Within a days after birth, a thriving community is established. This community is less stable over time and more variable in composition than that of adults. Very soon, it will be more numerous than that of the child’s cells, evolving according to a temporal pattern highly variable from individual to individual.
Viruses, absent at birth, reach about 108 units/gram wet weight of faeces by the end of the first week of life, therefore representing a dynamic and abundant component of the developing gut microbiota. However, viral community has an extremely low diversity, like bacteria, and is dominated by phages, which probably influence the abundance and diversity of co-occurring bacteria, as seen above. The initial source of the viruses is unknown; of course, maternal and/or environmental inocula are among the possibilities. Notably, the earliest viruses could be the result of induction of prophages from the “newborn” gut bacterial flora, hypothesis supported by the observation that more than 25 percent of the phage sequences seem to be very similar to those of phages infecting bacteria such as Lactococcus, Lactobacillus, Enterococcus, and Streptococcus, which are abundant in breast milk.
By the end of the first month of life it is thought that the initial phase of rapid acquisition of microorganism is over.
In 1-month-old-infants, the most abundant bacteria belong to the genera Bacteroides and Escherichia, whereas Bifidobacterium, along with Ruminococcus, appear and grow to become dominant in the gastrointestinal tract of the breastfed infants between 1 and 11 months. Bifidobacteria such as Bifidobacterium longum subspecies infantis:
are known to be closely related to breastfeeding;
are among the best characterized commensal bacteria;
are considered probiotics, that is, microorganisms which can confer health benefits to the host.
Their abundance confers also benefits through competitive exclusion, that is, they are an obstacle to colonization by pathogens. And indeed, Escherichia and Bacteroides can become preponderant if Bifidobacterium is not adequately present in the gut.
In contrast, bacteria of the genera Escherichia, such as E. coli), Clostridium, such as C. difficile, Bacteroides, such as B. fragilis, and Lactobacillus are present in higher levels in formula-fed infants than in breastfed infants.
Although breast-fed infants receive only breast milk until weaning, their microbiota can show a large variability in the abundances of bacterial taxa, with differences between individuals also with regard to the temporal patterns of variation. These variations may be due to diseases, treatments with antibiotics, changes in host lifestyle, random colonization events, as well as differences in immune responses to the gut colonizing microbes. However, it is not yet clear how these factors contribute to shape infant gut microbiota.
It seems that also the virome changes rapidly after birth, as the majority of the viral sequences present in the first week of life are not found after the second week. Moreover, the repertoire expands rapidly in number and diversity during the first three months. This is in contrast with the stability observed in the adult virome, where 95% of the sequences are conserved over time.
In normal condition, towards the end of the first year of life, babies have consumed an adult-like diet for a significant time period and should have developed a microbial community with characteristics similar to those found in the adult gut, such as:
a more stable composition, phylogenetically more complex, and progressively more similar among different subjects;
a preponderance of Firmicutes and Bacteroidetes, followed by Verrucomicrobia and a very low abundance of Proteobacteria;
an increase in the levels of short-chain fatty acids, mainly acetic acid, propionic acid and butyric acid, and bacterial load in the feces;
an increase of genes associated with xenobiotic degradation, vitamin biosynthesis, and carbohydrate utilization.
Interestingly, the significant turnover of taxa occurring from birth to the end of the first year is accompanied by a remarkable constancy in the overall functional capabilities.
Towards the end of the first year of life also the early viral colonizers were replaced by a community specific to the child.
The gut microbiota reaches maturity at about 2.5 years of age, fully resembling the adult gut microbiota.
The selection of the most adapted bacteria is the result of various factors.
The transition to an adult diet.
An increased fitness to the intestinal environment of the taxa that typically dominate the adult gut microbiota than the early colonizers.
The significant changes in the intestinal environment, result of the developmental changes in the intestinal mucosa.
The effects of the microbiota itself.
Therefore, the first 2-3 years of life are the most critical period in which you can intervene to shape the microbiota as best as possible, and so optimize child growth and development.
From a chaotic beginning, all this leads to the establishment of the gut ecosystem typical of the young adult, which is relatively stable over time until old age, viral, archaeal and eukaryotic components included, and dominated, at least in the western population, by members of the phyla Firmicutes, about 60% of the bacterial communities, Bacteroidetes and Actinobacteria, mainly belonging to the Bifidobacterium genus, each comprising about 10 percent of the bacterial community, followed by Proteobacteria and Verrucomicrobia. The genera Bacteroides, Clostridium, Faecalibacterium, Ruminococcus and Eubacterium make up, together with Methanobrevibacter smithii, the large majority of the adult gut microbial community.
It should be noted that different data were obtained from analysis of populations of African rural areas, as seen above.
And the gut microbiota is sufficiently similar among subjects to allow the identification of a shared core microbiome.
Stability and resilience, however, are subject to numerous variables among which, as previously said, diet seems to be one of the most important. Therefore, in order to maintain the stability of the gut microbiota, the variables have to be kept constant, or in the case of diseases prevented, also through vaccinations. However, the stability and resilience could be harmful if the dominant community is pathogenic.
The gut microbiota undergoes substantial changes in the elderly. In a study conducted in Ireland on 161 healthy people aged 65 years and over, the gut microbiota is distinct from that of younger adults in the majority of subjects, with a composition that seems to be dominated by the phyla Bacteroidetes, the main ones, and Firmicutes, with almost inverted percentages than those found in younger adults, although large variations across subjects were observed. And there are Faecalibacterium, about 6 percent of the main genera, followed by species of the genera Ruminococcus, Roseburia and Bifidobacterium ,the latter about 0.4 percent, among the most abundant genera.
Also the variability in the composition of the community is greater than in younger adults; this could be due to the increase in morbidities associated with aging and the subsequent increased intake of medications, as well as to changes in the diet.
References
Breitbart M., Haynes M., Kelley S., Angly F., Edwards R.A., Felts B., Mahaffy J.M., Mueller J., Nulton J., Rayhawk S., Rodriguez-Brito B., Salamon P., Rohwer F. Viral diversity and dynamics in an infant gut. Res Microbiol 2008;159:367-373. doi:10.1016/j.resmic.2008.04.006
Claesson M.J., Cusack S., O’Sullivan O., Greene-Diniz R., de Weerd H., Flannery E., Marchesi J.R., Falush D., Dinan T., Fitzgerald G., et al. Composition, variability, and temporal stability of the intestinal microbiota of the elderly. Proc Natl Acad Sci USA 2011;108(Suppl 1);4586-4591. doi:10.1073/pnas.1000097107
Clemente J.C., Ursell L.K., Wegener Parfrey L., and Knight R. The impact of the gut microbiota on human health: an integrative view. Cell 2012;148:1258-1270. doi:10.1016/j.cell.2012.01.035
De Filippo c., Cavalieri D., Di Paola M., Ramazzotti M., Poullet J.B., Massart S., Collini S., Pieraccini G., and Lionetti P. Impact of diet in shaping gut microbiota revealed by a comparative study in children from Europe and rural Africa. Proc Natl Acad Sci 2010;107(33):14691-14696. doi:10.1073/pnas.1005963107
Dominguez-Bello M.G., Costello E.K., Contreras M., Magris M., Hidalgo G., Fierer N., and Knight R. Delivery mode shapes the acquisition and structure of the initial microbiota across multiple body habitats in newborns. Proc Natl Acad Sci 2010;107:11971-11975. doi:10.1073/pnas.1002601107
Fernández L., Langa S., Martín V., Maldonado A., Jiménez E., Martín R., Rodríguez J.M. The human milk microbiota: origin and potential roles in health and disease. Pharmacol Res 2013;69(1):1-10. doi:10.1073/pnas.1002601107
Huurre A., Kalliomäki M., Rautava S., Rinne M., Salminen S., and Isolauri E. Mode of delivery-effects on gut microbiota and humoral immunity. Neonatology 2008;93:236-240. doi:10.1159/000111102
Koenig J.E., Spor A., Scalfone N., Fricker A.D., Stombaugh J., Knight R., Angenent L.T., and Ley R.E. Succession of microbial consortia in the developing infant gut microbiome. Proc Natl Acad Sci 2011;108(1):4578-4585. doi:10.1073/pnas.1000081107
Ley R.E., Peterson D.A., and Gordon J.I. Ecological and evolutionary forces shaping microbial diversity in the human intestine. Cell 2006;124(4):837-848. doi:10.1016/j.cell.2006.02.017
Minot S., Sinha R., Chen J., Li H., Keilbaugh S.A., Wu G.D., Lewis J.D., and Bushman F.D. The human gut virome: inter-individual variation and dynamic response to diet. Genome Res 2011;21:1616-1625. doi:10.1101/gr.122705.111
Moreno-Indias I.M., Cardona F., Tinahones F.J. and Queipo-Ortuño M.I. Impact of the gut microbiota on the development of obesity and type 2 diabetes mellitus. Front Microbiol 2014;5(190):1-10. doi:10.3389/fmicb.2014.00190
Newburg D.S. & Morelli L. Human milk and infant intestinal mucosal glycans guide succession of the neonatal intestinal microbiota. Pediatr Res 2015;77:115-120. doi:10.1038/pr.2014.178
Palmer C., Bik E.M., DiGiulio D.B., Relman D.A., and Brown P.O. Development of the human infant intestinal microbiota. PLoS Biol 2007;5(7):e177. doi:10.1371/journal.pbio.0050177
Rodrıguez J.M., Murphy K., Stanton C., Ross R.P., I. Kober O.I., Juge N., Avershina E., Rudi K., Narbad A., Jenmalm M.C., Marchesi J.R. and Collado M.C. The composition of the gut microbiota throughout life, with an emphasis on early life. Microb Ecol Health Dis 2015;26:26050. doi:10.3402/mehd.v26.26050
Wu G.D., Chen J., Hoffmann C., Bittinger K., Chen Y.Y., Keilbaugh S.A., Bewtra M., Knights D., Walters W.A., Knight R., et al. Linking long-term dietary patterns with gut microbial enterotypes. Science 2011;334:105-108. doi:10.1126/science.1208344
It has been known for almost a century that humans harbor a microbial ecosystem, known as human microbiota, remarkably dense and diverse, made up of a number of viruses and cells much higher than those of the human body, and that accounts for one to three percent of body weight. All the genes encoded by the human body’s microbial ecosystem, which are about 1,000 times more numerous than those of our genome, make up the human microbiome. Microorganisms colonize all the surfaces of the body that are exposed to the environment. Indeed, distinct microbial communities are found on the skin, in the vagina, in the respiratory tract, and along the whole intestinal tract, from the mouth up to rectum, the last part of the intestine.
Bacteria, at least 100 trillion (1014) cells, a number ten times greater than that of the human body. They are found in very high concentration in the intestinal tract, up to 1012-1014/gram of tissue, where they form one of the most densely populated microbial habitats on Earth. In the gut, bacteria mainly belong to the Firmicutes, Bacteroidetes and Actinobacteria phyla. Fusobacteria (oropharynx), Tenericutes, Proteobacteria, and Verrucomicrobia are other phyla present in our body.
Note: Bacterial communities in a given body region resemble themselves much more across individuals than those from different body regions of the same individual; for example, bacterial communities of the upper respiratory tract are much more similar across individuals than those of the skin or intestine of the same individual.
Viruses, by far the most numerous organisms, about quadrillion units. The genomes of all the viruses harbored in the human body make up the human virome. In the past, viruses and eukaryotes have been studied focusing on pathogenic microorganisms, but in recent years the attention has also shifted on many non-pathogenic members of these groups. And many of the viral gene sequences found are new, which suggests that there is still much to learn about the human virome. Finally, just like for bacteria, there is considerable interpersonal variability.
Archaebacteria, primarily those belonging to the order Methanobacteriales, with Methanobrevibacter smithii predominant in the human gut (up to 10 percent of all anaerobes).
Eukaryotes, and the parasites of the genera Giardia and Entamoeba have probably been among the first to be identified. But there is also a great abundance and diversity of fungal species, belonging to genera such as Candida, Penicillium, Aspergillus, Hemispora, Fusarium, Geotrichum, Hormodendrum, Cryptococcus, Saccharomyces, and Blastocystis.
Based on the relationships with the human host, microorganisms may be classified as commensals or pathogens.
Commensals cause no harm to the host, with which they establish a symbiotic relationship that generally brings benefits to both.
On the contrary, pathogens are able to cause diseases, but fortunately represent a small percentage of the human microbiota. These microorganisms establish a symbiosis with the human host and benefit from it at the expense of the host. They can cause disease:
if they move from their niche, such as the intestine, into another one where they do not usually reside, such as the vagina or bladder, as in the case of Candida albicans, normally present in the intestine, but in very small quantities;
in patients with impaired immunological defenses, such as after an immunosuppressive therapy.
Function of the human microbiota
Sometimes referred to as “the forgotten organ”, human microbiota, mainly with its intestinal bacterial members, plays many important functions that can lead to nutritional, immunological, and developmental benefits, but can also cause diseases. Here are some examples.
It is involved in the development of the gastrointestinal system of the newborn, as shown by experiments carried out on germ-free animals in which, for example, the thickness of the intestinal mucosa is thinner than that of colonized animals, therefore more easily subject to rupture.
It contributes to energy harvest from nutrients, due to its ability to ferment indigestible carbohydrates, promote the absorption of monosaccharides and the storage of the derived energy. This has probably been a very strong evolutionary force that has played a major role in favor of the fact that these bacteria became our symbionts.
It contributes to the maintenance of the acidic pH of the skin and in the colon.
It is involved in the metabolism of xenobiotics and several polyphenols.
It improves water and mineral absorption in the colon.
It increases the speed of intestinal transit, slower in germ-free animals.
It has an important role in resistance to colonization by pathogens, primarily in the vagina and gut.
It is involved in the biosynthesis of isoprenoids and vitamins through the methylerythritol phosphate pathway.
It stimulates angiogenesis.
In the intestinal tract, it interacts with the immune system, providing signals for promoting the maturation of immune cells and the normal development of immune functions. And this is perhaps the most important effect of the symbiosis between the human host and microorganisms. Experiments carried out on germ-free animals have shown, for example, that:
macrophages, the cells that engulf pathogens and then present their antigens to the immune system, are found in much smaller amounts than those present in the colonized intestine, and if placed in the presence of bacteria they fail to find and therefore engulf them, unlike macrophages extracted from a colonized intestine;
there is not the chronic non-specific inflammation, present in the normal intestine as a result of the presence of bacteria (and of what we eat).
Changes in its composition can contribute to the development of obesity and metabolic syndrome.
It protects against the development of type I diabetes.
Many diseases, both in children and adults, such as stomach cancer, lymphoma of mucosa-associated lymphoid tissue, necrotizing enterocolitis, an important cause of morbidity and mortality in premature babies, or chronic intestinal diseases, are, and others seem to be, related to the gut microbiota.
In conclusion, it seems very likely that the human body represents a superorganism, result of years of evolution and made up of human cells, and the resulting metabolic and physiological capacities, as well as an additional organ, the microbiota.
Human Microbiome Project
The bacterial component of the human microbiota is the subject of most studies including a large-scale project started in 2008 called “Human Microbiome Project”, whose aim is to characterize the microbiome associated with multiple body sites, such as the skin, mouth, nose, vagina and intestine, in 242 healthy adults.
These studies have shown a great variability in the composition of the human microbiota; for example, twins share less than 50 percent of their bacterial taxa at the species level, and an even smaller percentage of viruses. The factors that shape the composition of bacterial communities begin to be understood: for example, the genetic characteristics of the host play an important, although this is not true for the viral community. And metagenomic studies have shown that, despite the great interpersonal variability in microbial community composition, there is a core of shared genes encoding signaling and metabolic pathways. It appears namely that the assembly and the structure of the microbial community does not occur according to the species but the more functional set of genes. Therefore, disease states of these communities might be better identified by atypical distribution of functional classes of genes.
Effect of antibiotics
The microbiota in healthy adult humans is generally stable over time. However, its composition can be altered by factors such as dietary changes, urbanization, travel, and especially the use of broad-spectrum antibiotics. Here are some examples of the effect of antibiotic treatments.
There is a long-term reduction in microbial diversity.
The taxa affected vary from individual to individual, even up to a third of the taxa.
Several taxa do not recover even after 6 months from treatment.
Once the bacterial communities have reshaped, a reduced resistance to colonization occurs. This allows foreign and/or pathogen bacteria, able to grow more than the commensals, to cause permanent changes in human microbiota structure, as well as acute diseases, such as the dangerous pseudomembranous colitis, and chronic diseases, as it is suspected for asthma following the use and abuse of antibiotics in childhood. Moreover, their repeated use has been suggested to increase the pool of antibiotic-resistance genes in our microbiome. In support of this hypothesis, a decrease in the number of antibiotic-resistant pathogens has been observed in some European countries following the reduction in the number of antibiotics prescribed.
Finally, you must not underestimate the fact that the intestinal microflora is involved in many chemical transformations, and its alteration could be implicated in the development of cancer and obesity. However, regarding use of antibiotics, you should be underlined that if western population has a life expectancy higher than in the past is also because you do not die of infectious diseases!
References
Burke C., Steinberg P., Rusch D., Kjelleberg S., and Thomas T. Bacterial community assembly based on functional genes rather than species. Proc Natl Acad Sci USA 2011;108:14288-14293. doi:10.1073/pnas.1101591108
Clemente J.C., Ursell L.K., Wegener Parfrey L., and Knight R. The impact of the gut microbiota on human health: an integrative view. Cell 2012;148:1258-1270. doi:10.1016/j.cell.2012.01.035
Gill S.R., Pop M., Deboy R.T., Eckburg P.B., Turnbaugh P.J., Samuel B.S., Gordon J.I., Relman D.A., Fraser-Liggett C.M., and Nelson K.E. Metagenomic analysis of the human distal gut microbiome. Science 2006;312:1355-1359. doi:10.1126/science.1124234
Palmer C., Bik E.M., DiGiulio D.B., Relman D.A., and Brown P.O. Development of the human infant intestinal microbiota. PLoS Biol 2007;5(7):e177. doi:10.1371/journal.pbio.0050177
Turnbaugh P.J., Gordon J.I. The core gut microbiome, energy balance and obesity. J Physiol 2009;587:4153-4158. doi:10.1113/jphysiol.2009.174136
Zhang, T., Breitbart, M., Lee, W., Run, J.-Q., Wei, C., Soh, S., Hibberd, M., Liu, E., Rohwer, F., Ruan, Y. Prevalence of plant viruses in the RNA viral community of human feces. PLoS Biol 2006;4(1):e3. doi:10.1371/journal.pbio.0040003
Flavonoid biosynthesis, probably the best characterized pathway of plant secondary metabolism, is part of the phenylpropanoid pathway that, in addition to flavonoids, leads to the formation of a wide range of phenolic compounds, such as hydroxycinnamic acids, stilbenes, lignans and lignins.
Flavonoid biosynthesis is linked to primary metabolism through both mitochondria- and plastid-derived molecules. Since it seems that most of the involved enzymes characterized to date operate in protein complexes located in the cell cytosol, these molecules must be exported to the cytoplasm to be used.
The end products are transported to different intracellular or extracellular locations, with flavonoids involved in pigmentation usually transported into the vacuoles.
The biosynthesis of this group of polyphenols requires one p-coumaroyl-CoA and three malonyl-CoA molecules as initial substrates.
p-Coumaroyl-CoA is the pivotal branch-point metabolite in the phenylpropanoid pathway, being the precursor of a wide variety of phenolic compounds, both flavonoid and non-flavonoid polyphenols.
It is produced from phenylalanine via three reactions catalyzed by cytosolic enzymes collectively called group I or early-acting enzymes, in order of action:
phenylalanine ammonia lyase (EC 4.3.1.24);
trans-cinnamate 4-monooxygenase (EC:1.14.14.91);
4-coumarate-CoA ligase (EC 6.2.1.12).
Biosynthesis of p-coumaroyl-CoA
They seems to be associated in a multienzyme complex anchored to the endoplasmic reticulum membrane. The anchoring is probably ensured by cinnamate 4-hydroxylase that inserts its N-terminal domain into the membrane of the endoplasmic reticulum itself. These complexes, referred to as “metabolons”, allow the product of a reaction to be channeled directly as substrate to the active site of the enzyme that catalyzes the consecutive reaction in the metabolic pathway.
With the exception of cinnamate 4-hydroxylase, the enzymes which act downstream of phenylalanine ammonia lyase are encoded by small gene families in all species analyzed so far.
The different isoenzymes show distinct temporal, tissue, and elicitor-induced patterns of expression. It seems, in fact, that each member of each family can be used mainly for the synthesis of a specific compound, thus acting as a control point for carbon flux among the metabolic pathways leading to lignan, lignin, and flavonoid biosynthesis.
Note: Phenylalanine is a product of the shikimic acid pathway, which converts simple precursors derived from the metabolism of carbohydrates, phosphoenolpyruvate and erythrose-4-phosphate, intermediates of glycolysis and the pentose phosphate pathway, respectively, into the aromatic amino acids phenylalanine, tyrosine and tryptophan. Unlike plants and microorganisms, animals do not possess the shikimic acid pathway, and are not able to synthesize the three above-mentioned amino acids, which are therefore essential nutrients.
Phenylalanine ammonia lyase (PAL)
It is one of the most studied and best characterized enzymes of plant secondary metabolism. It requires no cofactors and catalyzes the reaction that links primary and secondary metabolism: the reversible deamination of phenylalanine to trans-cinnamic acid, with the release of nitrogen as ammonia and introduction of a trans double bond between carbon atoms 7 and 8 of the side chain.
Phenylalanine ⇄ trans-Cinnamic Acid + NH3
Therefore, it directs the flow of carbon from the shikimic acid pathway to the different branches of the phenylpropanoid pathway. The released ammonia is probably fixed in the reaction catalyzed by glutamine synthetase.
The enzyme from monocots is also able to act as tyrosine ammonia lyase (EC 4.3.1.25), converting tyrosine to p-coumaric acid directly, (therefore without the 4-hydroxylation step), but with a lower efficiency.
In all plant species investigated, several copies of phenylalanine ammonia lyase gene are found, copies that probably respond differentially to internal and external stimuli. Indeed, gene transcription, and then enzyme activity, are under the control of both internal developmental and external environmental stimuli. Here are some examples that require increased enzyme activity.
The flowering.
The production of lignin to strengthen the secondary wall of xylem cells.
The production of flower pigments that attract pollinators.
Pathogen infections, that require the production of phenylpropanoid phytoalexins, or exposure to UV rays.
trans-Cinnamate 4-monooxygenase
It belongs to the cytochrome P450 superfamily (EC 1.14.-.-), is a microsomal monooxygenase containing a heme cofactor, and dependent on both O2 and NADPH. It catalyzes the formation of p-coumaric acid through the introduction of a hydroxyl group in 4-position of trans-cinnamic acid (this hydroxyl group is present in most flavonoids).
This reaction is also part of the biosynthesis of hydroxycinnamic acids.
Increases in transcription rates and enzyme activity are observed in correlation with the synthesis of phytoalexins (in response to fungal infections), lignification as well as wounding.
4-Coumarate:CoA ligase (4CL)
With Mg2+ as a cofactor, it catalyzes the ATP-dependent activation of the carboxyl group of p-coumaric acid and other hydroxycinnamic acids, metabolically rather inert molecules, through the formation of the corresponding CoA-thioester.
p-Coumaric Acid + ATP + CoA ⇄ p-Coumaroyl-CoA + AMP + PPi
Generally, p-coumaric acid and caffeic acid are the preferred substrates, followed by ferulic acid and 5-hydroxyferulic acid, low activity against trans-cinnamic acid and none against sinapic acid. These CoA-thioesters are able to enter various reactions such as:
reduction to alcohol (monolignols) or aldehydes;
stilbene and flavonoid biosynthesis;
transfer to acceptor molecules.
It should finally be pointed out that the activation of the carboxyl group can also be obtained through an UDP-glucose-dependent transfer to glucose.
Biosynthesis of malonyl-CoA
Malonyl-CoA does not derived from the phenylpropanoid pathway, but from the reaction catalyzed by acetyl-CoA carboxylase (EC 6.4.1.2, the cytosolic form, see below). The enzyme, with biotin and Mg2+ as cofactors, catalyzes the ATP-dependent carboxylation of acetyl-CoA, using bicarbonate as a source of carbon dioxide (CO2).
Acetyl-CoA + HCO3– + ATP → Malonyl-CoA + ADP + Pi
It is found both in the plastids, where it participates in the synthesis of fatty acids, and the cytoplasm, and is the latter that catalyzes the formation of malonyl-CoA that is used in the biosynthesis of flavonoids and other compounds. Increases in the transcription rate of the gene and enzyme activity are induced in response to stimuli that increase the biosynthesis of these polyphenols, such as exposure to pathogenic fungi or UV-rays.
In turn, acetyl-CoA is produced in plastids, mitochondria, peroxisomes and cytosol through different metabolic pathways. The molecules used in the biosynthesis of malonyl-CoA, and therefore of the flavonoids, are the cytosolic ones, produced in the reaction catalyzed by ATP-citrate lyase (EC 2.3.3.8) that cleaves citrate, in the presence of CoA and ATP, to form oxaloacetate and acetyl-CoA, plus ADP and inorganic phosphate.
First steps in flavonoid biosynthesis
The first step in flavonoid biosynthesis is catalyzed by chalcone synthase (EC 2.3.1.74), an enzyme anchored to the endoplasmic reticulum and with no known cofactors.
From one p-coumaroyl-CoA and three malonyl-CoA, it catalyzes sequential condensation and decarboxylation reactions in the course of which a polyketide intermediate is formed. The polyketide undergoes cyclizations and aromatizations leading to the formation of the A ring. The product of the reactions is naringenin chalcone (2′,4,4′,6′-tetrahydroxychalcone), a 6′-hydroxychalcone and the first flavonoid to be synthesized by plants.
p-Coumaroyl-CoA + 3 Malonyl-CoA → Naringenin Chalcone + 4 CoA + 3 CO2
The reaction, cytosolic, is irreversible due to the release of three CO2 and 4 CoA.
B ring and the three-carbon bridge of the molecule originate from p-coumaroyl-CoA (and therefore from phenylalanine), the A ring from the three malonyl-CoA units.
The Origin of the Flavonoid Skeleton
Also 6’-deoxychalcone can be produced; its synthesis is thought to involve an additional reduction step catalyzed by polyketide reductase (EC. 1.1.1.-).
Chalcone synthase from some plant species, such as barley (Hordeum vulgare), accepts as substrates also caffeoil-CoA, feruloil-CoA and cinnamoyl-CoA.
It is the most abundant enzyme of the phenylpropanoid pathway, probably because it has a low catalytic activity, and, in fact, is considered to be the rate-limiting enzyme in flavonoid biosynthesis.
As for phenylalanine ammonia lyase, chalcone synthase gene expression is under the control of both internal and external factors. In some plants, one or two isoenzymes are found, while in others up to 9.
Chalcone synthase belongs to polyketide synthase group, present in bacteria, fungi and plants. These enzymes are able to catalyze the production of polyketide chains through sequential condensations of acetate units provided by malonyl-CoA units. They also includes stilbene synthase (EC 2.3.1.146), which catalyzes the formation of resveratrol, a non flavonoid polyphenol compound that has attracted much interest because of its potential health benefits.
Generally, chalcones do not accumulate in plants because naringenin chalcone is converted to (2S)-naringenin, a flavanone, in the reaction catalyzed by chalcone isomerase (EC 5.5.1.6).
The enzyme, the first of the flavonoid biosynthesis to be discovered, catalyzes a stereospecific isomerization and closes the C ring. Two types of chalcone isomerases are known, called type I and II. Type I enzymes use only 6′-hydroxychalcone substrates, like naringenin chalcone, while type II, prevalent in legumes, use both 6′-hydroxy- and 6′-deoxychalcone substrates.
It should be noted that with 6′-hydroxychalcones, isomerization can also occur nonenzymically to form a racemic mixture, both in vitro and in vivo, enough to allow a moderate synthesis of anthocyanins. On the contrary, under physiological conditions 6′-deoxychalcones are stable, and so the activity of type II chalcone isomerases is required to form flavanones.
The enzyme increases the rate of the reaction of 107 fold compared to the spontaneous reaction, but with a higher kinetics for the 6′-hydroxychalcones than 6′-deoxychalcones. Finally, it produces (2S)-flavanones, which are the biosynthetically required enantiomers.
As other enzymes in flavonoid biosynthesis, also chalcone isomerase gene expression is subject to strict control. And, as phenylalanine ammonia lyase and chalcone synthase, it is induced by elicitors.
In the reaction catalysed by flavanone-3β-hydroxylase (EC 1.14.11.9), (2S)-flavanones undergo a stereospecific isomerization that converts them into the respective (2R,3R)-dihydroflavonols. In particular, naringenin is converted into dihydrokaempferol.
The enzyme is a cytosolic non-heme-dependent dioxygenase, dependent on Fe2+ and 2-oxoglutarate, and therefore belonging to the family of 2-oxoglutarate-dependent dioxygenase (which distinguishes them from the other hydroxylases of the flavonoid biosynthetic pathway which are cytochrome P450 enzymes).
Naringenin chalcone, (2S)-naringenin, and dihydrokaempferol are central intermediates in flavonoid biosynthesis, since they act as branch-point compounds from which the synthesis of distinct flavonoid subclasses can occur. For example, directly or indirectly:
Not all of these side metabolic pathways are present in every plant species, or are active within each tissue type of a given plant. Like enzymes previously seen, the activity of those involved in these “side-routes” is subject to strict control, resulting in a tissue-specific profile of flavonoid compounds. For example, grape seeds, flesh and skin have distinct anthocyanin, catechin, flavonol and condensed tannin profiles, whose synthesis and accumulation are strictly and temporally coordinated during the ripening process.
References
Andersen Ø.M., Markham K.R. Flavonoids: chemistry, biochemistry, and applications. CRC Press Taylor & Francis Group, 2006
de la Rosa L.A., Alvarez-Parrilla E., Gonzàlez-Aguilar G.A. Fruit and vegetable phytochemicals: chemistry, nutritional value, and stability. 1th Edition. Wiley J. & Sons, Inc., Publication, 2010
Lignans are a subgroup of non-flavonoidpolyphenols.
They are widely distributed in the plant kingdom, being present in more than 55 plant families, where they act as antioxidants and defense molecules against pathogenic fungi and bacteria.
In humans, epidemiological and physiological studies have shown that they can exert positive effects in the prevention of lifestyle-related diseases, such as type II diabetes and cancer. For example, an increased dietary intake of these polyphenols correlates with a reduction in the occurrence of certain types of estrogen-related tumors, such as breast cancer in postmenopausal women.
In addition, some lignans have also aroused pharmacological interest. Examples are:
podophyllotoxin, obtained from plants of the genus Podophyllum (Berberidaceae family); it is a mitotic toxin whose derivatives have been used as chemotherapeutic agents;
arctigenin and tracheologin, obtained from tropical climbing plants; they have antiviral properties and have been tested in the search for a drug to treat AIDS .
Their basic chemical structure consists of two phenylpropane units linked by a C-C bond between the central atoms of the respective side chains (position 8 or β), also called β-β’ bond. 3-3′, 8-O-4′, or 8-3′ bonds are observed less frequently; in these cases the dimers are called neolignans. Hence, their chemical structure is referred to as (C6-C3)2, and they are included in the phenylpropanoid group, as well as their precursors: the hydroxycinnamic acids (see below).
Phenylpropanoid unit
Based on their carbon skeleton, cyclization pattern, and the way in which oxygen is incorporated in the molecule skeleton, they can be divided into 8 subgroups: furans, furofurans, dibenzylbutanes, dibenzylbutyrolactones, dibenzocyclooctadienes, dibenzylbutyrolactols, aryltetralins and arylnaphthalenes. Furthermore, there is considerable variability regarding the oxidation level of both the propyl side chains and the aromatic rings.
They are not present in the free form in nature, but linked to other molecules, mainly as glycosylated derivatives.
Among the most common lignans, secoisolariciresinol (the most abundant one), lariciresinol, pinoresinol, matairesinol and 7-hydroxymatairesinol are found.
Note: They occur not only as dimers but also as more complex oligomers, such as dilignans and sesquilignans.
Biosynthesis
In this section, we will examine the biosynthesis of some of the most common lignans.
The pathway starts from 3 of the 4 most common dietary hydroxycinnamic acids: p-coumaric acid, sinapic acid, and ferulic acid (caffeic acid is not a precursor of this subgroup of polyphenols). Therefore, they arise from the shikimic acid pathway, via phenylalanine.
Lignan Biosynthesis
The first three reactions reduce the carboxylic group of the hydroxycinnamates to alcohol group, with formation of the corresponding alcohols, called monolignols, that is, p-coumaric alcohol, sinapyl alcohol and coniferyl alcohol. These molecules also enter the pathway of lignin biosynthesis.
The first step, which leads to the activation of the hydroxycinnamic acids, is catalysed by hydroxycinnamate:CoA ligases, commonly called p-coumarate:CoA ligases (EC 6.2.1.12), with formation of the corresponding hydroxycinnamate-CoAs, namely, feruloil-CoA, p- coumaroyl-CoA and sinapil-CoA.
In the second step, a NADPH-dependent cinnamoyl-CoA: oxidoreductase, also called cinnamoyl-CoA reductase (EC1.2.1.44) catalyzes the formation of the corresponding aldehydes, and the release of coenzyme A.
In the last step, a NADPH-dependent cinnamyl alcohol dehydrogenase, also called monolignol dehydrogenase (EC 1.1.1.195), catalyzes the reduction of the aldehyde group to an alcohol group, with the formation of the aforementioned monolignols.
The next step, the dimerization of monolignols, involves the intervention of stereoselective mechanisms, or, more precisely, enantioselective mechanisms.In fact, most of the plant lignans exists as (+)- or (-)-enantiomers, that is, isomers with property of chirality, whose relative amounts can vary from species to species, but also in different organs on the same plant, depending on the type of reactions involved.
The dimerization can occur through enzymatic reactions involving laccases (EC 1.10.3.2). These enzymes catalyze the formation of radicals that, dimerizing, form a racemic mixture. However, this does not explain how the racemic mixtures found in plants are formed. The most accepted mechanism to explain the stereospecific synthesis involves the action of the laccase and of a protein able to direct the synthesis toward one or the other of the two enantiomeric forms: the dirigent protein. The reaction scheme might be: the enzyme catalyzes the synthesis of phenylpropanoid radicals that are orientated in such a way to obtain the desired stereospecific coupling by the dirigent protein.
(-)-Matairesinol
For example, pinoresinol synthase, consisting of laccase and dirigent protein, catalyzes the stereospecific synthesis of (+)-pinoresinol from two units of coniferyl alcohol. (+)-Pinoresinol, in two consecutive stereospecific reactions catalyzed by NADPH-dependent pinoresinol/lariciresinol reductase (EC 1.23.1.2), is first reduced to (+)-lariciresinol, and then to (-)-secoisolariciresinol. (-)-Secoisolariciresinol, in the reaction catalyzed by NAD(P)-dependent secoisolariciresinol dehydrogenase (EC 1.1.1.331) is oxidized to (-)-matairesinol.
Metabolism by human gut microbiota
Their importance to human health is due largely to their metabolism by gut microbiota, which is part of the larger human microbiota, and that carries out deglycosylations, para-dehydroxylations, and meta-demethylations without enantiomeric inversion. Indeed, this metabolization leads to the formation molecules with a modest estrogen-like activity (phytoestrogens), a situation similar to that observed with some isoflavones, such as those of soybean, some coumarins, and some stilbenes. These active metabolites are the so-called “mammalian lignans or enterolignans”, such as the aglycones of enterodiol and enterolactone, formed from secoisolariciresinol and matairesinol, respectively.
Studies conducted on animals fed diets rich in lignans have shown their presence as intact molecules, in low concentrations, in serum, suggesting that they may be absorbed as such from the intestine. These molecules exhibit estrogen-independent actions, both in vivo and in vitro, such as inhibition of angiogenesis, reduction of diabetes, and suppression of tumor growth.
Note: The term “phytoestrogen” refers to molecules with estrogenic or antiandrogenic activity, at least in vitro.
Once absorbed, they enter the enterohepatic circulation, and, in the liver, may undergo phase II reactions and be sulfated or glucuronidated, and finally excreted in the urine.
Food sources
The richest dietary source is flaxseed (linseed), that contains mainly secoisolariciresinol, but also lariciresinol, pinoresinol and matairesinol in good quantity (for a total amount of more than 3.7 mg/100 g dry weight). They are also found in sesame seeds.
(-)-Secoisolariciresinol
Another important source is whole grains.
They are also present in other foods, but in concentrations from one hundred to one thousand times lower than those of flaxseed. Examples are:
beverages, generally more abundant in red wine, followed in descending order by black tea, soy milk and coffee;
fruits, such as apricots, pears, peaches, strawberries;
among vegetables, Brassicaceae, garlic, asparagus and carrots;
lentils and beans.
Their presence in grains and, to a lesser extent in red wine and fruit, makes them, at least in individuals who follow a mediterranean diet, the main source of phytoestrogens.
References
Andersen Ø.M., Markham K.R. Flavonoids: chemistry, biochemistry, and applications. CRC Press Taylor & Francis Group, 2006
de la Rosa L.A., Alvarez-Parrilla E., Gonzàlez-Aguilar G.A. Fruit and vegetable phytochemicals: chemistry, nutritional value, and stability. 1th Edition. Wiley J. & Sons, Inc., Publication, 2010
Manach C., Scalbert A., Morand C., Rémésy C., and Jime´nez L. Polyphenols: food sources and bioavailability. Am J Clin Nutr 2004;79(5):727-747. doi:10.1093/ajcn/79.5.727
Satake H, Koyama T., Bahabadi S.E., Matsumoto E., Ono E. and Murata J. Essences in metabolic engineering of lignan biosynthesis. Metabolites 2015;5:270-290. doi:10.3390/metabo5020270
Tsao R. Chemistry and biochemistry of dietary polyphenols. Nutrients 2010;2:1231-1246. doi:10.3390/nu2121231
van Duynhoven J., Vaughan E.E., Jacobs D.M., Kemperman R.A., van Velzen E.J.J, Gross G., Roger L.C., Possemiers S., Smilde A.K., Doré J., Westerhuis J.A.,and Van de Wiele T. Metabolic fate of polyphenols in the human superorganism. PNAS 2011;108(suppl. 1):4531-4538. doi:10.1073/pnas.1000098107
Wink M. Biochemistry of plant secondary metabolism – 2nd Edition. Annual plant reviews (v. 40), Wiley J. & Sons, Inc., Publication, 2010
Hydroxycinnamic acids or hydroxycinnamates are phenolic compounds belonging to non-flavonoid polyphenols.
They are present in all parts of fruits and vegetables although the highest concentrations are found in the outer part of ripe fruits, concentrations that decrease during ripening, while the total amount increases as the size of the fruits increases.
Their dietary intake has been associated with the prevent
cancer;
type-2 diabetes.
These effects do seem to be due not only to their high antioxidant activity (that depends upon the hydroxylation pattern of the aromatic ring, see below), but also to other mechanisms of action such as, e.g., the reduction of intestinal absorption of glucose or the modulation of secretion of some gut hormones.
Their basic structure is a benzene ring to which a three carbon chain is attached, structure that is referred to as C6-C3. Therefore they can be included in the phenylpropanoid group.
Basic Skeleton of Hydroxycinnamates
The main dietary hydroxycinnamates are:
caffeic acid or 3,4-dihydroxycinnamic acid;
ferulic acid or 4-hydroxy-3-methoxycinnamic acid;
sinapic acid or 4-hydroxy-3,5-dimethoxycinnamic acid;
p-coumaric acid or 4-coumaric acid or 4-hydroxycinnamic acid.
In nature, they are associated with other molecules to form, e.g., glycosylated derivatives or esters of tartaric acid, quinic acid, or shikimic acid. In addition, several hundreds of anthocyanins acylated with the aforementioned hydroxycinnamates have been identified (in descending order with p-coumaric acid, more than 150, caffeic acid, about 100, ferulic acid, about 60, and sinapic acid, about 25). They are rarely present in the free form, except in processed foods that have undergone fermentation, sterilization or freezing. For example, an overlong storage of blood orange fruits causes a massive hydrolysis of hydroxycinnamic derivatives to free acids, and this in turn could lead to the formation of malodorous compounds such as vinyl phenols, indicators of too advanced senescence of the fruit.
Biosynthesis
Hydroxycinnamate biosynthesis consists of a series of enzymatic reactions subsequent to that catalyzed by phenylalanine ammonia lyase (PAL).
Phenylalanine ⇄ trans-Cinnamic acid + NH3
This enzyme catalyzes the deamination of phenylalanine to yield trans-cinnamic acid, so linking the aromatic amino acid to the hydroxycinnamic acids and their activated forms.
Biosynthesis of Hydroxycinnamates
In the first step, a hydroxyl group is attached at the 4-position of the aromatic ring of trans-cinnamic acid to form p-coumaric acid. The reaction catalysed by trans-cinnamate 4-monooxygenase (EC:1.14.14.91).
The addition of a second hydroxyl group at the 3-position of the ring of p-coumaric acid leads to the formation of caffeic acid. The reaction catalysed by p-coumarate 3-hydroxylase (EC 1.14.13.-).
The O-methylation of the hydroxyl group at the 3-position yields ferulic acid. The reaction catalyzed by caffeate 3-O-methyltransferase (EC:2.1.1.68).
Caffeic acid + SAM ⇄ Ferulic acid + SAH
Ferulic acid is converted into sinapic acid through two reactions: a hydroxylation at the 5-position to form 5-hydroxy ferulic acid, in a reaction catalyzed by ferulate 5-hydroxylase (EC:1.14.-.-), and the subsequent O-methylation of the same hydroxyl group in a reaction catalyzed by caffeate 3-O-methyltransferase.
5-Hydroxy ferulic acid + SA from M ⇄ Sinapic acid + SAH
Hydroxycinnamic acids are not present in high quantities since they are rapidly converted to glucose esters or coenzyme A (CoA) esters, in reactions catalyzed by O-glucosyltransferases and hydroxycinnamate:CoA ligases, respectively. These activated intermediates are branch points, being able to participate in a wide range of reactions such as condensation with malonyl-CoA to form flavonoids, or the NADPH-dependent reduction to form lignans (precursors of lignin).
Food sources
Kiwis, blueberries, plums, cherries, apples, pears, chicory, artichokes, carrots, lettuce, eggplant, wheat and coffee are among the richest sources.
Caffeic acid
It is generally, both in the free form and bound to other molecules, the most abundant hydroxycinnamic acid in vegetables and most of the fruits, where it represents between 75 and 100% of the hydroxycinnamates.
The richest sources are coffee (drink), carrots, lettuce, potatoes, even sweet ones, and berries such as blueberries, cranberries and blackberries.
Smaller quantities are present in grapes and grape-derived products, orange juice, apples, plums, peaches, and tomatoes.
Caffeic acid and quinic acid bind to form chlorogenic acid, present in many fruit and in high concentration in coffee.
Ferulic acid
It is the most abundant hydroxycinnamic acid in cereals, which are also its main dietary source.
In wheat grain, its content is between 0.8 and 2 g/kg dry weight, which represents up to 90% of the total polyphenols. It is found chiefly, up to 98% of the total content, in the aleurone layer and pericarp (that is, the outer parts of the grain), and therefore its content in wheat flours depends upon the degree of refining, while the main source is obviously the bran. The molecule is present mainly in the trans form, and esterified with arabinoxylans and hemicelluloses. And in fact, in wheat bran the soluble free form represents only about 10% of its total amount. Dimers were also found, which form bridge structures between chains of hemicellulose.
In fruits and vegetables, ferulic acid is much less common than caffeic acid. The main sources are asparagus, eggplant and broccoli; lower quantities are found in blackberries, blueberries, cranberries, apples, carrots, potatoes, beets, coffee and orange juice.
Sinapic acid
The highest amounts are found in citrus peel and seeds (in orange juice, the amount is much lower); appreciable quantities in Chinese cabbage and in some varieties of cranberries.
p-Coumaric acid
High amounts are present in eggplant, the richest source, broccoli and asparagus; other sources are sweet cherries, plums, blueberries, cranberries, citrus peel and seeds, and orange juice.
References
Andersen Ø.M., Markham K.R. Flavonoids: chemistry, biochemistry, and applications. CRC Press Taylor & Francis Group, 2006
de la Rosa L.A., Alvarez-Parrilla E., Gonzàlez-Aguilar G.A. Fruit and vegetable phytochemicals: chemistry, nutritional value, and stability. 1th Edition. Wiley J. & Sons, Inc., Publication, 2010
Manach C., Scalbert A., Morand C., Rémésy C., and Jime´nez L. Polyphenols: food sources and bioavailability. Am J Clin Nutr 2004;79(5):727-747. doi:10.1093/ajcn/79.5.727
Preedy V.R. Coffee in health and disease prevention. Academic Press, 2014
Zhao Z., Moghadasian M.H. Bioavailability of hydroxycinnamates: a brief review of in vivo and in vitro studies. Phytochem Rev 2010;9(1):133-145. doi:10.1007/s11101-009-9145-5
The consumption of grapes and grape-derived products, particularly red wine but only at meals, has been associated with numerous health benefits, which include, in addition to the antioxidant/antiradical effect, also anti-inflammatory, cardioprotective, anticancer, antimicrobial, and neuroprotective activities.
Grapes contain many nutrients such as sugars, vitamins, minerals, fiber and phytochemicals. Among the latter, polyphenols from grapes are the most important compounds in determining the health effects of the fruit and derived products.
Indeed, grapes are among the fruits with highest content in polyphenols, whose composition is strongly influenced by several factors such as:
cultivar;
climate;
exposure to disease;
processing
Nowadays, the main species of grapes cultivated worldwide are: European grapes, Vitis vinifera, North American grapes, Vitis rotundifolia and Vitis labrusca, and French hybrids.
Note: Grapes are not a fruit but an infructescence, that is, an ensemble of fruits (berries): the bunch of grapes. In turn, it consists of a peduncle, a rachis, cap stems or pedicels, and berries.
Polyphenols from red grapes and wine are significantly higher, both in quantity and variety, than in white ones. This, according to many researchers, would be the basis of the more health benefits related to the consumption of red grapes and wine than white grapes and derived products. Polyphenols from grapes and wine are a complex mixture of flavonoid compounds, the most abundant group, and non-flavonoid compounds.
Among flavonoids, they are found:
Most of the flavonoids present in wine derive from the epidermal layer of the berry skin, while 60-70% of the total polyphenols are present in the grape seeds. It should be noted that more than 70% of grape polyphenols are not extracted and remain in the pomace.
The complex chemical interactions that occur between these compounds, and between them and the other compounds of different nature present in grapes and wine, are probably essential in determining both the quality of the grapes and wine and the broad spectrum of therapeutic effects of these foods.
In wine, the mixture of polyphenols play important functions being able to influence:
bitterness;
astringency;
red color, of which they are among the main responsible;
sensitivity to oxidation, being molecules easily oxidizable by atmospheric oxygen.
Finally, they act as wine preservatives, and are the basis of its long aging.
Anthocyanins
They are flavonoids widely distributed in fruits and vegetables.
They are primarily located in the berry skin (in the outer layers of the hypodermal tissue), to which they confer color, having a hue that varies from red to blue. In some varieties, called “teinturier”, they also accumulate in the flesh of the berry.
There is a close relationship between berry development and the biosynthesis of anthocyanins. The synthesis starts at veraison (when the berry stops growing and changes its color), causes a color change of the berry that turns purple, and reaches the maximum levels at complete ripening.
Among wine flavonoids, they are one of the most potent antioxidants.
Each grape species and cultivars has a unique composition of anthocyanins. Moreover, in grapes of Vitis vinifera, due to a mutation in the gene coding for 5-O-glucosyltransferase, mutation that determines the synthesis of an inactive enzyme, only 3-monoglucoside derivatives are synthesized, while in other species the glycosylation at position 5 also occurs. Interestingly, 3-monoglucoside derivatives are more intensely colored than 3,5-diglucoside derivatives.
Malvidin-3-glucoside
In red grapes and wine, the most abundant anthocyanins are the 3-monoglucosides of malvidin (the most abundant one both in grapes and wine), petunidin, delphinidin, peonidin, and cyanidin. In turn, the hydroxyl group at position 6 of the glucose can be acylated with an acetyl, caffeic or coumaric group, acylation that further enhances the stability.
Anthocyanidins, namely the non-conjugated molecules, are not present in grapes and in wine, except as traces.
Anthocyanins are scarcely present in white grapes and wine.
The composition of anthocyanins in wine is highly influenced both by the type of cultivar and by processing techniques, since they are present in wine as a result of extraction by maceration/fermentation processes. For this reason, wines deriving from similar varieties of grapes can have very different anthocyanin compositions.
Together with proanthocyanidins, they are the most important polyphenols in contributing to some organoleptic properties of red wine, as they are primarily responsible for astringency, bitterness, chemical stability against oxidation, as well as of the color of the young wine. In this regard, it should be underscored that with time their concentration decreases, while the color is due more and more to the formation of polymeric pigments produced by condensation of anthocyanins both among themselves and with other molecules.
During wine aging, proanthocyanidins and anthocyanins react to produce more complex molecules that can partially precipitate.
Flavanols or catechins
They are, together with condensed tannins, the most abundant flavonoids, representing up to 50% of the total polyphenols in white grapes and between 13% and 30% in red ones.
Their levels in wine depend on the type of cultivar.
Catechin
Typically, the most abundant flavanol in wine is catechin, but epicatechin and epicatechin-3-gallate are also present.
Proanthocyanidins or condensed tannins
Composed of catechin monomers, they are present in the berry skin, seeds and rachis of the bunch of grapes as:
dimers: the most common are procyanidins B1-B4, but also procyanidins B5-B8 can be present;
trimers: procyanidin C1 is the most abundant;
tetramers;
polymers, containing up to 8 monomers.
Procyanidin C1
Their levels in wine depend on the type of grape varieties and wine-making technology, and, like anthocyanins, are much more abundant in red wines, in particular in aged wines, compared to white ones.
In addition, as previously said, together with anthocyanins, condensed tannins are important in determining some organoleptic properties of the wine.
Flavonols
Flavonols are present in a large variety of fruit and vegetables, even if in low concentrations.
They are the third most abundant group of flavonoids from grapes, after proanthocyanidins and catechins.
They are mainly present in the outer epidermis of the berry skin, where they play a role both in providing protection against UV-A and UV-B radiations and in copigmentation together with anthocyanins.
Flavanol synthesis begins in the sprout; the highest concentration is reached a few weeks after veraison, then it decreases as the berry increases in size.
Their total amount is very variable, with the red varieties often richer than the white ones.
In grapes, they are present as 3-glucosides and their composition depends on the type of grapes and cultivar:
the derivatives of quercetin, kaempferol and isorhamnetin are found in white grapes;
the derivatives of myricetin, laricitrin and syringetin are found, together with the previous ones, only in red grapes, due to the lack of expression in white grapes of the gene coding for flavonoid-3′,5′-hydroxylase.
Quercetin-3-glucoside
In general, the 3-glucosides and 3-glucuronides of quercetin are the major flavonols in most of the grape varieties. Conversely, quercetin-3-rhamnoside and quercetin aglycone are the major flavonols in muscadine grapes.
In wine and grape juice, unlike grapes, they are also found as aglycones, as a result of the acid hydrolysis that occurs during processing and storage. They are present in wine in a variable amount, and the major molecules are the glycosides of quercetin and myricetin, which alone represent 20-50% of the total flavonols in red wine.
Hydroxycinnamates
Hydroxycinnamic acids are the main class of non-flavonoid polyphenols from grapes and the major polyphenols in white wine.
The most important are p-coumaric, caffeic, sinapic, and ferulic acids, present in wine as esters with tartaric acid.
They have antioxidant activity and in some white varieties of Vitis vinifera, together with flavonols, are the polyphenols mainly responsible for absorbing UV radiation in the berry.
Stilbenes
They are phytoalexins which are produced in low concentrations only by a few edible species, including grapevine (on the contrary, flavonoids are present in all higher plants).
Together with the other polyphenols from grapes and wine, also stilbenes, particularly resveratrol, have been associated with health benefits resulting from the consumption of wine.
trans-Resveratrol
Their content increases from the veraison to the ripening of the berry, and is influenced by the type of cultivar, climate, wine-making technology, and fungal pressure.
The main stilbenes present in grapes and wine are:
cis- and trans-resveratrol (3,5,4′-trihydroxystilbene);
piceid or resveratrol-3-glucopyranoside and astringin or 3′-hydroxy-trans-piceid;
piceatannol;
dimers and oligomers of resveratrol, called viniferins, of which the most important are:
α-viniferin, a trimer;
β-viniferin, a cyclic tetramer;
γ-viniferin, a highly polymerized oligomer;
ε-viniferin, a cyclic dimer.
In grapes, other isomers and glycosylated forms of resveratrol and piceatannol, such as resveratroloside, hopeaphenol, or resveratrol di- and tri-glucoside derivatives, have been found in trace amounts.
Glycosylation of stilbenes is important for the modulation of antifungal activity, protection from oxidative degradation, and storage of the wine.
The synthesis of dimers and oligomers of resveratrol, both in grapes and wine, represents a defense mechanism against exogenous attacks or, on the contrary, the result of the action of extracellular enzymes released from pathogens in an attempt to eliminate undesirable compounds.
Hydroxybenzoates
The hydroxybenzoic acid derivatives are a minor component in grapes and wine.
In grapes, gentisic, gallic, p-hydroxybenzoic and protocatechuic acids are the main ones.
Gallic Acid
Unlike hydroxycinnamates, which are present in wine as esters with tartaric acid, they are found in their free form.
Together with flavonols, proanthocyanidins, catechins, and hydroxycinnamates they are among the responsible of astringency of wine.
References
Andersen Ø.M., Markham K.R. Flavonoids: chemistry, biochemistry, and applications. CRC Press Taylor & Francis Group, 2006
Basli A, Soulet S., Chaher N., Mérillon J.M., Chibane M., Monti J.P.,1 and Richard T. Wine polyphenols: potential agents in neuroprotection. Oxid Med Cell Longev 2012. doi:10.1155/2012/805762
de la Rosa L.A., Alvarez-Parrilla E., Gonzàlez-Aguilar G.A. Fruit and vegetable phytochemicals: chemistry, nutritional value, and stability. 1th Edition. Wiley J. & Sons, Inc., Publication, 2010
Flamini R., Mattivi F., De Rosso M., Arapitsas P. and Bavaresco L. Advanced knowledge of three important classes of grape phenolics: anthocyanins, stilbenes and flavonols. Int J Mol Sci 2013;14:19651-19669. doi:10.3390/ijms141019651
Georgiev V., Ananga A. and Tsolova V. Recent advances and uses of grape flavonoids as nutraceuticals. Nutrients 2014;6: 391-415. doi:10.3390/nu6010391
Guilford J.M. and Pezzuto J.M. Wine and health: a review. Am J Enol Vitic 2011;62(4):471-486. doi:10.5344/ajev.2011.11013
He S., Sun C. and Pan Y. Red wine polyphenols for cancer prevention. Int J Mol Sci 2008;9:842-853. doi:10.3390/ijms9050842
Xia E-Q., Deng G-F., Guo Y-J. and Li H-B. Biological activities of polyphenols from grapes. Int J Mol Sci 2010;11:622-646. doi:10.3390/ijms11020622
Olive oil is a liquid fat obtained by pressing whole olives, the fruit of the olive tree (Olea europaea).
It is a staple ingredient in Mediterranean diet and is widely used for cooking, salad dressings, and other culinary purposes. Olive oil is also known for its health benefits, as it is rich in monounsaturated fats and antioxidants.
From a chemical point of view, we can identify in the olive oil two fractions, depending on the behavior in the presence of heating and strong alkaline solutions:
the saponifiable fraction, which represents 98-99 percent of the total weight, is composed of lipids that form soaps in the above conditions;
the unsaponifiable fraction, which represents the remaining 1-2 percent of the total weight, is composed of substances that fail to form soaps in the above conditions.
It is composed of saturated fatty acids and unsaturated fatty acids, esterified almost entirely to glycerol to form triglycerides or triacylglycerols. To a much lesser extent, diglycerides or diacylglycerols, monoglycerides or monoacylglycerols, and free fatty acids are also found.
Unsaturated fatty acids make up 75 to 85 percent of the total fatty acids. Oleic acid (O) and linoleic acid (L) are the most abundant ones; palmitoleic acid, eptadecenoic acid, gadoleic acid, and alpha-linolenic acid (Ln) are present in lower/trace amounts.
IOOC requirements for olive oil
Fatty acids
Number of carbons
Allowable range percent
Myristic acid
C14:0
<0.03
Palmitic acid
C16:0
7.5-20
Palmitoleic acid
C16:1
0.3-3.5
Heptadecanoic acid
C17:0
≤0.3
Heptadecenoic acid
C17:1
≤0.3
Stearic acid
C18:0
0.5-5.0
Oleic acid
C18:1
55.0-83.0
Linoleic acid
C18:2
2.5-21.0
Alpha-linolenic acid
C18:3
≤1.0
Arachidic acid
C20:0
≤0.6
Gadoleic acid
C20:1
≤0.4
Behenic acid
C22:0
≤0.2
Lignoceric acid
C24:0
≤0.2
Oleic acid is the major fatty acid in olive oils. According to the rules laid down by the International Olive Oil Council (IOOC), its concentration must range from 55 percent to 83 percent of total fatty acids.
Linoleic acid is the most abundant polyunsaturated fatty acid in olive oil; its concentration must vary between 2.5 percent and 21 percent (IOOC). Because of its high degree of unsaturation, it is subject to oxidation; this means that an oil high in linoleic acid becomes rancid easily, and thus it may be stored for a shorter time.
In mediterranean cuisine, olive oil is the main source of fat: therefore, oleic acid, among monounsaturated fatty acids, and linoleic acid, among polyunsaturated fatty acids, are the most abundant fatty acids.
alpha-Linolenic acid must be present in very low amount, according to the IOOC standards ≤1 percent. It is an omega-3 polyunsaturated fatty acid, which may have health benefits. However, because of to its high degree of unsaturation, higher than that of linoleic acid, it is very susceptible to oxidation, and therefore it promotes rancidity of the olive oil that contains it.
Saturated fatty acids make up 15 to 25 percent of the total fatty acids. Palmitic acid (P), 5-20 percent, and stearic acid (S), 0.5-5 percent, are the most abundant saturated fatty acids; myristic acid, heptadecanoic acid, arachidic acid, behenic acid and lignoceric acid may be present in trace amounts.
The presence of fatty acids that should be absent or present in amounts different than those found is a marker of adulteration with other vegetable oils. On this regard, particular attention is paid to myristic, arachidic, behenic, lignoceric, gadoleic and alpha-linolenic acids, whose limits are set by IOOC.
Fatty acid composition is influenced by several factors.
The climate.
The latitude.
The zone of production.
Italian, Spanish and Greek olive oils are high in oleic acid and low in palmitic and linoleic acids, while Tunisian olive oils are high in palmitic and linoleic acids but lower in oleic acid. Therefore, oils can be divided into two groups:
one rich in oleic acid and low in palmitic and linoleic acids;
the other high in palmitic and linoleic acids and low in oleic acid.
The cultivar.
The degree of olive ripeness at the time of oil extraction.
It should be noted that oleic acid is formed first in the fruit, and data seem to indicate a competitive relationship between oleic acid and palmitic, palmitoleic, and linoleic acids.
Triglycerides
As previously said, fatty acids in olive oil are almost entirely present as triglycerides.
In small percentage, they are also present as diglycerides, monoglycerides, and in free form.
The sn Positions of Triglycerides
During triglyceride biosynthesis, thanks to the presence of specific enzymes, only about 2 percent of glycerol binds palmitic acid in the sn-2 position. The percentage of stearic acid in the sn-2 position is very low, as well. For the most part, the sn-2 position is occupied by oleic acid.
On the contrary, if we consider oils that have undergone a nonenzymatic esterification, the percentage of palmitic acid in the sn-2 position increases significantly.
Note: sn = Stereospecific numbering
Among triglycerides present in significant proportions in olive oil, there are:
OOO: 40-59 percent;
POO: 12-20 percent;
OOL: 12.5-20 percent;
POL: 5.5-7 percent;
SOO: 3- 7 percent.
POP, POS, OLnL, OLnO, PLL, PLnO are present in smaller amounts.
Trilinolein (LLL) is a triglyceride that contains three molecules of linoleic acid. Its low content is an indicator of an oil of good quality.
Triglycerides containing three saturated fatty acids or three molecules of alpha-linolenic acid have not been reported.
Diglycerides and monoglycerides
Their presence is due to an incomplete synthesis and/or a partial hydrolysis of triglycerides.
The content of diglycerides in virgin olive oil ranges from 1 percent to 2.8 percent. 1,2-Diglycerides prevail in fresh olive oil, representing over 80 percent of the diglycerides. During oil storage, isomerization occurs with a progressive increase of the more stable 1-3 isomers, which after about 10 months become the major isomers.
Therefore, the ratio 1,2/1,3-diglycerides may be used as an indicator of the age of the oil.
Monoglycerides are present in amounts lower than diglycerides, <0.25 percent, with 1-monoglycerides far more abundant than 2-monoglycerides.
Unsaponifiable fractions
It is composed of a large number of different molecules, very important from a nutritional point of view, as they contribute significantly to the health effects of olive oil.
Furthermore, they are responsible for the stability and the taste of olive oil, and are also used to detect adulteration with other vegetable oils.
This fraction includes tocopherols, sterols, polyphenols, pigments, hydrocarbons, aromatic and aliphatic alcohol, triterpene acids, waxes, and minor constituents.
Their content is influenced by factors similar to those seen for fatty acid composition, such as:
the cultivar;
the degree of ripeness of the olive;
the zone of production;
the crop year and olive harvesting practices;
the storage time of olives;
the oil extraction process;
the storage conditions of the oil.
It should be noted that many of these compounds are not present in refined olive oils, as they are removed during the refining processes.
Polyphenols
They make up 18 to 37 percent of the unsaponifiable fraction.
They are a very heterogeneous group of molecules with nutritional and organoleptic properties; for example, oleuropein and hydroxytyrosol give oil its bitter and pungent taste.
For a more extensive discussion, see the article Polyphenols in olive oil.
Hydrocarbons
They make up 30 to 50 percent of the unsaponifiable fraction.
Squalene and beta-carotene are the main molecules.
Squalene, isolated for the first time from shark liver, is the major constituent of the unsaponifiable fraction, and constitutes more than 90 percent of the hydrocarbons. Its concentration ranges from 200 to 7500 mg/kg of olive oil.
It is an intermediate in the biosynthesis of the four-ring structure of steroids, and it seems to be responsible of several health effects of olive oil.
In the hydrocarbon fraction of virgin olive oil, n-paraffins, diterpene and triterpene hydrocarbons, isoprenoidal polyolefins are also found.
Beta-carotene acts both as antioxidant, protecting oil during storage, and as dye.
Sterols
They are important lipids of olive oil, and are:
linked to many health benefits for consumers;
important to the quality of the oil;
widely used for checking its genuineness.
On this regard, it is to underline that sterols are species-specific molecules; for example, the presence of high concentrations of brassicasterol, a sterol typically found in Brassicaceae (Cruciferae) family, such as rapeseed, indicates adulteration of olive oil with canola oil.
Four classes of sterols are present in olive oil: common sterols, 4-methylsterols, triterpene alcohols, and triterpene dialcohols. Their content ranges from 1000 mg/kg, the minimum value required by the IOOC standard, to 2000 mg/kg. The lowest values are found in refined oils because of the refining processes may cause losses up to 25 percent.
Common sterols or 4-alpha-desmethylsterols
Common sterols are present mainly in the free and esterified form; however they have been also found as lipoproteins and sterylglucosides.
The main molecules are beta-sitosterol, which makes up 75 to 90 percent of the total sterol, Δ5-avenasterol, 5 to 20 percent, and campesterol, 4 percent. Other components found in lower amounts or traces are, for example, stigmasterol, 2 percent, cholesterol, brassicasterol, and ergosterol.
4-Methylsterols
They are intermediates in the biosynthesis of sterols, and are present both in the free and esterified form. They are present in small amounts, much lower than those of common sterols and triterpene alcohols, varying between 50 and 360 mg/kg. The main molecules are obtusifoliol, cycloeucalenol, citrostadienol, and gramisterol.
Triterpene alcohols or 4,4-dimethylsterols
They are a complex class of sterols, present both in the free and esterified form. They are found in amounts ranging from 350 to 1500 mg/kg.
The main components are beta-amyrin, 24-methylenecycloartanol, cycloartenol, and butyrospermol; other molecules present in lower/trace amounts are, for example, cyclosadol, cyclobranol, germanicol, and dammaradienol.
Triterpene dialcohols
The main triterpene dialcohols found in olive oil are erythrodiol and uvaol.
Erythrodiol is present both in the free and esterified form; in virgin olive oil, its level varies between 19 and 69 mg/kg, and the free form is generally lower than 50 mg/kg.
Tocopherols
They make up 2 to 3 percent of the unsaponifiable fraction, and include vitamin E.
Of the eight E-vitamers, alpha-tocopherol represents about 90 percent of tocopherols in virgin olive oil. It is present in the free form and in very variable amount, but on average higher than 100 mg/kg of olive oil. Thanks to its in vivo antioxidant properties, its presence is a protective factor for health. Alpha-tocopherol concentration seems to be related to the high levels of chlorophylls and to the concomitant requirement for deactivation of singlet oxygen.
Beta-tocopherol, delta-tocopherol, and gamma-tocopherol are usually present in low amounts.
Pigments
In this group we find chlorophylls and carotenoids.
In olive oil, chlorophylls are present as phaeophytins, mainly phaeophytin a, namely, a chlorophyll from which magnesium has been removed and substituted with two hydrogen ions, and confer the characteristic green color to olive oil. They are photosensitizer molecules that contribute to the photooxidation of olive oil itself.
Beta-carotene and lutein are the main carotenoids in olive oil. Several xanthophylls are also present, such as antheraxanthin, beta-cryptoxanthin, luteoxanthin, mutatoxanthin, neoxanthin, and violaxanthin.
Olive oil’s color is the result of the presence of chlorophylls and carotenoids and of their green and yellow hues. Their presence is closely related.
Triterpene acids
They are important components of the olive, and are present in trace amounts in the oil.
Oleanolic and maslinic acids are the main triterpene acids in virgin olive oil: they are present in the olive husk, from which they are extracted in small amount during processing.
Aliphatic and aromatic alcohols
Fatty alcohols and diterpene alcohols are the most important ones.
Aliphatic alcohols have a number of carbon atoms between 20 and 30, and are located mostly inside the olive stones, from where they are partially extracted by milling.
Fatty alcohols
They are linear saturated alcohols with more than 16 carbon atoms.
They are found in the free and esterified form and are present, in virgin olive oil, in amount not generally higher than 250 mg/kg.
Docosanol (C22), tetracosanol (C24), hexacosanol (C26), and octacosanol (C28) are the main fatty alcohols in olive oil, with tetracosanol and hexacosanol present in larger amounts.
Waxes, which are minor constituents of olive oil, are esters of fatty alcohols with fatty acids, mainly of palmitic acid and oleic acid. They can be used as a criterion to discriminate between different types of oils; for example, they must be present in virgin and extra virgin olive oil at levels <150 mg/kg, according to the IOOC standards.
Diterpene alcohols
Geranylgeraniol and phytol are two acyclic diterpene alcohols, present in the free and esterified form. Among esters present in the wax fraction of extra virgin olive oil, oleate, eicosenoate , eicosanoate, docosanoate, and tetracosanoate have been found, mainly as phytyl derivatives.
Volatile compounds
More than 280 volatile compounds have been identified in olive oil, such as hydrocarbons, the most abundant fraction, alcohols, aldehydes, ketones, esters, acids, ethers and many others. However, only about 70 of them are present at levels higher than the perception threshold beyond which they may contribute to the aroma of virgin olive oil.
Minor components
Phospholipids are found among the minor components of olive oil; the main ones are phosphatidylserine, phosphatidylethanolamine, phosphatidylcholine, phosphatidylinositol.
In the unfiltered oils, trace amounts of proteins may be found.
References
Gunstone F.D. Vegetable oils in food technology: composition, properties and uses. 2th Edition. Wiley J. & Sons, Inc., Publication, 2011
Caponio F., Bilancia M.T., Pasqualone A., Sikorska E., Gomes T. Influence of the exposure to light on extra virgin olive oil quality during storage. Eur Food Res Technol 2005;221:92-98. doi:10.1007/s00217-004-1126-8
Servili M., Sordini B., Esposto S., Urbani S., Veneziani G., Di Maio I., Selvaggini R. and Taticchi A. Biological activities of phenolic compounds of extra virgin olive oil. Antioxidants 2014;3:1-23. doi:10.3390/antiox3010001
ten is not a single protein but a mixture of cereal proteins, about 80 percent of its dry weight, for example gliadins and glutenins in wheat grains, lipids, 5-7 percent, starch, 5-10 percent, water, 5-8 percent, and mineral substances, <2 percent.
It forms when components naturally present in the grain of cereals, the caryopsis, and in their flours, are joined together by means of mechanical stress in aqueous environment, i.e. during the formation of the dough.
The term is also related to the family of proteins that cause problems for celiac patients.
Isolated for the first time in 1745 from wheat flour by the Italian chemist Jacopo Bartolomeo Beccari, it can be extracted from the dough by washing it gently under running water: starch, albumins and globulins, that are water-soluble, are washed out, and a sticky and elastic mass remains, precisely the gluten, which means glue in Latin.
durum wheat (Triticum durum); groats and semolina for dry pasta making are obtained from it;
common wheat or bread wheat (Triticum aestivum), so called because it is used in bread and fresh pasta making, and in bakery products;
khorasan wheat (Triticum turanicum); a variety of it is Kamut®;
triticale (× Triticosecale Wittmack), which is a hybrid of rye and common wheat;
bulgur, which is whole durum wheat, sprouted and then processed;
seitan, which is not a cereal, but a wheat derivative, also defined by some as “gluten steak”.
Given that most of the dietary intake of gluten comes from wheat flour, of which about 700 million tons per year are harvested, representing about 30 percent of the global cereal production, the following discussion will focus on wheat gluten, and mainly on its proteins.
Note: The term gluten is also used to indicate the protein fraction that remains after removal of starch and soluble proteins from the dough obtained with corn flour: however, this “corn gluten” is “functionally” different from that obtained from wheat flour.
Cereal grain proteins
The study of cereal grain proteins, as seen, began with the work of Beccari. 150 years later, in 1924, the English chemist Osborne T.B., which can rightly be considered the father of plant protein chemistry, developed a classification based on their solubility in various solvents.
The classification, still in use today, divides plant proteins into 4 families.
Albumins, soluble in water.
Globulins, soluble in saline solutions; for example avenalin of oat.
Prolamins, soluble in 70 percent alcohol solution, but not in water or absolute alcohol.
They include:
gliadins of wheat;
zein of corn;
avenin of oats;
hordein of barley;
secalin of rye.
They are the toxic fraction of gluten for celiac patients.
Glutelins, insoluble in water and neutral salt solutions, but soluble in acidic and basic solutions.
They include glutenins of wheat.
Cereals
Albumins
Globulins
Prolamins*
Glutelins**
Wheat
9
5
40
46
Corn
4
2
55
39
Barley
13
12
52
23
Oats
11
56
9
23
Rice
5
10
5
80
* Gliadins in wheat ** Glutenins in wheat
Albumins and globulins are cytoplasmic proteins, often enzymes, rich in essential amino acids, such as lysine, tryptophan and methionine. They are found in the aleurone layer and embryo of the caryopsis.
Prolamins and glutelins are the storage proteins of cereal grains. They are rich in glutamine and proline, but very low in lysine, tryptophan and methionine. They are found in the endosperm, and are the vast majority of the proteins in the grains of wheat, corn, barley, oat, and rye.
Although Osborne classification is still widely used, it would be more appropriate to divide cereal grain proteins into three groups: structural and metabolic proteins, storage proteins, and defense proteins.
Wheat gluten proteins
Proteins represent 10-14 percent of the weight of the wheat caryopsis; about 80 percent of its weight consists of carbohydrates.
According to the Osborne classification, albumins and globulins represent 15-20 percent of the proteins, while prolamins and glutelins are the remaining 80-85 percent, composed respectively of gliadins, 30-40 percent, and glutenins, 40-50 percent. Therefore, and unlike prolamins and glutelins in the grains of other cereals, gliadins and glutenins are present in similar amounts, about 40 percent.
Wheat Grain Proteins
Technologically, gliadins and glutenins are very important. Why?
These proteins are insoluble in water, and in the dough, that contains water, they bind to each other through a combination of intermolecular bonds, such as:
covalent bonds, i.e. disulfide bridges;
noncovalent bonds, such as hydrophobic interactions, van der Waals forces, hydrogen bonds, and ionic bonds.
Thanks to the formation of these intermolecular bonds, a three-dimensional lattice is formed. This structure entraps starch granules and carbon dioxide bubbles produced during leavening, and gives strength and elasticity to the dough, two properties of gluten widely exploited industrially.
In the usual diet of the European adult population, and in particular in Italian diet that is very rich in derivatives of wheat flour, gliadin and glutenin are the most abundant proteins, about 15 g per day. What does this mean? It means that gluten-free diet engages celiac patients both from a psychological and social point of view.
Note: The lipids of the gluten are strongly associated with the hydrophobic regions of gliadins and glutenins and, unlike what you can do with the flour, they are extracted with more difficulty. The lipid content of the gluten depends on the lipid content of the flour from which it was obtained.
Gliadins: extensibility and viscosity
Gliadins are hydrophobic monomeric prolamins, of globular nature and with low molecular weight. On the basis of electrophoretic mobility in low pH conditions, they are separated into the following types:
alpha/beta, and gamma, rich in sulfur, containing cysteines, that are involved in the formation of intramolecular disulfide bonds, and methionines;
omega, low in sulfur, given the almost total absence of cysteine and methionine.
They have a low nutritional value and are toxic to celiac patients because of the presence of particular amino acid sequences in the primary structure, such as proline-serine-glutamine-glutamine and glutamine-glutamine-glutamine-proline.
Gliadins are associated with each other and with glutenins through noncovalent interactions; thanks to that, they act as “plasticizers” in dough making. Indeed, they are responsible for viscosity and extensibility of gluten, whose three-dimensional lattice can deform, allowing the increase in volume of the dough as a result of gas production during leavening. This property is important in bread-making.
Their excess leads to the formation of a very extensible dough.
Glutenins: elasticity and toughness
Glutenins are polymeric proteins, that is, formed of multiple subunits, of fibrous nature, linked together by intermolecular disulfide bonds. The reduction of these bonds allows to divide them, by SDS-PAGE, into two groups.
High molecular weight (HMW) subunits, low in sulfur, that account for about 12 percent of total gluten proteins. The noncovalent bonds between them are responsible for the elasticity and tenacity of the gluten protein network, that is, of the viscoelastic properties of gluten, and so of the dough.
Low molecular weight (LMW) subunits, rich in sulfur, namely, cysteine residues.
These proteins form intermolecular disulfide bridges to each other and with HMW subunits, leading to the formation of a glutenin macropolymer.
Glutenins allow dough to hold its shape during mechanical (kneading) and not mechanical stresses (increase in volume due to both the leavening and the heat of cooking that increases the volume occupied by gases present) which is submitted. This property is important in pasta making.
If in excess, glutenins lead to the formation of a strong and rigid dough.
Properties of wheat gluten
From the nutritional point of view, gluten proteins do not have a high biological value, being low in lysine, an essential amino acid. Therefore, a gluten-free diet does not cause any important nutritional deficiencies.
On the other hand, it is of great importance in food industry: the combination, in aqueous solution, of gliadins and glutenins to form a three-dimensional lattice, provides viscoelastic properties, that is, extensibility-viscosity and elasticity-tenacity, to the dough, and then, a good structure to bread, pasta, and in general, to all foods made with wheat flour.
It has a high degree of palatability and a high fermenting power in the small intestine.
It is an exorphin: some peptides produced from intestinal digestion of gluten proteins may have an effect in central nervous system.
Gluten-free cereals
The following is a list of gluten-free cereals, minor cereals, and pseudocereals used as foods.
Cereals
corn or maize (Zea mays)
rice (Oryza sativa)
Minor cereals
They are defined “minor” not because they have a low nutritional value, but because they are grown in small areas and in lower quantities than wheat, rice and maize.
Fonio (Digitaria exilis)
Millet (Panicum miliaceum)
Panic (Panicum italicum)
Sorghum (Sorghum vulgare)
Teff (Eragrostis tef)
Teosinte; it is a group of four species of the genus Zea. They are plants that grow in Mexico (Sierra Madre), Guatemala and Venezuela.
Pseudocereals.
They are so called because they combine in their botany and nutritional properties characteristics of cereals and legumes, therefore of another plant family.
Buckwheat (Fagopyrum esculentum)
Quinoa (Chenopodium quinoa), a pseudocereal with excellent nutritional properties, containing fibers, iron, zinc and magnesium. It belongs to Chenopodiaceae family, such as beets.
Cassava, also known as tapioca, manioc, or yuca (Manihot useful). It is grown mainly in the south of the Sahara and South America. It is an edible root tuber from which tapioca starch is extracted.
It should be noted that naturally gluten-free foods may not be truly gluten-free after processing. Indeed, the use of derivatives of gliadins in processed foods, or contamination in the production chain may occur, and this is obviously important because even traces of gluten are harmful for celiac patients.
Oats and gluten
Oats (Avena sativa) is among the cereals that celiac patients can eat. Recent studies have shown that it is tolerated by celiac patients, adult and child, even in subjects with dermatitis herpetiformis. Obviously, oats must be certified as gluten-free from contamination.
References
Beccari J.B. De Frumento. De bononiensi scientiarum et artium instituto atque Academia Commentarii, II. 1745:Part I.,122-127
Bender D.A. “Benders’ dictionary of nutrition and food technology”. 8th Edition. Woodhead Publishing. Oxford, 2006
Berdanier C.D., Dwyer J., Feldman E.B. Handbook of nutrition and food. 2th Edition. CRC Press. Taylor & Francis Group, 2007
Phillips G.O., Williams P.A. Handbook of food proteins. 1th Edition. Woodhead Publishing, 2011
Shewry P.R. and Halford N.G. Cereal seed storage proteins: structures, properties and role in grain utilization. J Exp Bot 2002:53(370);947-958. doi:10.1093/jexbot/53.370.947
Yildiz F. Advances in food biochemistry. CRC Press, 2009
Olive oil, which is obtained from the pressing of the olives, the fruits of olive tree (Olea europaea), is the main source of lipids in the mediterranean diet, and a good source of polyphenols.
Polyphenols, natural antioxidants, are present in olive pulp and, following pressing, they pass into the oil.
Note: olives are also known as drupes or stone fruits.
The concentration of polyphenols in olive oil is the result of a complex interaction between various factors, both environmental and linked to the extraction process of the oil itself, such as:
the place of cultivation;
the cultivars (variety);
the level of ripeness of the olives at the time of harvesting.
Their level usually decreases with over-ripening of the olives, although there are exceptions to this rule. For example, in warmer climates, olives produce oils richer in polyphenols, in spite of their faster maturation.
the climate;
the extraction process. In this regard, it is to underscore that the content of polyphenol in refined olive oil is not significant.
Any variation of the concentration of different polyphenols influence the taste, nutritional properties and stability of olive oil. For example, hydroxytyrosol and oleuropein (see below) give extra virgin olive oil a pungent and bitter taste.
Among polyphenols in olive oil, there are molecules with simple structure, such as phenolic acids and alcohols, and molecules with complex structure, such as flavonoids, secoiridoids, and lignans.
Flavonoids
Flavonoids include glycosides of flavonols (rutin, also known as quercetin-3-rutinoside), flavones (luteolin-7-glucoside), and anthocyanins (glycosides of delphinidin).
Phenolic acids and phenolic alcohols
Among phenolic acids, the first polyphenols with simple structure observed in olive oil, they are found:
hydroxybenzoic acids, such as, gallic, protocatechuic, and 4-hydroxybenzoic acids (all with C6-C1 structure).
hydroxycinnamic acids, such as caffeic, vanillin, syringic, p-coumaric, and o-coumaric acids (all with C6-C3 structure).
Among phenolic alcohols, the most abundant are hydroxytyrosol (also known as 3,4-dihydroxyphenyl-ethanol), and tyrosol [also known as 2-(4-hydroxyphenyl)-ethanol].
Hydroxytyrosol
It can be present as:
simple phenol;
phenol esterified with elenolic acid, forming oleuropein and its aglycone;
part of the molecule verbascoside.
Hydroxytyrosol
It can also be present in different glycosidic forms, depending on the –OH group to which the glucoside, i.e. elenolic acid plus glucose, is bound.
It is one of the main polyphenols in olive oil, extra virgin olive oil, and olive vegetable water.
In nature, its concentration, such as that of tyrosol, increases during fruit ripening, in parallel with the hydrolysis of compounds with higher molecular weight, while the total content of phenolic molecules and alpha-tocopherol decreases. Therefore, it can be considered as an indicator of the degree of ripeness of the olives.
In fresh extra virgin olive oil, hydroxytyrosol is mostly present in esterified form, while in time, due to hydrolysis reactions, the non-esterified form becomes the predominant one.
Finally, the concentration of hydroxytyrosol is correlated with the stability of olive oil.
Secoiridoids
They are the polyphenols in olive oil with the more complex structure, and are produced from the secondary metabolism of terpenes.
They are glycosylated compounds and are characterized by the presence of elenolic acid in their structure (both in its aglyconic or glucosidic form). Elenolic acid is the molecule common to glycosidic secoiridoids of Oleaceae.
Unlike tocopherols, flavonoids, phenolic acids, and phenolic alcohols, that are found in many fruits and vegetables belonging to different botanical families, secoiridoids are present only in plants of the Oleaceae family.
Ligstroside, oleuropein, demethyloleuropein, and nuzenide are the main secoiridoids.
In particular, oleuropein and demethyloleuropein (as verbascoside) are abundant in the pulp, but they are also found in other parts of the fruit. Nuzenide is only present in the seeds.
Oleuropein
Oleuropein, the ester of hydroxytyrosol and elenolic acid, is the most important secoiridoid, and the main olive oil polyphenol.
It is present in very high quantities in olive leaves, as also in all the constituent parts of the olive, including peel, pulp and kernel.
Oleuropein accumulates in olives during the growth phase, up to 14% of the net weight; when the fruit turns greener, its quantity reduces. Finally, when the olives turns dark brown, color due to the presence of anthocyanins, the reduction in its concentration becomes more evident.
It was also shown that its content is greater in green cultivars than in black ones.
During the reduction of oleuropein levels (and of the levels of other secoiridoids), an increase of compounds such as flavonoids, verbascosides, and simple phenols can be observed.
The reduction of its content is also accompanied by an increase in its secondary glycosylated products, that reach the highest values in black olives.
Lignans
Lignans, in particular (+)-1- acetoxypinoresinol and (+)-pinoresinol, are another group of polyphenols in olive oil.
(+)-pinoresinol is a common molecule in the lignin fraction of many plants, such as sesame (Sesamun indicum) and the seeds of the species Forsythia, belonging to the family Oleaceae. It has been also found in the olive kernel.
(+)-1- acetoxypinoresinol and (+)-1-hydroxypinoresinol, and their glycosides, have been found in the bark of the olive tree.
Lignans in Olive Oil
Lignans are not present in the pericarp of the olives, nor in leaves and sprigs that may accidentally be pressed with the olives.
Therefore, how they can pass into the olive oil becoming one of the main phenolic fractions is not yet known.
(+)-1- acetoxypinoresinol and (+)-pinoresinol are absent in seed oils, are virtually absent from refined virgin olive oil, while they may reach a concentration of 100 mg/kg in extra-virgin olive oil.
As seen for simple phenols and secoiridoids, there is considerable variation in their concentration among olive oils of various origin, variability probably related to differences between olive varieties, production areas, climate, and oil production techniques.
References
Cicerale S., Lucas L. and Keast R. Biological activities of phenolic compounds present in virgin olive oil. Int. J. Mol. Sci. 2010;11: 458-479. doi:10.3390/ijms11020458
de la Rosa L.A., Alvarez-Parrilla E., Gonzàlez-Aguilar G.A. Fruit and vegetable phytochemicals: chemistry, nutritional value, and stability. 1th Edition. Wiley J. & Sons, Inc., Publication, 2010
Manach C., Scalbert A., Morand C., Rémésy C., and Jime´nez L. Polyphenols: food sources and bioavailability. Am J Clin Nutr 2004;79(5):727-747. doi:10.1093/ajcn/79.5.727
Owen R.W., Mier W., Giacosa A., Hull W.E., Spiegelhalder B. and Bartsch H. Identification of lignans as major components in the phenolic fraction. Clin Chem 2000;46:976-988.
Tripoli E., Giammanco M., Tabacchi G., Di Majo D., Giammanco S. and La Guardia M. The phenolic compounds of olive oil: structure, biological activity and beneficial effects on human health. Nutr Res Rev 2005:18;98-112. doi:10.1079/NRR200495
During running, athletes burn calorie, and lose water and salts in amounts depending on various factors such as the technique, training level, environmental conditions, and physiological characteristics of each runner. The knowledge of these factors allows to plan an adequate diet both during workout and recovery, with the aim of optimizing performance. Below we will analyze the energy expenditure of runners engaged in workouts on various distances, the amounts of carbohydrates, lipids, and proteins oxidized to meet the energy requirements, and which minerals are lost in sweat.
During running energy expenditure is equal to 0.85-1.05 kcal per kilogram per kilometer.
This range is due to the fact that athletes with a good technique spend less than those with a poor technique.
A 70 kilogram (154 pound) athlete has an energy expenditure per kilometer between:
70 x 0.85 x 1 = 59.5 kcal
and
70 x 1.05 x 1 = 73.5 kcal
The table shows the calculations to determine the energy expenditure of the athlete to run 10, 20, 30, and 40 kilometers.
Distance
Energy expenditure
10 km
0.85 x 70 x 10 = 595 kcal
1.05 x 70 x 10 = 735 kcal
20 km
0.85 x 70 x 20 = 1190 kcal
1.05 x 70 x 20 = 1470 kcal
30 km
0.85 x 70 x 30 = 1785 kcal
1.05 x 70 x 30 = 2205 kcal
40 km
0.85 x 70 x 40 = 2380 kcal
1.05 x 70 x 40 = 2940 kcal
Note: who has started running for a short time ago has an energy expenditure even higher than 1.05 kcal per kilogram per kilometer.
During running, the energy for muscle work derives from the oxidation of carbohydrates, lipids, and proteins. Carbohydrates and lipids are the main energy source, and their oxidation rate depends on the intensity of exercise: as it increases, the percentage of lipid oxidation decreases whereas that of carbohydrates increases, as summarized below.
Intensity
Fuel
30 percent VO2max
Mainly fats
40-60 percent VO2max
Fats and carbohydrates
75 percent VO2max
Mainly carbohydrates
80 percent VO2max
Almost exclusively carbohydrates
Note: The failure to use the suitable fuel can promote fatigue and lead to overtraining.
Then, when running above the anaerobic threshold, the oxidation of carbohydrates can provide the entire energy requirement. At marathon pace, carbohydrates provide 60-70 percent of the energy requirement, whereas at lower pace they provide less than 50 percent of energy requirement.
Below, the amounts of carbohydrates, lipids, and proteins oxidized during workout are analyzed. During workout ,the energy expenditure is covered for about 60 percent by carbohydrates, for about 40 percent by lipids, whereas the residual percentage, between 3 and 5 percent, by proteins.
Carbohydrate oxidation during workout
For a 70 kilogram runner the amount of carbohydrates oxidized per kilometer is between:
(0.6 x 59.5) /4 = 8.9 g/km
and
(0.6 x 73.5) /4 = 11 g/km
Note: carbohydrates provide, on average, 4 kcal per gram.
The table shows the calculations to determine the amount of carbohydrates oxidized when the athlete runs 10, 20, 30, and 40 kilometers.
Distance
Carbohydrate expenditure
10 km
[(0.85 x 70 x 10) x 0.6 ] / 4 = 89 g
[(1.05 x 70 x 10) x 0.6 ] / 4 = 110 g
20 km
[(0.85 x 70 x 20) x 0.6] / 4 = 179 g
[(1.05 x 70 x 20) x 0.6] / 4 = 221 g
30 km
[(0.85 x 70 x 30) x 0.6] / 4 = 268 g
[(1.05 x 70 x 30) x 0.6] / 4 = 331 g
40 km
[(0.85 x 70 x 40) x 0.6] / 4 = 357 g
[(1.05 x 70 x 40) x 0.6] / 4 = 441 g
Lipid oxidation during workout
By calculations similar to those for carbohydrates, we determine the amount of lipids oxidized per kilometer, which is between:
(0.4 x 59.5) / 9 = 2.6 g/km
and
(0.4 x 73.5) / 9 = 3.3 g/km
Note: lipids provide, on average, 9 kcal per gram.
The table shows the calculations to determine the amount of lipids oxidized when the athlete runs 10, 20, 30, and 40 kilometers.
Distance
Lipid expenditure
10 km
[(0.85 x 70 x 10) x 0.4] / 9 = 26 g
[(1.05 x 70 x 10) x 0.4] / 9 = 33 g
20 km
[(0.85 x 70 x 20) x 0.4] / 9 = 53 g
[(1.05 x 70 x 20) x 0.4] / 9 = 65 g
30 km
[(0.85 x 70 x 30) x 0.4] / 9 = 79 g
[(1.05 x 70 x 30) x 0.4] / 9 = 98 g
40 km
[(0.85 x 70 x 40) x 0.4] / 9 = 106 g
[(1.05 x 70 x 40) x 0.4] / 9 = 131 g
Protein oxidation during workout
Protein requirements of adults are equal to 0.9 grams per kilogram of body weight, and, for a 70 kilogram athlete is:
70 x 0.9 = 63 g
During workout the energy expenditure is covered for about 3-5 percent by protein oxidation.
The table shows the calculations to determine the amount of proteins oxidized when the athlete runs 10, 20, 30, and 40 kilometers, and proteins provide 3 percent of the energy requirement.
Distance
Protein expenditure (3 percent)
10 km
[(0.85 x 70 x 10) x 0.03)] / 4 = 4.5 g
[(1.05 x 70 x 10) x 0.03)] / 4 = 5.5 g
20 km
[(0.85 x 70 x 20) x 0.03)] / 4 = 8.9 g
[(1.05 x 70 x 20) x 0.03)] / 4 = 11 g
30 km
[(0.85 x 70 x 30) x 0.03)] / 4 = 13.4 g
[(1.05 x 70 x 30) x 0.03)] / 4 = 16.5 g
40 km
[(0.85 x 70 x 40) x 0.03)] /4 = 17.9 g
[(1.05 x 70 x 40) x 0.03)] /4 = 22.1 g
Note: proteins provide, on average, 4 kcal per gram.
For energy expenditure of 0.85 and 1.05 kcal per kilogram per kilometer, the average additional protein oxidation per kilogram to run 10, 20, 30, and 40 kilometers, rounded to the second decimal place, is:
10 km: [(4.5 + 5.5) / 2] / 70 = 0.07 g
20 km: [(4.5 + 5.5) / 2] / 70 = 0.14 g
30 km: [(4.5 + 5.5) / 2] / 70 = 0.21 g
40 km: [(4.5 + 5.5) / 2] / 70 = 0.29 g
Finally, adding the daily protein requirement of adults, the total protein requirement of a 70 kilogram runner, for the four distances, is:
10 km: 0.07 + 0.9 = 0.97 g
20 km: 0.14 + 0.9 = 1.04 g
30 km: 0.21 + 0.9 = 1.11 g
40 km: 0.29 + 0.9 = 1.19 g
By calculations similar to the previous ones, we determine the overall protein requirement when proteins provide 5 percent of the energy requirement.
10 km: 0.12 + 0.9 = 1.02 g
20 km: 0.24 + 0.9 = 1.14 g
30 km: 0.36 + 0.9 = 1.26 g
40 km: 0.48 + 0.9 = 1.38 g
Excluding athletes who run 30 kilometers or more every day, the values are slightly higher than 0.9 grams per kilogram of body weight.
In reality, the daily protein requirement is just slightly higher because a certain amount of nitrogen, hence proteins, is lost, as well as in the urine, also through sweating.
Water and minerals loss during running
Water losses depend on the amount of sweat produced, that depends on:
air temperature and humidity;
solar radiation.
The loss will be greater the higher these values are.
Finally, the amount of sweat produced is different from person to person.
Minerals lost in sweat are mostly:
sodium and chlorine, about 1 gram per liter of sweat in heat acclimatized athletes;
potassium, in an amount equal to about 15 percent of the sodium lost;
magnesium, in an amount equal to about 1 percent of the sodium lost.
The amount of minerals lost depends on how much sweat is produced, and it increases in non-heat acclimatized athletes.
The table shows the values, in grams per liter, of the minerals lost in sweat for non-heat and heat-acclimated athletes.
Non-heat acclimated
athletes
Heat acclimated athetes
Sodium
1.38
0.92
Chlorine
1.5
1.00
Potassium
0.20
0.15
Magnesium
0.01
0.01
Total
3.09
2.08
Therefore, during physical activity, sodium is the mineral we need most of all.
After physical activity, runner, or who sweats heavily, tends to eat saltier food. This effect, known as selective hunger, was discovered, for sodium, in studies conducted on foundry workers. Probably, the selective hunger doesn’t not exist for potassium and magnesium.
References
Sawka M.N., Burke L.M., Eichner E.R., Maughan, R.J., Montain S.J., Stachenfeld N.S. American College of Sports Medicine position stand: exercise and fluid replacement. Med Sci Sport Exercise 2007;39(2):377-390. doi:10.1249/mss.0b013e31802ca597
Shirreffs S., Sawka M.N. Fluid and electrolyte needs for training, competition and recovery. J Sport Sci 2011;29:sup1, S39-S46. doi:10.1080/02640414.2011.614269
Alpha-amylase (EC 3.2.1.1) is an enzyme that catalyzes the hydrolysis of α-(1→4) glycosidic bonds present on the straight chains of amylose and amylopectin, the two major components of starch granules.[2]
It is widely distributed in animals, plants, fungi, in the Ascomycota and Basidiomycota phyla, bacteria, in the genus Bacillus, and Archaea. Its wide distribution suggests a central role in carbohydrate metabolism.[15]
In humans, alpha-amylase is encoded by two different genes, and is synthesized mainly in the parotid glands and exocrine pancreas.[9] In plants, the alpha-amylase gene family consists of six different members.[11]
In animals, it is involved in the first step of starch digestion, which leads to the release of the disaccharide maltose, the oligosaccharides maltotriose and alpha-limit dextrins, and small amounts of glucose.[5]
Since starch is the main dietary source of carbohydrates, and therefore of glucose and energy, the activity of alpha-amylase may influence postprandial blood glucose levels.[8]
Alpha-amylase is used in different industrial sectors, as well as in clinical diagnostics.[7]
In plants, and particularly in grasses such as wheat, barley and rice, it is crucial for seed germination and grain maturation.[11][17]
The first detection of an amylase activity dates back to 1811, by the Russian chemist Konstantin Sigizmundovich Kirchhoff, who, working with wheat, discovered an enzymatic activity able to broke down starch.[16]
In 1831, the German chemist Erhard Friedrich Leuchs observed the degradation of starch when mixed with human saliva. Leuchs named ptyalin the agent responsible for such degradation. A few years later, in 1833, Anselme Payen and Jean-François Persoz, French chemists who worked in a sugar factory, isolated from barley an enzyme able to degrade starch, and named it diastase.[5]
The enzyme was named alpha-amylase by Richard Kuhn, in 1925, since he discovered that the hydrolysis products were in the alpha configuration.[13]
In 1894, alpha-amylase was the first enzyme to be produced industrially, extracted from a fungal source, and used to treat digestive disorders. Later, starting from 1917, it was also extracted from Bacillus subtilis and Bacillus mesentericus. Currently, it is mainly produced by genetically modified organisms.[15]
Alpha-amylase, and more generally amylases, of which two other types are known, beta-amylase (EC 3.2.1.2) e la gamma-amylase (EC 3.2.1.3), are widely utilized in different industrial sectors, such as textiles, detergent, feed, food, the production of beer and whiskey, as well as cosmetics, pharmaceuticals, and clinical diagnostics.[7]
Alpha-amylases can be classified, based on the degree of hydrolysis of the substrate, as liquifying, if they cleave 30-40 percent of starch glycosidic bonds, and saccharifying, if they cleave 50-60 percent of the bonds.[15]
Human alpha-amylase genes
In many mammals, including humans, alpha-amylase is encoded by two distinct but closely related genes, present on the short arm of chromosome 1, and named:
AMY1, which encodes for the protein present in saliva, in mammary gland and in some tumors, such as lung tumor;[5]
AMY2, which encodes for the enzyme produced by the pancreas. AMY2 is present in two forms, AMY2A and AMY2B, whose copy number differs in different populations, although two copies per gene seems to be a frequent pattern. It also appears that copy numbers of AMY2 may be associated with those of AMY1.[9]
Activity of alpha-amylase
Alpha-amylase catalyze the first step in starch digestion, namely, the hydrolysis of α-(1→4) glycosidic bonds within the linear chains of amylose and amylopectin, acting at random location along the α-glucans. The enzyme is therefore an endoglycosidases, has an optimal pH of about 7, requires the presence of calcium ions, and leads to the release of disaccharides and oligosaccharides in alpha configuration, in particular, maltose and maltotriose from amylose, and maltose, alpha-limiting dextrins and, in small amount, glucose from amylopectin.[2]
Alpha-amylase
Alpha-amylase, like other enzymes involved in starch metabolism such as pullulanase (EC 3.2.1.41), isoamylase (EC 3.2.1.68), starch branching enzymes (EC 2.4.1.18), and starch debranching enzymes, belongs to the glycoside hydrolase families 13 or GH-13 families, enzymes capable of acting on substrates containing alpha-glycosidic bonds.[10] Two enzymes involved in trehalose metabolism also belong to this family, trehalose synthase (EC 5.4.99.16), which catalyzes the interconversion of maltose and trehalose, and trehalose 6-phosphate hydrolase (EC 3.2.1.93), which hydrolyses trehalose 6-phosphate to yield a molecule of glucose and a molecule of glucose 6-phosphate.
Salivary alpha-amylase
Salivary alpha-amylase or ptyalin is mostly synthesized by the parotid glands, and to a lesser extent by submandibular glands. It is present in a glycosylated- and non-glycosylated form, and is involved in the first, limited, stage of starch digestion in the oral cavity. The enzyme is one of the most abundant salivary proteins, accounting for 40-50 percent of the total salivary proteins, and, with lingual lipase (EC 3.1.1.3), which is involved in lipid digestion, such as digestion of triglycerides and cholesterol esters, is one of the most important salivary enzymes.[3]
Pancreatic alpha-amylase
Pancreatic alpha-amylase is synthesized by the acinar cells of the pancreas.[12] It is one of the major proteins of the pancreatic juice, and, once in the duodenum, it attacks amylose and amylopectin, completing the first stage of the amylolysis. The amylolytic products are then attacked by the alpha-glucosidases of enterocyte brush border, namely, sucrase-isomaltase (EC 3.2.1.48) and maltase-glucoamylase (EC 3.2.1.20), which are also able to hydrolyze the α-(1→2) glycosidic bond of sucrose.[14]
Mammalian pancreatic alpha-amylase is able to bind to N-linked glycans of brush border membrane glycoproteins.[1] Such bond allows the cooperation with sucrase-isomaltase, cooperation that leads to a high increase in glucose production, up to 240 percent. However, it has been observed that glucose uptake by SGLT1, an intestinal transporter involved in the absorption of monosaccharides, is inhibited at high alpha-amylase concentrations in the intestinal lumen. It has been hypothesized that this inhibition may represent an innate regulatory mechanism to avoid sudden increases in glucose absorption and thus facilitate the regulation of postprandial blood glucose levels.[6]
Blood sugar control
Postprandial glycemic control is considered an effective strategy in preventing the development of type II diabetes. Among non-pharmacological methods there is the reduction of the ability of alpha-amylase to attack starch through a food processing leading to starch retrogradation, or by means of molecules present in foods which, with different modes of action, are able to reduce its activity.[8]
Food processing
Starch rich foods are subjected to hydrothermal treatments, such as cooking in boiling water, that cause starch granule gelatinization, namely, they absorb water, swell and lose most of their crystalline structures, which is replaced by amorphous structures, more easily attacked by alpha-amylases.[4] If gelatinized starch is allowed to cool, recrystallization can occur leading to give what is known as retrograded starch, a type of starch resistant to the action of alpha-amylase, which reaches the colon practically intact where it is fermented by the bacteria of the gut microbiota, like soluble fiber.
Role of polyphenols
The digestion of starch by alpha-amylase is affected by molecules present in foods, such as non-starch cell wall polysaccharides, proteins, lipids, and, among phytochemicals, various types of polyphenols.[4] These compounds can limit the action of alpha-amylase in at least four ways.[8]
Proteins and non-starch polysaccharides are able to limit the loss of the ordered structure of native starch during the hydrothermal processes to which the food is subjected during processing;
Lipids, polyphenols, proteins and non-starch polysaccharides are able to form ordered structures with starch.
Proteins, non-starch polysaccharides and polyphenols are able to form physical barriers that reduce the accessibility of hydrolytic enzymes to alpha-glucan chains.
Polyphenols and non-starch polysaccharides are able to reduce the activity of alpha-amylases and alpha-glucosidases.
Among polyphenols, flavonoids such as proanthocyanidins or condensed tannins seem to be important.[8] In order to be effective, the intake of foods rich in polyphenols, such as black tea or green tea, must be associated with a meal rich in carbohydrates. Gluten seems able to hinder the interaction between polyphenols and starch granules, and therefore reduce their inhibitory effect.
Amylase activity in clinical biochemistry
The assay of serum alpha-amylase activity is used diagnostic laboratory test.[7]
Increased serum levels of amylase activity may result from:
acute pancreatitis or a flare-up of chronic pancreatitis;
inflammation of the parotid glands;
obstruction of the secretory ducts of the parotid glands or the pancreatic duct.
Assays currently in use do not distinguish between salivary and pancreatic isoforms. However, if the increase in amylase activity is associated with an increase in lipase activity, the underlying pathology is probably of pancreatic origin.
Wheat alpha-amylase
In plants, and in particular in wheat, alpha-amylase plays a role in the germination and malting, which is a controlled germination that leads to the conversion of the grain into malt, which is also used for the production of whiskey and beer.[11]
In wheat grains, the enzyme is mainly synthesized in the early stages of germination, which are heterotrophic as they rely heavily on stored resources, and therefore also on the starch present in the endosperm.[17] The synthesis occurs in the aleurone layer, and initiates the mobilization of starch reserves.
Alpha-amylase is also involved in one of the main defects of wheat, pre-harvest germination.
References
^ Asanuma-Date K., Hirano Y., Le N., Sano K., Kawasaki N., Hashii N., Hiruta Y., Nakayama K., Umemura M., Ishikawa K., Sakagami H., and Ogawa H. Functional regulation of sugar assimilation by N-glycan-specific interaction of pancreatic α-amylase with glycoproteins of duodenal brush border membrane. J Biol Chem 2012;287(27):23104-18. doi:10.1074/jbc.m111.314658
^ ab Benjamin S., Smitha R.B., Jisha V.N., Pradeep S., Sajith S., Sreedevi S., Priji P., Unni K.N., Sarath Josh M.K. A monograph on amylases from Bacillus spp. Adv biosci biotechnol 2013;4:No.2. doi:10.4236/abb.2013.42032
^ Boehlke C., Zierau O., Hannig C. Salivary amylase – The enzyme of unspecialized euryphagous animals. Arch Oral Biol 2015;60(8):1162-76. doi:10.1016/j.archoralbio.2015.05.008
^ ab Butterworth P.J., Bajka B.H., Edwards C.H., Warren F.J., Ellis P.R. Enzyme kinetic approach for mechanistic insight and predictions of in vivo starch digestibility and the glycaemic index of foods. Trends Food Sci Technol 2022;120:254-264. doi:10.1016/j.tifs.2021.11.015
^ abc Butterworth P.J., Warren F.J. and Ellis P.R. Human α-amylase and starch digestion: an interesting marriage. Starch/Stärke 2011;63:395-405. doi:10.1002/star.201000150
^ Date K., Satoh A., Lida K., Ogawa H. Pancreatic α-amylase controls glucose assimilation by duodenal retrieval through N-glycan-specific binding, endocytosis, and degradation. J Biol Chem 2015;290(28):17439-50. doi:10.1074/jbc.M114.594937
abc de Souza P.M., de Oliveira Magalhães P. Application of microbial α-amylase in industry – A review. Braz J Microbiol 2010;41(4):850-61. doi:10.1590/S1517-83822010000400004
^ abcd Gong L., Feng D., Wang T., Ren Y., Liu Y., Wang J. Inhibitors of α-amylase and α-glucosidase: potential linkage for whole cereal foods on prevention of hyperglycemia. Food Sci Nutr 2020;8(12):6320-6337. doi:10.1002/fsn3.1987
^ ab Iafrate A.J., Feuk L., Rivera M.N., Listewnik M.L., Donahoe P.K., Qi Y., Scherer S.W, Lee C. Detection of large-scale variation in the human genome. Nature Genetics. 2004;36:949–951. doi:10.1038/ng1416
^ Janeček Š., Svensson B., MacGregor E.A. α-Amylase: an enzyme specificity found in various families of glycoside hydrolases. Cell Mol Life Sci 2014;71(7):1149-70. doi:10.1007/s00018-013-1388-z
^ abc Ju L., Pan Z., Zhang H., Li Q., Liang J., Deng G., Yu M., Long H. New insights into the origin and evolution of α-amylase genes in green plants. Sci Rep 2019;9(1):4929. doi:10.1038/s41598-019-41420-w
^ Keller P.J., Allan B.J. The protein composition of human pancreatic juice. J Biol Chem 196725;242(2):281-7. doi:10.1016/S0021-9258(19)81461-8
^ Kuhn R. Mechanism of the action of amylases. Constitution of starch. Justus Liebigs Annalen der Chemie 1925;443:1-71
^ Nichols B.L., Avery S., Sen P., Swallow D.M., Hahn D., Sterchi E. The maltase-glucoamylase gene: common ancestry to sucrase-isomaltase with complementary starch digestion activities. Proc Natl Acad Sci U S A. 2003 Feb 4;100(3):1432-7. doi:10.1073/pnas.0237170100
^ abc Tiwari S.P., Srivastava R., Singh C.S., Shukla K., Singh R.K., Singh P., Singh R., Singh N.L., and Sharma R. Amylases: an overview with special reference to alpha amylase. Journal of Global Biosciences 2015;4(SI1):1886-1901.
^ Zakowski J.J., Bruns D.E. Biochemistry of human alpha amylase isoenzymes. Crit Rev Clin Lab Sci 1985;21(4):283-322. doi:10.3109/10408368509165786
^ ab Zhang Q., Pritchard J., Mieog J., Byrne K., Colgrave M.L., Wang J.R., Ral J.F. Over-expression of a wheat late maturity alpha-amylase type 1 impact on starch properties during grain development and germination. Front Plant Sci 2022;13:811728. doi:10.3389/fpls.2022.811728
gamma-Linolenic acid (GLA), one of the omega-6 polyunsaturated fatty acids, like its precursor linoleic acid (the most abundant polyunsaturated fatty acid in human skin epidermis, where it’s involved in the maintenance of the epidermal water barrier), plays important roles in the physiology and pathophysiology of the skin.
Studies conducted on humans revealed that gamma-linolenic acid:
improves skin moisture, firmness, roughness;
decreases transepidermal water loss (one of the abnormalities of the skin in essential fatty acid deficiency animals).
Prostaglandin E1
Using guinea pig skin epidermis as a model of human epidermis (they are functionally similar), it was demonstrated that supplementation of animals with gamma-linolenic acid-rich foods results in a major production of PGE1 and 15-HETrE in the skin (as previously demonstrated in in vitro experiments).
Because these molecules have both anti-inflammatory/anti-proliferative properties supplementation of diet with gamma-linolenic acid acid-rich foods may be an adjuncts to standard therapy for inflammatory/proliferative skin disorders.
Supplemental sources of GLA
The main supplemental sources of gamma-linolenic acid are oils of the seeds of:
black currant (from 15% to 19% of the total fatty acids);
evening primrose (from 7% to 14% of the total fatty acids), and
Role of gamma-linolenic acid in lowering blood pressure
The relationship between dietary fatty acid intake and blood pressure mainly comes from studies conducted on genetically modified rats that spontaneously develops hypertension (a commonly used animal model for human hypertension).
In these studies many membrane abnormalities were seen so hypertension in rat model may be related to change in polyunsaturated fatty acid metabolism at cell membrane level.
About polyunsaturated fatty acids, several research teams have reported that gamma-linolenic acid reduces blood pressure in normal and genetically modified rats (greater effect) and it was purported by interfering with Renin-Angiotensin System (that promote vascular resistance and renal retention) altering the properties of the vascular smooth muscle cell membrane and so interfering with the action of angiotensin II.
Another possible mechanism of action of gamma-linolenic acid to lower blood pressure could be by its metabolite dihomo-gamma-linolenic acid: it may be incorporated in vascular smooth muscle cell membrane phospholipids, then released by the action of phospholipase A2 and transformed by COX-1 in PGE1 that induces vascular smooth muscle relaxation.
Role gamma-linolenic acid in treatment of rheumatoid arthritis
In a study conducted by Leventhal et al. on 1993 it was demonstrated the dietary intake of higher concentration of borage oil (about 1400 mg of gamma-linolenic acid/day) for 24 weeks resulted in clinically significant reductions in signs and symptoms of rheumatoid arthritis activity.
In a subsequent study by Zurier et al. on 1996 the dietary intake of an higher dose (about 2.8 g/day gamma-linolenic acid) for 6 months reduced, in a clinically relevant manner, signs and symptoms of the disease activity; patients who remained for 1 year on the 2.8 g/day dietary gamma-linolenic acid exhibited continued improvement in symptoms (the use of gamma-linolenic acid also at the above higher dose is well tolerated, with minimal deleterious effects). These data underscore that the daily amount and the duration of gamma-linolenic acid dietary intake do correlate with the clinical efficacy.
References
Akoh C.C. and Min D.B. “Food lipids: chemistry, nutrition, and biotechnology” 3th ed. 2008
Chow Ching K. “Fatty acids in foods and their health implication” 3th ed. 2008
Fan Y.Y. and Chapkin R.S. Importance of dietary γ-linolenic acid in human health and nutrition. J Nutr 1998;128:1411-1414. doi:10.1093/jn/128.9.1411
Leventhal L.J., Boyce E.G. and Zurier R.B. Treatment of rheumatoid arthritis with gammalinolenic acid. Ann Intern Med 1993;119:867-873. doi:10.7326/0003-4819-119-9-199311010-00001
Miller C.C. and Ziboh V.A. Gammalinolenic acid-enriched diet alters cutaneous eicosanoids. Biochem Biophys Res Commun 1988;154:967-974. doi:10.1016/0006-291X(88)90234-3
Zurier R.B., Rossetti R.G., Jacobson E.W., DeMarco D.M., Liu N.Y., Temming J.E., White B.M. and Laposata M. Gamma-linolenic acid treatment of rheumatoid arthritis. A randomized, placebocontrolled trial. Arthritis Rheum 1996;39:1808-1817. doi:10.1002/art.1780391106
Many studies have shown a direct, dose-dependent relationship between alcohol intake and blood pressure, particularly for intake above two drinks per day.
This relationship is independent of:
age;
salt intake;
obesity;
finally, it persists regardless of beverage type.
Furthermore, heavy consumption of alcoholic beverages for long periods of time is one of the factors predisposing to hypertension: from 5 to 7% of hypertension cases is due to an excessive alcohol consumption.
A meta-analysis of 15 randomized controlled trials has shown that decreasing alcoholic beverage intake intake has therapeutic benefit to hypertensive and normotensive with similar systolic and diastolic blood pressure reductions (in hypertensive reduction occurs within weeks).
Guidelines on the primary prevention of hypertension recommend that alcohol (ethanol) consumption in most men, in absence of other contra, should be less than 28 g/day, the limit in which it may reduce coronary heart disease risk. The consumption limited to these quantities must be obtained by intake of drinks with low ethanol content, preferably at meals (drinking even lightly to moderately outside of meals increases the probability to have hypertension). This means no more than 680 ml or 24 oz of regular beer or 280 ml or 10 oz of wine (12% ethanol), especially in hypertension; for women and thinner subjects consumption should be halved1.
To avoid intake of drinks with high ethanol content even though the total ethanol content not exceeding 28 g/day.
Relationship between ethanol intake and blood pressure
Anyway, uncertainty remains regarding benefits or risks attributable to light-to-moderate alcoholic beverage intake on the risk of hypertension.
In a study published on April 2008, the authors examined the association between ethanol intake and the risk of developing hypertension in 28848 women from “The Women’s Health Study” and 13455 men from the “Physicians’ Health Study”, (the follow-up lasted respectively for 10.9 and 21.8 years). The study confirms that heavy ethanol intake (exceeding 2 drinks/day) increases hypertension risk in both men and women but, surprisingly, found that the association between light-to-moderate alcohol intake (up to 2 drinks/day) and the risk of developing hypertension is different in women and men. Women have a potential reduced risk of hypertension from a light-to-moderate ethanol consumption with a J-shaped association2; men have no benefits of light-to-moderate ethanol consumption but an increased risk of hypertension.
However, guidelines for the primary prevention of hypertension limit alcohol consumption to less 2 drinks/day in men and less 1 drink/day in thinner subjects and women.
1. A standard drink contains approximately 14 g of ethanol i.e. a 340 ml or 12 oz of regular beer, 140 ml or 5 oz wine (12% alcohol), or 42 ml or 1,5 oz of distilled spirits (inadvisable).
2. Many studies have shown a J-shaped relationship between ethanol intake and blood pressure. Light drinker (no more than 28 g of ethanol/day) have lower blood pressure than teetotalers; instead, who consumes more than 28 g ethanol/day have higher blood pressure than non drinker. So alcohol is a vasodilator at low doses but a vasoconstrictor at higher doses.
Sesso H.D., Cook N.R., Buring J.E., Manson J.E. and Gaziano J.M. Alcohol consumption and the risk of hypertension in women and men. Hypertension 2008;51:1080-1087. doi:10.1161/HYPERTENSIONAHA.107.104968
Writing Group of the PREMIER Collaborative Research Group. Effects of comprehensive lifestyle modification on blood pressure control: main results of the PREMIER Clinical Trial. JAMA 2003;289:2083-2093. doi:10.1001/jama.289.16.2083
World Health Organization, International Society of Hypertension Writing Group. 2003 World Health Organization (WHO)/International Society of Hypertension (ISH) statement on management of hypertension. Guidelines and recommendations. J Hyperten 2003;21:1983-1992.
Trans fatty acids or TFA or trans-unsaturated fatty acids or trans fats are unsaturated fatty acids , a subclass of lipids, with at least one a double bond in the trans configuration.
Carbon-carbon double bonds show planar conformation, and so they can be considered as planes from whose opposite sides carbon chain attaches and continues. “The entry” and “the exit” of the carbon chain from the plain may occur on the same side of the plain, and in this case double bond is in cis configuration, or on opposite side, and in that case it is in trans configuration. This is an example of geometric isomerism, also called cis-trans isomerism.
C18:1 cis/trans Isomers
Unsaturated fatty acids most commonly have their double bonds in cis configuration; the other, less common configuration is trans. Cis bond causes a bend in the fatty acid chain, whereas the geometry of trans bond straightens the fatty acid chain, imparting a structure more similar to that of saturated fatty acids.
Below, some distinctive characteristics of the fats rich in trans fats, that make them particularly suited for the production of margarines and vegetable shortening used in home and commercial cooking, and manufacturing processes.
Bent molecules can’t pack together easily, but linear ones can do it.
This means that trans fatty acids contribute, together with the geometrically similar saturated fatty acids, to the hardness of the fats in which they are, giving them a higher melting point.
Heightening the melting point of fats means that it is possible to convert them from liquid form to semi-solids and solids at room temperature.
Note: trans fats tend to be less solid than saturated fatty acids.
They have a melting point, consistency and “mouth feel” similar to those of butter, a long shelf life at room temperature, and a flavor stability.
They are stable during frying.
Types of trans fatty acids
Dietary TFA come from different sources briefly reviewed below.
In industrialized countries, greater part of the consumed trans fatty acids, in USA about 80 percent of the total, are produced industrially, in varying amounts, during partial hydrogenation of edible oils containing unsaturated fatty acids.
They are produced at home during frying with vegetable oils containing unsaturated fatty acids.
They come from bacterial transformation of unsaturated fatty acids ingested by ruminants in their rumen.
Another natural source is represented by some plant species, such as leeks, peas, lettuce and spinach, that contain trans-3-hexadecenoic acid, and rapeseed oil, that contains brassidic acid (22:1∆13t) and gondoic acid (20:1∆11t). In these sources trans fatty acids are present in small amounts.
Very small amounts, less than 2 percent, are formed during deodorization of vegetable oils, a process necessary in the refining of edible oils. During this process trans fatty acids with more than one double bond are formed in small amounts. These isomers are also present in fried foods and in considerable amounts in some partially hydrogenated vegetable oils.
Industrial trans fatty acids
Hydrogenation is a chemical reaction in which hydrogen atoms react, in the presence of a catalyst, with a molecule.
The hydrogenation of unsaturated fatty acids involves the addition of hydrogen atoms to double bonds on the carbon chains of fatty acids. The reaction occurs in presence of metal catalyst and hydrogen, and is favored by heating vegetable oils containing unsaturated fatty acids.
Partial hydrogenation of vegetable oils
The process of hydrogenation was first discovered in 1897 by French Nobel prize in Chemistry, jointly with fellow Frenchman Victor Grignard, Paul Sabatier using a nickel catalyst.
Partially hydrogenated vegetable oils were developed in 1903 by a German chemist, Wilhelm Normann, who files British patent on “Process for converting unsaturated fatty acids or their glycerides into saturated compounds”. The term trans fatty acids or trans fats appeared for the first time in the Remark column of the 5th edition of the “Standard Tables of Food Composition” in Japan.
During partial hydrogenation, an incomplete saturation of the unsaturated sites on the carbon chains of unsaturated fatty acids occurs. For example, with regard to fish oil, trans fatty acid content in non-hydrogenated oils and in highly hydrogenated oils is 0.5 and 3.6 percent, respectively, whereas in partially hydrogenated oils is 30 percent.
From Oleic Acid to Vaccenic Acid
But, most importantly, some of the remaining cis double bonds may be moved in their positions on the carbon chain, producing geometrical and positional isomers, that is, double bonds can be modified in both conformation and position.
Below, other changes that occur during partial hydrogenation are listed.
Cyclic monomers, as well as intramolecular linear dimmers, are also formed.
Partially hydrogenated vegetable oils were developed for the production of vegetable fats, a cheaper alternative to animal fats. In fact, through hydrogenation, oils such as soybean, safflower and cottonseed oils, which are rich in unsaturated fatty acids, are converted into semi-solid fats.
The first hydrogenated oil was cottonseed oil in USA in 1911 to produce vegetable shortening.
In the 1930’s, partial hydrogenation became popular with the development of margarine.
Currently, per year in USA, 6-8 billion tons of hydrogenated vegetable oil are produced.
Ruminant trans fatty acids
Ruminant trans fats are produced by bacteria in the rumen of the animals, for example cows, sheep and goats, using as a substrate a proportion of the relatively small amounts of unsaturated fatty acids present in their feedstuffs, that is, feed, plants and herbs. And, considering an animal that lives at least a year, and has the opportunity to graze and/or eat hay, there is a season variability in unsaturated fatty acids intake, and trans fats produced. In fact, in summer and spring, pasture plants and herbs may contain more unsaturated fatty acids than the winter feed supply.
Then, TFA are present at low levels in meat and full fat dairy products, typically <5 percent of total fatty acids, and are located in the sn-1 and sn-3 positions of the triacylglycerols, whereas in margarines and other industrially hydrogenated products they appear to be concentrated in the sn-2 position of the triacylglycerols.
Ruminant trans fatty acids are mainly monounsaturated fatty acids, with 16 to 18 carbon atoms, and constitute a small percentage of the trans fatty acids in the diet.
Isomers
The most important cluster of trans fatty acids is trans-C18:1 isomers, that is, fatty acids containing 18 carbon atoms plus one double bond, whose position varies between Δ6 and Δ16 carbon atoms. In both sources, the most common isomers are those with double bonds between positions Δ9 and Δ11.
However, even if these molecules are present both in industrial and ruminant TFA, there is a considerable quantitative difference. For example, vaccenic acid (C18:1 Δ11t) represents over 60 percent of the trans-C18:1 isomers in ruminant trans fatty acids, whereas in industrial ones elaidic acid (C18:1Δ9t) comprises 15-20 percent and C18:1 Δ10t and vaccenic acid over 20 percent each others.
trans-C18:1 Isomers
Effects on human health
Ruminant trans fatty acids, in amounts actually consumed in diets, are not harmful for human health.
Conversely, consumption of industrial trans fats has neither apparent benefit nor intrinsic value, above their caloric contribution, and, from human health standpoint they are only harmful, having adverse effects on:
serum lipid levels;
endothelial cells;
systemic inflammation;
other risk factors for cardiovascular disease.
Moreover, they are positively associated with the risk of coronary heart disease (CHD), and sudden death from cardiac causes and diabetes.
Note: further in the text, we will refer to industrial trans fatty acids as trans fats or trans fatty acids.
Effects at plasmatic level
Low-density lipoprotein cholesterol (LDL-C) and high-density lipoprotein cholesterol (HDL-C) plasma levels are well-documented risk markers for the development of coronary heart disease or CHD.
High LDL-C levels are associated with an increased incidence of ischemic heart disease.
High HDL-C levels are associated with a reduced incidence of the risk.
For this reason, the ratio between total cholesterol level and HDL-C is often used as a combined risk marker for these two components in relation to the development of heart disease: the higher the ratio, the higher the risk.
TFA, as previously said, have adverse effects on serum lipids.
These effects have been evaluated in numerous controlled dietary trials by isocaloric replacement of saturated fatty acids or cis-unsaturated fatty acids with trans fats. It was demonstrated that such replacement:
raises LDL-C levels;
lowers HDL-C levels, in contrast to saturated fatty acids that increase HDL-C levels when used as replacement in similar study;
increases the ratio of total cholesterol to HDL-C, approximately twice that for saturated fatty acids, and, on the basis of this effect alone, trans fatty acids has been estimated to cause about 6% of coronary events in the USA.
Furthermore, trans fats:
produce a deleterious increase in small, dense LDL-C subfractions, that is associated with a marked increased in the risk of CHD, even in the presence of relatively normal LDL-C;
increase the blood levels of triglycerides, and this is an independent risk factor for CHD;
increase levels of Lp(a)lipoprotein, another important coronary risk factor.
But on 2004 prospective studies have shown that the relation between the intake of trans fatty acids and the incidence of CHD is greater than that predicted by changes in serum lipid levels alone. This suggests that trans fats influence other risk factors for CHD, such as inflammation and endothelial-cell dysfunction.
Inflammation and endothelial-cell dysfunction
The role of inflammation in atherosclerosis, and consequently in CHD, is burgeoned in the last decade.
Interleukin-6, C-reactive protein (CRP), and an increased activity of tumor necrosis factor (TNF) system are markers of inflammation.
In women greater intake of trans fatty acids is associated with increased activity of TNF system, and in those with a higher body mass index with increased levels of interleukin-6 and CRP. For example, the difference in CRP seen with an average intake of trans fats of 2.1 percent of the total daily energy intake, as compared with 0.9 percent, correspond to an increased risk of cardiovascular disease of 30 percent. Similar results have been reported in patients with established heart disease, in randomized, controlled trials, in in vitro studies, and in studies in which it has been analyzed membrane levels of trans fatty acids, a biomarker of their dietary intake.
So, trans fats promote inflammation, and their inflammatory effects may account at least in part for their effects on CHD that, as seen above, are greater than would be predicted by effects on serum lipoproteins alone.
Attention: the presence of inflammation is an independent risk factor not only for CHD but also for insulin resistance, diabetes, dyslipidemia, and heart failure.
Another site of action of TFA may be endothelial function.
Several studies have suggested the association between greater intake of trans fats and increased levels of circulating biomarkers of endothelial dysfunction, such as E-selectin, sICAM-1, and sVCAM-1.
Other effects
In vitro studies have demonstrate that trans fats affect lipid metabolism through several pathways.
They alter secretion, lipid composition, and size of apolipoprotein B-100 (apo B-100).
They increase cellular accumulation and secretion of free cholesterol and cholesterol esters by hepatocytes.
They alter expression in adipocytes of genes for peroxisome proliferator-activated receptor-gamma (PPAR-gamma), lipoprotein lipase, and resistin, proteins having a central roles in the metabolism of fatty acids and glucose.
Coronary heart disease
Industrial trans fats are independent cardiovascular risk factor.
Since the early 1990s attention has been focused on the effect of trans fatty acids on plasma lipid and lipoprotein concentrations.
Furthermore, four major prospective studies covering about 140,000 subjects, monitored for 6-14 years, have all found positive epidemiological evidence relating their levels in the diet, assessed with the aid of a detailed questionnaire on the composition of the diet, to the risk of CHD. These four studies are:
The Health Professionals Follow-up study;
The Alpha-Tocopherol Beta-Carotene Cancer Prevention Study;
The Nurses’ Health Study;
The Zutphen Elderly Study.
These studies cover such different populations that the results very probably hold true for the populations as a whole.
A meta-analysis of these studies have shown that a 2 percent increase in energy intake from industrial TFA was associated with a 23 percent increase in the incidence of CHD. The relative risk of heart disease was 1.36 in “The Health Professionals Follow-up Study”, 1.14 in “The Alpha-Tocopherol Beta-Carotene Cancer Prevention Study”; 1.93 (1.43-2.61) in “The Nurses’ Health Study”, and 1.28 (1.01-1.61) in “The Zutphen Elderly Study”.
So, there is a substantially increased risk even at low levels of intake: 2 percent of total energy intake, for a 2,000 Kcal diet is 40 Kcal or about 4-5 g of fat corresponding to a teaspoonful of fat!
Moreover, in three of the studies, the association between the intake of industrial trans fats and the risk of CHD was stronger than a corresponding association between the intake of saturated fatty acids and the risk of heart disease. In “The Zutphen Elderly Study”, this association was not investigated.
Because of the adverse effects of industrial trans fatty acids, for the same authors are unethical conducting randomized long-term trials to test their effects on the incidence of CHD.
So, avoidance of industrial trans fats, or a consumption of less 0.5% of total daily energy intake is necessary to avoid their adverse effects, far stronger on average than those of food contaminants or pesticide residues.
Further evidence
A study conducted in an Australia population with a first heart attack and no preceding history of CHD or hyperlipidemia has showed a positive association between levels of trans fatty acids in adipose tissue and the risk of nonfatal myocardial infarction.
It was shown that adipose tissue C18:1Δ7t, found in both animal and vegetable fats, was an independent predictor of a first myocardial infarction, that is, its adipose tissue level is still a predictor for heart disease after adjustment for total cholesterol. Again, it appears that only a minor part of the negative effects of trans fats occurs via plasma lipoproteins.
During the course of this study, mid-1996, TFA were eliminated from margarines sold in Australia. This was a unique opportunity to investigate the temporal relationship between trans fat intake and their adipose tissue levels. It was demonstrated that trans fats disappear from adipose tissue of both case-patients and controls with a rate about 15 percent of total trans fats/y.
Another study conduct in Costa Rica have found a positive association between myocardial infarction and trans fatty acids.
Interestingly, in a larger, community-based case-control study, levels of trans fats in red blood cell membranes were associated, after adjustment for other risk factors, with an increase in the risk of sudden cardiac death. Moreover, the increased risk appeared to be related to trans-C18:2 levels, that were associated with a tripling of the risk, but not with cell membrane levels of trans-C18:1, the major trans fatty acids in foods (see above).
Diabetes
In a prospective study covering 84,204 female nurses, from “The Nurses’ Health Study”, aged 34–59 y, analyzed from the 1980 to 1996, with no cancer, diabetes, or cardiovascular disease at base line, the intake of trans fatty acids was significantly related to the risk of developing type 2 diabetes. And, after adjustment for other risk factors trans fat intake was positively associated with the incidence of diabetes with a risk up to 39 percent greater.
Data from controlled intervention studies showed that TFA could impair insulin sensitivity in subjects with insulin resistance and type 2 diabetes (saturated fatty acids do the analogous response, with no significant difference between TFA and them) more than unsaturated fatty acids, in particular the isomer of conjugated linoleic acid (CLA) trans-10, cis-12-CLA. Be careful because some dietary supplements contain CLA isomers and may be diabetogenic and proatherogenic in insulin-resistant subjects.
No significant effect was seen in insulin sensitivity of lean, healthy subjects.
Ruminant trans fatty acids and the risk of CHD
Four prospective studies have evaluated the relation between the intake of ruminant trans fatty acids and the risk of CHD: no significant association was identified.
In another study published on 2008 was analyzed data from four Danish cohort studies that cover 3,686 adults enrolled between 1974 and 1993, and followed for a median of 18 years. In Denmark, consumption of dairy products is relatively high and the range of ruminant trans fat intake is relatively broad, up to 1.1 percent of energy. Conversely, in the other countries, ruminant trans fatty acid consumption for most people is substantially lower than 1 percent of energy, in USA about 0.5 percent of energy. After adjustment for other risk factors, no significant associations between ruminant TFA consumption and incidence of CHD were found, confirming, in a population with relatively high intake of ruminant trans fatty acids, conclusions of four previous prospective studies.
So ruminant trans fats, in amounts actually consumed in diets, do not raise CHD risk.
The absence of risk of CHD with trans fats from ruminants as compared with industrial trans fatty acids may be due to a lower intake. In the USA, greater part of trans fats have industrial origin (see above); moreover trans fat levels in milk and meats are relatively low, 1 to 8 percent of total fats.
The absence of a higher risk of CHD may be due also to the presence of different isomers. Ruminant and industrial sources share many common isomers, but there are some quantitative difference (see fig. 4):
vaccenic acid level is higher in ruminant fats, 30-50 percent of trans isomers;
trans-C18:2 isomers, present in deodorized and fried vegetable oils, as well as in some partially hydrogenated vegetable oils, are not present in appreciable amounts in ruminants fats.
Finally other, still unknown, potentially protective factors could outweigh harmful effects of ruminant trans fats.
Trans fatty acids: legislation regulating their content
USA
Until 1985 no adverse effects of trans fatty acids on human health was demonstrated, and in 1975 a Procter & Gamble study showed no effect of trans fats on cholesterol.
Their use in fast food preparation grew up from 1980’s, when the role of dietary saturated fats in increasing cardiac risk began clear. Then, it was led a successful campaign to get McDonald’s to switch from beef tallow to vegetable oil for frying its French fries. Meanwhile, studies began to raise concerns about their effects on health. On 1985 Food and Drug Administration (FDA) concluded that TFA and oleic acid affected serum cholesterol level similarly, but from the second half of 1985 their harmful began clear, and the final proof came from both controlled feeding trials and prospective epidemiologic studies.
On 2003 FDA ruled that food labels, for conventional foods and supplements, show their content beginning January 1, 2006. Notably, this ruling was the first substantive change to food labeling since the requirement for per-serving food labels information was added in 1990.
On 2005 The US Department of Agriculture made a minimized intake of trans fatty acids a key recommendation of the new food-pyramid guidelines.
The American Heart Association, on 2006, recommended to limit their intake to 1% of daily calorie consumption, and suggested food manufacturers and restaurants switch to other fats.
On 2006 New York City Board of Health announced trans fat ban in its 40,000 restaurants within July 1, 2008, followed by the state of California in 2010-2011.
Australia
After June 1996 they were eliminated from margarine sold in Australia, that before contributed about 50% of their dietary intake.
Europe
On March 11, 2003 the Danish government, after a debate started in 1994 and two new reports in 2001 and 2003, decided to phase out the use of industrial trans fats in food before the end of 2003. Two years later, however, the European Commission (EC) asked Denmark to withdraw this law, which was not accepted on the European Community level, unfortunately. However, in 2007, EC decided to closes its infringement procedure against Denmark because of increasing scientific evidence of the danger of this type of fatty acids.
The Danish example was followed by Austria and Switzerland in 2009, Iceland, Norway, and Hungary in 2011, and most recently, Estonia and Georgia in 2014. So, about 10 percent of the European Union population, about 500 million people, lives in countries where it is illegal to sell food high in industrial trans fats.
Governments of other European Union countries instead rely on the willingness of food producers to reduce trans fatty acid content in their products. This strategy has proved effective only for Western European countries.
Canada
Canada is considering legislation to eliminate them from food supplies, and, in 2005, ruled that pre-packaged food labels show their content.
Therefore, with the exception of the countries where the use of trans fats in the food industry was banned, the only way to reduce their intake in the other countries is consumer’s decision to choose foods free in such fatty acids, avoiding those known containing them, and always reading nutrition facts and ingredients because they may come from margarine, vegetable oil and frying. Indeed, for example in the USA, the producers of foods that contain less than 0.5 g of industrial trans fatty acids per serving can list their content as 0 on the packaging. This content is low but if a consumer eats multiple servings, he consumes substantial amount of them.
Be careful: food labels are not obligatory in restaurants, bakeries, and many other retail food outlets.
Food reformulation
Public health organizations, including the World Health Organization in September 2006, have recommended reducing the consumption of industrial trans fatty acids; only in USA the near elimination of these fatty acids might avoid between 72,000 and 280,000 of the 1.2 million of CHD events every year.
Food manufacturers and restaurants may reduce industrial TFA use choosing alternatives to partially hydrogenated oils.
In Denmark, their elimination from vegetable oils did not increase consumption of saturated fatty acids because they were mostly replaced with cis-unsaturated fatty acids. Moreover, there were no noticeable effects for the consumer: neither increase in the cost nor reduction in availability and quality of foods.
In 2009, Stender et al. have shown that industrial trans fatty acids in food such as French fries, cookies, cakes, and microwave-oven popcorn purchased in USA, South Africa, and many European Country can be replaced, at similar prices, with a mixture of saturated, monounsaturated, and polyunsaturated fatty acids. Such substitution has even greater nutritional benefit than one-to-one substitution of industrial trans fats with saturated fatty acids alone. However, be careful because only in French fries with low industrial trans fats the percentage of saturate fatty acids remains constant, whereas in cookies and cakes is in average +33 percentage points and microwave-oven popcorn +24 percentage points: saturated fatty acids are less dangerous than industrial trans fats but more than mono- and polyunsaturated fatty acids.
The same research group, analyzing some popular foods in Europe, purchased in supermarkets, even of the same supermarket chain, and fast food, namely, McDonald’s and Kentucky Fried Chicken (KFC), from 2005 to 2014, showed that their TFA content was reduced or even absent in several Western European countries while remaining high in Eastern and Southeastern Europe.
In 2010 Mozaffarian et al. evaluated the levels of industrial trans fats and saturated fatty acids in major brand-name U.S. supermarket and restaurant foods after reformulation to reduce industrial trans fatty acid content, in two time: from 1993 through 2006 and from 2008 through 2009. They found a generally reduction in industrial trans fat content without any substantial or equivalent increase in saturated fatty acid content.
Foods sources
Many foods high in trans fats are popularly consumed worldwide.
In USA greater part of these fatty acids comes from partially hydrogenated vegetable oils, with an average consumption from this source that has been constant since the 1960′s.
It should be noted that the following trans fatty acid values must be interpreted with caution because, as previously said, many fast food establishments, restaurants and industries may have changed, or had to change the type of fat used for frying and cooking since the analysis were done.
The reported values, unless otherwise specified, refer to percentage in trans fatty acids/ 100 g of fatty acids.
Margarine
Among foods with trans fats, stick or hard margarine had the highest percentage of them, but levels of these fatty acids have declined as improved technology allowed the production of softer margarines which have become popular. But there are difference in trans fatty acid content of margarine from different countries. Below some examples.
The highest content, 13-16.5 percent, is found in soft margarine from Iceland, Norway, and the UK.
Less content is found in Italy, Germany, Finland, and Greece, 5.1 percent, 4.8 percent, 3.2 percent, and 2.9 percent respectively).
In Portugal, The Netherlands, Belgium, Denmark, France, Spain, and Sweden margarine trans fat content is less than 2 percent.
USA and Canada lag behind Europe, but in the USA, with the advent of trans fat labeling of foods and the greater knowledge of the risk associated with their consumption by the buyers, change is occurring. For this reason, at now, in the USA margarine is considered to be a minor contributor to the intake of TFA, whereas the major sources are commercially baked and fast food products like cake, cookies, wafer, snack crackers, chicken nuggets, French fries or microwave-oven popcorn (see below).
Vegetable shortenings
Trans fatty acid content of vegetable shortenings ranges from 6% to 50 percent, and varies in different country: in Germany, Austria and New Zealand it is less than France or USA.
However, like margarines, their trans fat content is decreasing. In Germany it decreased from 12% in 1994 to 6 percent in 1999, in Denmark is 7 percent (1996) while in New Zealand is about 6 percent (1997).
Vegetable oils
At now, non-hydrogenated vegetable oils for salad and cooking contain no or only small amounts of trans fats.
Processing of these oils can produce minimal level of them, ranged from 0.05g/100 food for extra virgin olive oil to 2.42 g/100 g food for canola oil. So, their contribution to trans fat content of the current food supply is very little.
One exception is represented by Pakistani hydrogenated vegetable oils whose TFA content ranges from 14% to 34%.
Prepared soups
Among foods with trans fats, prepared soups contain significant amount of them, ranging from 10 percent of beef bouillon to 35 percent of onion cream. So, they contribute great amount of such fatty acids to the diet if frequently consumed.
Processed foods
Thanks to their properties, trans fatty acids are used in many processed foods as cookies, cakes, croissants, pastries and other baked goods. And, baked goods are the greatest source of these fats in the North American diet. Of course, their trans fat content depends on the type of fat used in processing.
Sauces
Mayonnaise, salad dressings and other sauces contain only small or no-amounts of trans fats.
Human milk and infant foods
Trans fat content of human milk reflects the trans fat content of maternal diet in the previous day, is comprised between 1 and 7%, and is decreasing from 7.1 percent in 1998 to 4.6 percent in 2005/2006.
Infant formulas have trans fat values on average 0.1-4.5 percent, with a brand up to 15.7 percent.
Baby foods contain greater than 5 percent of trans fats.
Fast foods and restaurant’s foods
Vegetable shortenings high in trans fats are used as frying fats, so fast foods and many restaurant’s foods may contain relatively large amounts of them. Foods are fried pies, French fries, chicken nuggets, hamburgers, fried fish as well as fried chicken.
In articles published by Stender et al. from 2006 to 2009, it is showed that for French fries and chicken nuggets their content varies largely from nation to nation, but also within the same fast food chain in the same country, and even in the same city, because of the cooking oil used. For example, oil used in USA and Peru outlets of a famous fast food chain contained 23-24% of trans fats, whereas oil used in many European countries of the same fast food chain contained about 10 percent, with some countries, such as Denmark, as low as 5 percent and 1 percent.
And, considering a meal of French fries and chicken nuggets, in serving size of 171 and 160 g respectively, purchased at McDonald‘s in New York City, it contained over 10 g of TFA, while if purchased at KFC in Hungary they were almost 25 g.
Below, again from the work of Stender et al. it can see a cross-country comparison of trans fat contents of chicken nuggets and French fries purchased at McDonald ‘s or KFC.
Chicken nuggets and French fries from McDonald’s:
less than 1 g only if the meals were purchased in Denmark;
1-5 g in Portugal, the Netherlands, Russia, Czech Republic, or Spain;
5-10 g in the United States, Peru, UK, South Africa, Poland, Finland, France, Italy, Norway, Spain, Sweden, Germany, or Hungary.
Chicken and French fries from KFC:
less than 2 g if the meals were purchased UK (Aberdeen), Denmark, Russia, or Germany (Wiesbaden);
2-5 in Germany (Hamburg), France, UK (London or Glasgow), Spain, or Portugal;
5-10 in the Bahamas, South Africa, or USA;
10-25 g in Hungary, Poland, Peru, or Czech Republic.
References
Akoh C.C. and Min D.B. Food lipids: chemistry, nutrition, and biotechnology. 3rd Edition. CRC Press Taylor & Francis Group, 2008
Ascherio A., Katan M.B., Zock P.L., Stampfer M.J., Willett W.C. Trans fatty acids and coronary heart disease. N Engl J Med 1999;340:1994-1998. doi:10.1056/NEJM199906243402511
Ascherio A., Rimm E.B., Giovannucci E.L., Spiegelman D., Stampfer M., Willett W.C. Dietary fat and risk of coronary heart disease in men: cohort follow up study in the United States. BMJ 1996; 313:84-90. doi:10.1080/17482970601069094
Asp N-G. Fatty acids in focus – the good and the bad ones. Scand J Food Nutr 2006;50:155-160. doi:10.1080/17482970601069094
Baylin A., Kabagambe E.K., Ascherio A., Spiegelman D., Campos H. High 18:2 trans-fatty acids in adipose tissue are associated with increased risk of nonfatal acute myocardial infarction in Costa Rican adults. J Nutr 2003;133:1186-1191. doi:10.1093/jn/133.4.1186
Chow C.K. Fatty acids in foods and their health implication. 3rd Edition. CRC Press Taylor & Francis Group, 2008.
Clifton P.M., Keogh J.B., Noakes M. Trans fatty acids in adipose tissue and the food supply are associated with myocardial infarction. J Nutr 2004;134:874-879. doi:10.1093/jn/134.4.874
Costa N., Cruz R., Graça P., Breda J., and Casal S. Trans fatty acids in the Portuguese food market. Food Control 2016;64:128-134. doi:10.1016/j.foodcont.2015.12.010
Eckel R.H., Borra S., Lichtenstein A.H., Yin-Piazza D.Y. Understanding the Complexity of Trans fatty acid reduction in the American diet. American Heart Association trans fat conference 2006 report of the trans fat conference planning group. Circulation 2007;115:2231-2246. doi:10.1161/CIRCULATIONAHA.106.181947
Hu F.B., Manson J.E., Stampfer M.J., Colditz G., Liu S., Solomon C.G., and Willett W.C. Diet, lifestyle, and the risk of type 2 diabetes mellitus in women. N Engl J Med 2001;345:790-797. doi:10.1056/NEJMoa010492
Hu F.B., Willett W.C. Optimal diet for prevention of coronary heart disease JAMA 2002;288:2569-2578. doi:10.1001/jama.288.20.2569
Lemaitre R.N., King I.B., Raghunathan T.E., Pearce R.M., Weinmann S., Knopp R.H., Copass M.K., Cobb L.A., Siscovick D.S. Cell membrane trans-fatty acids and the risk of primary cardiac arrest. Circulation 2002;105:697-701. doi:10.1161/hc0602.103583
Lemaitre R.N, King I.B, Mozaffarian D., Sootodehnia N., Siscovick D.S. Trans-fatty acids and sudden cardiac death. Atheroscler Suppl 2006; 7(2):13-5. doi:10.1016/j.atherosclerosissup.2006.04.003
Lichtenstein A.H. Dietary fat, carbohydrate, and protein: effects on plasma lipoprotein patterns J. Lipid Res. 2006;47:1661-1667. doi:10.1194/jlr.R600019-JLR200
Lichtenstein A.H., Ausman L., Jalbert S.M., Schaefer E.J. Effect of different forms of dietary hydrogenated fats on serum lipoprotein cholesterol levels. N Engl J Med 1999;340:1933-1940. doi:10.1056/NEJM199906243402501
Lopez-Garcia E., Schulze M.B., Meigs J.B., Manson J.E, Rifai N., Stampfer M.J., Willett W.C. and Hu F.B. Consumption of trans fatty acids is related to plasma biomarkers of inflammation and endothelial dysfunction. J Nutr 2005;135:562-566. doi:10.1093/jn/135.3.562
Masanori S. Trans Fatty Acids: Properties, Benefits and Risks J Health Sci 2002;48(1):7-13.
Mensink R.P., Katan M.B. Effect of dietary trans fatty acids on high-density and low-density lipoprotein cholesterol levels in healthy subjects. N Engl J Med 1990;323:439-445. doi:10.1056/NEJM199008163230703
Mozaffarian D. Commentary: Ruminant trans fatty acids and coronary heart disease-cause for concern? Int J Epidemiol 2008;37(1):182-184. doi:10.1093/ije/dym263
Mozaffarian D., Jacobson M.F., Greenstein J.S. Food Reformulations to reduce trans fatty acids. N Eng J Med 2010;362:2037-2039. doi:https://doi.org/10.1056/NEJMc1001841
Mozaffarian D., Katan M.B., Ascherio A., Stampfer M.J., Willett W.C. Trans fatty acids and cardiovascular disease. N Engl J Med 2006;354:1601-1613. doi:10.1056/NEJMra054035
Mozaffarian D., Pischon T., Hankinson S.E., Joshipura K., Willett W.C., and Rimm E.B. Dietary intake of trans fatty acids and systemic inflammation in women. Am J Clin Nutr 2004;79:606-612. doi:https://doi.org/10.1093/ajcn/79.4.606
Oh K., Hu F.B., Manson J.E., Stampfer M.J., Willett W.C. Dietary fat intake and risk of coronary heart disease in women: 20 years of follow-up of the Nurses’ Health Study. Am J Epidemiol 2005;161(7):672-679. doi:10.1093/aje/kwi085
Okie S. New York to Trans Fats: You’re Out! N Engl J Med 2007;356:2017-2021. doi:10.1056/NEJMp078058
Oomen C.M., Ocke M.C., Feskens E.J., van Erp-Baart M.A., Kok F.J., Kromhout D. Association between trans fatty acid intake and 10-year risk of coronary heart disease in the Zutphen Elderly Study: a prospective population-based study. Lancet 2001; 357(9258):746-751. doi:10.1016/S0140-6736(00)04166-0
Pietinen P., Ascherio A., Korhonen P., Hartman A.M., Willett W.C., Albanes D., VirtamO J.. Intake of fatty acids and risk of coronary heart disease in a cohort of Finnish men: the Alpha-Tocopherol, Beta-Carotene Cancer Prevention Study. Am J Epidemiol 1997;145(10):876-887. doi:10.1093/oxfordjournals.aje.a009047
Risérus U. Trans fatty acids, insulin sensitivity and type 2 diabetes. Scand J Food Nutr 2006;50(4):161-165. doi:10.1080/17482970601133114
Salmerón J., Hu F.B., Manson J.E., Stampfer M.J., Colditz G.A., Rimm E.B., and Willett W.C. Dietary fat intake and risk of type 2 diabetes in women. Am J Clin Nutr 2001;73:1019-1026 doi:10.1093/ajcn/73.6.1019
Stender S., Astrup A., and Dyerberg J. A trans European Union difference in the decline in trans fatty acids in popular foods: a market basket investigation. BMJ Open 2012;2(5):e000859. doi:10.1136/bmjopen-2012-000859
Stender S., Astrup A., and Dyerberg J. Artificial trans fat in popular foods in 2012 and in 2014: a market basket investigation in six European countries. BMJ Open 2016;6(3):e010673. doi:10.1136/bmjopen-2015-010673
Stender S., Astrup A.,and Dyerberg J. Tracing artificial trans fat in popular foods in Europe: a market basket investigation. BMJ Open 2014;4(5):e005218. doi:10.1136/bmjopen-2014-005218
Stender S., Astrup A., Dyerberg J. What went in when trans went out?. N Engl J Med 2009;361:314-316. doi:10.1056/NEJMc0903380
Stender S., Dyerberg J. The influence of trans fatty acids on health. Fourth edition. The Danish Nutrition Council; publ. no. 34, 2003.
Stender S., Dyerberg J., Astrup A. Consumer protection through a legislative ban on industrially produced trans fatty acids in Denmark. Scand J Food Nutr 2006;50(4):155-160. doi:10.1080/17482970601069458
Stender S., Dyerberg J., Astrup A. High levels of trans fat in popular fast foods. N Engl J Med 2006;354:1650-1652. doi:10.1056/NEJMc052959
Willett W., Mozaffarian D. Ruminant or industrial sources of trans fatty acids: public health issue or food label skirmish? Am J Clin Nutr 2008;87(3): 515-516. doi:10.1093/ajcn/87.3.515
Black tea, like the other types of tea, is an infusion of dried and processed leaves of Camellia sinensis, a shrub belonging to the Theaceae family.
Unlike what happens during green tea production, during black tea production the almost complete oxidation of the substances contained in the leaves occurs, particularly catechins, polyphenols of the flavonoid group.
The color of the processed leaves is dark, whereas the beverage is brown-red in color.
Black tea is prepared with one tea bag per person, or one teaspoon per person in case of loose tea leaves, with an infusion time of 3-4 minutes in water at 95-100 °C.
Tea is a beverage with ancient origins, dating back to almost 4,000 years ago. It is one of the most-consumed beverages, particularly in Asia, where the favorite tea is green tea, especially in Japan and China, whereas black tea is preferred by Western populations and at global level, accounting for about 78% of the tea consumed.
The oxidation of the compounds present in the leaves during processing reduces the potential beneficial effects ascribed to the polyphenols initially present.
All the types of teas are produced from fresh leaves of Camellia sinensis. During harvesting, young leaves are preferred, as the older ones are considered inferior in quality.
The processing that leads to the production of loose dried tea leaves ready for brewing black tea proceeds through four steps: withering, rolling, oxidation, and drying. Such processing leads to the near complete oxidation of the substances present, particularly catechins.
Withering is the process by which the water present in the leaves, about 75% of the leaf’s weight, is removed, thus causing sap concentration. Withering, which makes the next step easier, can be achieved in three different ways:
by exposing leaves to sunlight;
by appropriately heating the rooms where the leaves are stored;
by machineries that ventilate the leaves.
The rolling step follows the withering of the leaves, and, breaking the leaf tissues, facilitates the outflow of lymph thus promoting the subsequent oxidation of polyphenols.
The oxidation step is also improperly called fermentation. In this step, the oxidation by atmospheric oxygen and polyphenol oxidase (EC 1.10.3.1) of 90-95% of the polyphenols occurs, accompanied by other changes that color the leaves with a red color. Temperature, typically 25°C, pH, relative humidity, 95% or more, ventilation, and duration are crucial factors, too. This step is crucial in determining the quality of the tea, as it gives it its organoleptic characteristics and composition in polyphenols, quite different from those of green tea, which is produced in such a way as to minimize oxidation processes.
Note that caffeine content does not vary significantly.
Drying is the last step. It is carried out at a temperature of 80-90 °C for about 20-25 minutes. The high temperature inactivates polyphenol oxidase, and then stops enzymatic oxidation processes.
Thearubigins and theaflavins
The oxidative processes that occur during black tea production affect monomeric and gallate catechins, to a lesser extent catechins glycosides, especially myricetin, and non-flavonoid compounds, such as teagallin, and leads to the formation of complex polyphenols such as thearubigins, theaflavins and theaflavic acids.
Thearubigins, brownish in color, are polymers of catechins not yet well characterized and the major polyphenols in black tea, accounting for about 20% of the dry leaf weight. They contribute to the richness in taste and color.
Theaflavins, red-orange in color, are dimers of catechins and account for about 3-5% of the dry leaf weight. They contribute to the astringent and brisk taste, as well as the red-orange in color.
The main theaflavins are:
theaflavin 3-gallate;
theaflavin 3′-gallate;
theaflavin 3,3’-digallate, the most abundant.
Theaflavins
Health benefits
The health benefits of black tea are largely due to its complex polyphenols, thearubigins and theaflavins, being catechins largely oxidized during leaf processing.
Here are three examples.
Theaflavins have been highlighted as having antiviral activity which, similarly to catechins, appears to be particularly effective against positive single-stranded RNA viruses. These viruses also include SARS-CoV-1 and SARS-CoV-2, viruses belonging to the Coronaviridae family.
Like catechins, the galloyl groups appear to be important for the antiviral activity of theaflavins.
The phytochemicals present in black tea, like those in green tea, seem to be able to reduce the glycemic index of starchy foods. The effect appears to be due to the inhibition of the activity of pancreatic alpha-amylase and other digestive enzymes, and to the direct interaction with starch, that would reduce the surface available to enzyme activity. The inhibition is greater on gluten free foods; this seems to be due to the action of gluten on complex polyphenols that would not be able to interact with the polysaccharide. For more information, see the article on tea polyphenols.
Thearubigins and theaflavins seem to have anticariogenic effects due to the inhibitory action on salivary and bacterial amylase, and seem to be more effective than green tea catechins.
Moreover, black tea seems to be able to inhibit acid production in the oral cavity.
References
Asil M.H., Rabiei B., Ansari R.H. Optimal fermentation time and temperature to improve biochemical composition and sensory characteristics of black tea. Aust J Crop Sci 2012;6(3):550-8.
Kan L., Capuano E., Fogliano V., Oliviero T. and Verkerk R. Tea polyphenols as a strategy to control starch digestion in bread: the effects of polyphenol type and gluten. Food Funct 2020;11:5933-5943. doi:10.1039/D0FO01145B
Kuhnert N. Unraveling the structure of the black tea thearubigins. Arch Biochem Biophys 2010;501(1):37-51. doi:10.1016/j.abb.2010.04.013
Li S., Lo C-Y., Pan M-H., Lai C-S. and Ho C-T. Black tea: chemical analysis and stability. Food Funct 2013;4:10-18. doi:10.1039/C2FO30093A
Mhatre S., Srivastava T., Naik S., Patravale V. Antiviral activity of green tea and black tea polyphenols in prophylaxis and treatment of COVID-19: a review. Phytomedicine 2020;153286. doi:10.1016/j.phymed.2020.153286
Menet M-C., Sang S., Yang C.S., Ho C-T., and Rosen R.T. Analysis of theaflavins and thearubigins from black tea extract by MALDI-TOF mass spectrometry. J Agric Food Chem 2004;52:2455-61. doi:10.1021/jf035427e
Sharma V.K., Bhattacharya A., Kumar A. and Sharma H.K. Health benefits of tea consumption. Trop J Pharm Res 2007;6(3):785-792.
Green tea, like the other types of tea, is an infusion of dried and processed leaves of Camellia sinensis, a member of the Theaceae family.
The processing of the leaves leading to the product ready for use is such as to minimize the oxidation of the compounds contained in them, particularly phytochemicals such as catechins, which are polyphenols belonging to the class of flavonoids and the most responsible for the health benefits of green tea.
Having undergone no significant chemical modifications, leaves retain green color, whereas the beverage, prepared with one tea bag per person, or in case of loose tea, one teaspoon per person, for an infusion time of about 3 minutes in water at 75 °C, is golden yellow in color.
Some organoleptic properties of green tea, such as the flavor, that is more delicate and lighter than that of black tea, and the health properties, which have always been recognized in East Asia cultures, depend on leaf processing.
Only recently scientists started studying the health benefits of tea consumption, highlighting its role in preventing many diseases, such as cardiovascular diseases and some types of cancer.
It has been shown that tea polyphenols, particularly catechins, are able to activate intracellular signaling pathways by binding to membrane receptors and/or entering the cell and binding to cytoplasmic, mitochondrial or nuclear receptors. Then, depending on the cell type, they activate or inhibit some cellular processes.
Given the high consumption of tea in the world, even small effects on health could have significant effects on public health.
Camellia sinensis is an evergreen plant native to South, East, and Southeast Asia, which is now cultivated in at least 30 countries, mostly in tropical or subtropical climates, although some varieties grow in Cornwall and Washington State.
In nature, Camellia sinensis can grow up to 15-20 meters (49-65 ft), whereas in plantations it is pruned to less than 1,5 meters to facilitate leaf harvesting.
It can grow up to altitude of 1,500-2,000 meters (4,900-6,550 ft), and many of the high-quality teas are produced from such crops, as the plant grows slowly and the leaves acquire a better flavor.
The most cultivated varieties, of the four known, are Camellia sinensis var. sinensis, native to China, and Camellia sinensis var. assamica, native to India.
The different types of tea are produced from fresh leaves. Young leaves are preferred over older leaves that are considered to be inferior in quality.
Fresh leaves are rich in water-soluble polyphenols, especially catechins and glycosylated catechins. The major catechins in green tea are epigallocatechin-3-gallate or EGCG, the most active, epigallocatechin, epicatechin 3-gallate, epicatechin. Catechin, gallocatechin, catechin gallate, and gallocatechin gallate are also present, although in lower amount.
Gallocatechin gallate
These polyphenols account for 30%-42% of the dry leaf weight. Caffeine accounts for 1,5-4,5% of the dry leaf weight.
In addition to leaf processing, the organoleptic properties of the beverage are influenced by cultivar, characteristics of the soil where the plant grown up, methods of cultivation, altitude, climate, and time of year in which leaf harvest occurs.
How green tea is made
The differences in leaf processing, which lead to the different types of tea ready for consumption, cause different degrees of oxidation of the compounds present in them, especially catechins.
During green tea manufacturing, oxidative processes, both enzymatic and chemical, are minimized. After harvesting, leaves are exposed to sunlight for 2-3 hours and withered/dried. Then, the processing proceeds through three steps:
heat treatment;
rolling;
drying.
Heat treatment, short and gentle, is crucial for the quality and properties of the beverage. It can done either with a steam, the traditional Japanese method, or by dry cooking in hot pans, that is similar to a roasting method and is the traditional Chinese method. Heat treatment inactivates enzymes and then prevents the enzymatic oxidation processes, particularly those involving polyphenols. It also removes the grassy smell, and evaporates, in the case of the traditional Chinese method, part of the water of the leaf, which constitutes about 75% of its weight, making it softer, thus facilitating the next step.
Heat treatment is followed by the rolling step, that facilitates the subsequent drying step and, destroying the leaf tissue, favors the release of aromas, thus improving the quality of the product.
The drying, the last step, improves the appearance of beverage and leads to the production of new compounds.
Health benefits
In East Asia cultures, mainly in China and Japan, tea drinking has always been associated with health benefits. Below is a brief review of the results of epidemiological and laboratory studies that have analyzed the effects that green tea consumption can play in preventing many diseases. EGCG, which is the most abundant catechin in green tea accounting for about 60% of the polyphenols present in dried leaves, seems to play the main role.
At the molecular level, the galloyl groups at positions 3 and/or 3′ appear to be essential for many of the effects exerted by catechins.
Cardiovascular disease
Cardiovascular disease is the main cause of deaths worldwide, particularly in low- and middle-income countries, with an estimate of about 17 million deaths in 2008 that could increase up to 23.3 million by 2030.
Daily tea consumption, especially green tea, seems to be associated with a reduced risk of developing cardiovascular disease, such as hypertension and stroke.
Among the proposed mechanisms, the improved bioactivity of the endothelium-derived vasodilator nitric oxide, due to the action of tea polyphenols that could enhance nitric oxide synthesis and/or decrease its breakdown by superoxide anions, seem to be important.
Cancer
Several epidemiological and laboratory studies have shown encouraging results with respect to the preventive role of tea consumption, especially green tea, against the development of some cancers such as those of the oral cavity, digestive tract, and lung among those who have never smoked.
Tea polyphenols seem to act not only as antioxidants, but also as compounds that, directly, can influence gene expression and various metabolic pathways.
Antiviral activity
Recent studies have highlighted antiviral effects of catechins, particularly EGCG of green tea and theaflavins of black tea, especially against positive single-stranded RNA viruses, to which the Coronaviridae family, and then SARS-CoV-1 and SARS-CoV-2, belongs.
The antiviral properties of EGCG appear to be due to its structural characteristics, namely, the presence of pyrogallic and galloyl groups.
Starch digestion
In vitro studies have shown that green tea and black tea polyphenols can reduce the glycemic index of starchy foods. Hence, they could be useful in controlling their glycemic index in vivo. This effect seems to be due to the inhibition of pancreatic alpha-amylase and other digestive enzymes, and to a direct interaction between starch and phytochemicals that would reduce the surface area of starch granules available for enzyme activity. Green tea appears to be equally effective against both gluten-containing foods, against which black tea appears less effective, and gluten free foods.
Weight loss
During weight loss and weight-loss maintenance it is important to keep as constant as possible the daily energy expenditure.
Since the 90s, it has been proposed that green tea, by virtue of its content of caffeine and catechins could be of help for:
maintaining, or even increasing, daily energy expenditure;
increasing fat oxidation.
In addition to these potential lipolytic and thermogenic effects, catechins and caffeine could act on other targets, such as lipid absorption and energy intake, perhaps through their effect on gut microbiota, which is part of the larger human microbiota, and gene expression.
And products for weight loss and weight maintenance based on green tea extracts have been marketed. It should be noted that these products contain catechins and caffeine in much higher amount than beverage.
How much truth is there in green tea’s fat burning effect?
The issue seems to have been resolved by a meta-analysis of 15 studies on weight loss and intake of these products. The study showed that green tea-based products induces, in overweight and obese adults, a weight loss that is:
not statistically significant;
very small;
probably not clinically important.
Hence, on the basis of scientific evidence, green tea does not seem to be helpful in fat loss nor in weight maintenance.
Anticariogenic activity
Animal and in vitro studies have shown that tea, and particularly its polyphenols, seem to possess:
antibacterial activity against cariogenic bacteria, such as Streptococcus mutans, as in the case of green tea EGCG;
inhibitory action on salivary and bacterial amylase, in which black tea thearubigins and theaflavins are more effective than green tea catechins;
inhibitory action on acid production in the oral cavity.
All these properties make green tea and black tea beverages with potential anticariogenic activity.
References
Arab L., Khan F., and Lam H. Tea consumption and cardiovascular disease risk. Am J Clin Nutr 2013;98:1651S-1659S. doi:10.3945/ajcn.113.059345
Clifford M.N., van der Hooft J.J.J., and Crozier A. Human studies on the absorption, distribution, metabolism, and excretion of tea polyphenols. Am J Clin Nutr 2013;98:1619S-1630S. doi:10.3945/ajcn.113.058958
Dwyer J.T. and Peterson J. Tea and flavonoids: where we are, where to go next. Am J Clin Nutr 2013;98:1611S-1618S. doi:10.3945/ajcn.113.059584
Goenka P., Sarawgi A., Karun V., Nigam A.G., Dutta S., Marwah N. Camellia sinensis (Tea): implications and role in preventing dental decay. Phcog Rev 2013;7:152-156. doi:10.4103/0973-7847.120515
Green R.J., Murphy A.S., Schulz B., Watkins B.A. and Ferruzzi M.G. Common tea formulations modulate in vitro digestive recovery of green tea catechins. Mol Nutr Food Res 2007;51(9):1152-1162. doi:10.1002/mnfr.200700086
Grassi D., Desideri G., Di Giosia P., De Feo M., Fellini E., Cheli P., Ferri L., and Ferri C. Tea, flavonoids, and cardiovascular health: endothelial protection. Am J Clin Nutr 2013;98:1660S-1666S. doi:10.3945/ajcn.113.058313
Huang W-Y., Lin Y-R., Ho R-F., Liu H-Y., and Lin Y-S. Effects of water solutions on extracting green tea leaves. Sci World J 2013;Article ID 368350. doi:10.1155/2013/368350
Hursel R. and Westerterp-Plantenga M.S. Catechin- and caffeine-rich teas for control of body weight in humans. Am J Clin Nutr 2013;98:1682S-1693S. doi:10.3945/ajcn.113.058396
Hursel R., Viechtbauer W. and Westerterp-Plantenga M.S. The effects of green tea on weight loss and weight maintenance: a meta-analysis. Int J Obesity 2009;33:956-961. doi:10.1038/ijo.2009.135
Jurgens T.M., Whelan A.M., Killian L., Doucette S., Kirk S., Foy E. Green tea for weight loss and weight maintenance in overweight or obese adults. Editorial group: Cochrane Metabolic and Endocrine Disorders Group. 2012:12 Art. No.: CD008650. doi:10.1002/14651858.CD008650.pub2
Lambert J.D. Does tea prevent cancer? Evidence from laboratory and human intervention studies. Am J Clin Nutr 2013;98:1667S-1675S. doi:10.3945/ajcn.113.059352
Lorenz M. Cellular targets for the beneficial actions of tea polyphenols. Am J Clin Nutr 2013;98:1642S-1650S. doi:10.3945/ajcn.113.058230
Mathur A., Gopalakrishnan D., Mehta V., Rizwan S.A., Shetiya S.H., Bagwe S. Efficacy of green tea-based mouthwashes on dental plaque and gingival inflammation: a systematic review and meta-analysis. Indian J Dent Res 2018;29(2):225-232. doi:10.4103/ijdr.IJDR_493_17
Mhatre S., Srivastava T., Naik S., Patravale V. Antiviral activity of green tea and black tea polyphenols in prophylaxis and treatment of COVID-19: a review. Phytomedicine 2020;153286. doi:10.1016/j.phymed.2020.153286
Sharma V.K., Bhattacharya A., Kumar A. and Sharma H.K. Health benefits of tea consumption. Trop J Pharm Res 2007;6(3):785-792.
Yang Y-C., Lu F-H., Wu J-S., Wu C-H., Chang C-J. The protective effect of habitual tea consumption on hypertension. Arch Intern Med 2004;164:1534-1540. doi:10.1001/archinte.164.14.1534
Yuan J-M. Cancer prevention by green tea: evidence from epidemiologic studies. Am J Clin Nutr 2013;98:1676S-1681S. doi:10.3945/ajcn.113.058271
Xu J., Xu Z., Zheng W. A review of the antiviral role of green tea catechins. Molecules 2017;22(8):1337. doi:10.3390/molecules22081337
Together with catechins and proanthocyanidins, anthocyanins and their oxidation products are the most abundant flavonoids in the human diet.
Examples of anthocyanin rich foods are:
certain varieties of grains, such as some types of pigmented rice (e.g. black rice) and maize (purple corn);
in certain varieties of root and leafy vegetables such as aubergine, red cabbage, red onions and radishes, beans;
but especially in red fruits.
Anthocyanins are also present in red wine; as the wine ages, they are transformed into various complex molecules.
Anthocyanin content in vegetables and fruits is generally proportional to their color: it increases during maturation, and it reaches values up to 4 g/kg fresh weight (FW) in cranberries and black currants.
These polyphenols are found primarily in the skin, except for some red fruits, such as cherries and red berries (e.g. strawberries), in which they are present both in the skin and flesh.
Glycosides of cyanidin are the most common anthocyanins in foods.
Berries are the main source of anthocyanins, with values ranging between 67 and 950 mg/100 g FW.
Other fruits, such as red grapes, cherries and plums, have content ranging between 2 and 150 mg/100 g FW.
Finally, in fruits such as nectarines, peaches, and some types of apples and pears, anthocyanins are poorly present, with a content of less than 10 mg/100 g FW.
Cranberries, besides their very high content of anthocyanins, are one of the rare food that contain glycosides of the six most commonly anthocyanidins present in foods: pelargonidin, delphinidin, cyanidin, petunidin, peonidin, and malvidin. The main anthocyanins are the 3-O-arabinosides and 3-O-galactosides of peonidin and cyanidin. A total of 13 anthocyanins have been detected, mainly 3-O-monoglycosides.
Anthocyanin absorption
Until recently, it was believed that anthocyanins, together with proanthocyanidins and gallic acid ester derivatives of catechins, were the least well-absorbed polyphenols, with a time of appearance in the plasma consistent with the absorption in the stomach and small intestine. Indeed, some studies have shown that their bioavailability has been underestimated since, probably, all of their metabolites have not been yet identified.
In this regard, it should be underlined that only a small part of the food anthocyanins is absorbed in their glycated forms or as hydrolysis products in which the sugar moiety has been removed. Therefore, a large amount of these ingested polyphenols enters the colon, where they can also suffer methylation, sulphatation, glucuronidation and oxidation reactions.
Anthocyanins and colonic microbiota
Few studies have examined the metabolism of anthocyanins by the gut microbiota in the colon, which is part of the larger human microbiota.
Within two hours, it seems that all the anthocyanins lose their sugar moieties, thus producing anthocyanidins.
Anthocyanidins are chemically unstable in the neutral pH of the colon. They can be metabolized by colonic microbiota or chemically degraded producing a set of new molecules that have not yet fully identified, but which include phenolic acids such as gallic acid, syringic acid, protocatechuic acid, vanillic acid and phloroglucinol (1,3,5-trihydroxybenzene). These molecules, thanks to their higher microbial and chemical stability, might be the main responsible for the antioxidant activities and the other physiological effects that have been observed in vivo and attributed to anthocyanins.
References
de la Rosa L.A., Alvarez-Parrilla E., Gonzàlez-Aguilar G.A. Fruit and vegetable phytochemicals: chemistry, nutritional value, and stability. 1th Edition. Wiley J. & Sons, Inc., Publication, 2010
de Pascual-Teresa S., Moreno D.A. and García-Viguera C. Flavanols and anthocyanins in cardiovascular health: a review of current evidence. Int J Mol Sci 2010;11:1679-1703. doi:10.3390/ijms11041679
Escribano-Bailòn M.T., Santos-Buelga C., Rivas-Gonzalo J.C. Anthocyanins in cereals. J Chromatogr A 2004:1054;129-141. doi:10.1016/j.chroma.2004.08.152
Han X., Shen T. and Lou H. Dietary polyphenols and their biological significance. Int J Mol Sci 2007;9:950-988. doi:10.3390/i8090950
Manach C., Scalbert A., Morand C., Rémésy C., and Jime´nez L. Polyphenols: food sources and bioavailability. Am J Clin Nutr 2004;79(5):727-747. doi:10.1093/ajcn/79.5.727
Tsao R. Chemistry and biochemistry of dietary polyphenols. Nutrients 2010;2:1231-1246. doi:10.3390/nu2121231
The leaves of the tea plant, Camellia sinensis, are rich in compounds with many biological activities, ranging from preventing the development of chronic diseases to reducing the glycemic index of starchy foods.
More than 4000 different molecules have been found in the beverage, of which about one third of these are polyphenols, the most important phytochemicals in determining the nutritional values and health benefits of the tea. Tea polyphenols are mostly flavonoids. Examples are catechins in green tea, among which epigallocatechin-3-gallate or EGCG is the most important and abundant, and thearubigins and theaflavins in black tea. Their galloyl groups at positions 3 and/or 3′ appear to be particularly important for their effects.
Epigallocatechin Gallate
Other bioactive compounds present in tea leaves are:
alkaloids, such as caffeine, theophylline and theobromine;
amino acids, and among them, theanine or R-glutamylethylamide, that is also a brain neurotransmitter and one of the most important amino acids in green tea;
Polyphenols, both in vivo and in vitro, have a broad spectrum of biological activities, such as:
antioxidant and prooxidant properties;
a protective role against the development of diabetes, hyperlipidemia, and various types of tumors;
inhibition of inflammation;
antiviral activities;
anticariogenic activity.
Hence, there has been a growing interest in recent years toward the possible preventive effects of tea against many diseases, particularly cardiovascular disease, for example in the development and progression of atherosclerosis.
Mechanisms of action
Currently, knowledge is accumulating on the effects of tea polyphenols at cellular and molecular level.
It seems, at least in vitro, that catechins, and theaflavins and thearubigins are the compounds responsible for the physiological effects and health benefits of green tea and black tea, respectively.
Among the molecular mechanisms by which tea polyphenols seem to exert their effects, it has been observed, after binding to specific cell membrane receptors, a change in the activity of various protein kinases that then phosphorylate target proteins, such as transcription factors, that, in turn, translocate into the nucleus and modify the gene expression. This appears to be the mechanism of action of EGCG, and the mechanism proposed for thearubigins, polymeric polyphenols that, due to their large dimensions, may not be able to cross the plasma membrane.
In addition, some polyphenols could be able to cross the plasma membrane, then binding to specific cytoplasmic, mitochondrial or nuclear targets.
And, depending on the cell type and their amount, tea polyphenols can activate or inhibit certain cellular processes.
Starch digestion
Tea polyphenols exert an inhibitory effect on starch digestion. In vitro studies have shown that green tea extracts, which contain monomeric polyphenols, have an equal inhibitory effect on starch digestibility of wheat bread and gluten free bread, whereas black tea extracts, rich in tannins, namely, polymeric polyphenols, are less effective against wheat bread. Therefore, it seems that the inhibitory effect of tannins is negatively influenced by gluten, whereas gluten has a lower inhibitory effect on monomeric polyphenols.
The inhibitory effect of these phytochemicals has been attributed to various molecular mechanisms briefly described below.
A competitive inhibition on pancreatic alpha-amylase. The galloyl groups are thought to be important for this effect.
The inhibition of other digestive enzymes present in the gastrointestinal tract.
The direct interaction with starch. Tea polyphenols can interact with starch granules through hydrogen bonds and hydrophobic forces, thus reducing the available surface to react with digestive enzymes.
Conversely, gluten could reduce the amount of polyphenols able to interact with starch and therefore able to inhibit its digestion.
Tea polyphenols could represent a means for controlling the glycemic index of starchy foods. However, it should be emphasized that, for example in the case of bread, to achieve an inhibitory effect, 100 g of bread must be co-digested with 2.5 cups of green tea or 2 cups of black tea.
References
Arab L., Khan F., and Lam H. Tea consumption and cardiovascular disease risk. Am J Clin Nutr 2013;98:1651S-1659S. doi:10.3945/ajcn.113.059345
Dwyer J.T. and Peterson J. Tea and flavonoids: where we are, where to go next. Am J Clin Nutr 2013;98:1611S-1618S. doi:10.3945/ajcn.113.059584
Grassi D., Desideri G., Di Giosia P., De Feo M., Fellini E., Cheli P., Ferri L., and Ferri C. Tea, flavonoids, and cardiovascular health: endothelial protection. Am J Clin Nutr 2013;98:1660S-1666S. doi:10.3945/ajcn.113.058313
Kan L., Capuano E., Fogliano V., Oliviero T. and Verkerk R. Tea polyphenols as a strategy to control starch digestion in bread: the effects of polyphenol type and gluten. Food Funct 2020;11:5933-5943. doi: 10.1039/D0FO01145B
Lambert J.D. Does tea prevent cancer? Evidence from laboratory and human intervention studies. Am J Clin Nutr 2013;98:1667S-1675S. doi:10.3945/ajcn.113.059352
Lenore Arab L., Khan F., and Lam H. Tea consumption and cardiovascular disease risk. Am J Clin Nutr 2013;98:1651S-1659S. doi:10.3945/ajcn.113.059345
Lorenz M. Cellular targets for the beneficial actions of tea polyphenols. Am J Clin Nutr 2013;98:1642S-1650S. doi:10.3945/ajcn.113.058230
Mathur A., Gopalakrishnan D., Mehta V., Rizwan S.A., Shetiya S.H., Bagwe S. Efficacy of green tea-based mouthwashes on dental plaque and gingival inflammation: a systematic review and meta-analysis. Indian J Dent Res 2018;29(2):225-232. doi:10.4103/ijdr.IJDR_493_17
Mhatre S., Srivastava T., Naik S., Patravale V. Antiviral activity of green tea and black tea polyphenols in prophylaxis and treatment of COVID-19: a review. Phytomedicine 2020;153286. doi:10.1016/j.phymed.2020.153286
Sharma V.K., Bhattacharya A., Kumar A. and Sharma H.K. Health benefits of tea consumption. Trop J Pharm Res 2007;6(3):785-792.
Yuan J-M. Cancer prevention by green tea: evidence from epidemiologic studies. Am J Clin Nutr 2013;98:1676S-1681S. doi:10.3945/ajcn.113.058271
Xu J., Xu Z., Zheng W. A review of the antiviral role of green tea catechins. Molecules 2017;22(8):1337. doi:10.3390/molecules22081337
Isoflavones are colorless polyphenols belonging to the flavonoid family.
Unlike the majority of the other flavonoids, they have a restricted taxonomic distribution, being present almost exclusively in the Leguminosae or Fabaceae plant family, mainly in soy.
Since legumes, soy in primis, are a major part of the diet in many cultures, these flavonoids may have a great impact on human health.
They are also present in beans and broad beans, but in much lower concentrations than those found in soy and soy products.
Also red clover or meadow clover (Trifolium pratense), another member of Leguminosae family, is a good source.
Currently, they are not found in fruits and vegetables.
Together with phenolic acids, such as caffeic acid and gallic acid, and quercetin glycosides, they are the most well-absorbed polyphenols, followed by flavanones and catechins (but not gallocatechins).
In plants, some isoflavones have antimicrobial activity and are synthesized in response to attacks by bacteria or fungi; thus they act as phytoalexins.
While most flavonoids have B ring attached to position 2 of C ring, isoflavones have B ring attached to position 3 of C ring.
Basic Skeleton of Isoflavones
Even if they are not steroids, they have structural similarities to estrogens, particularly estradiol. This confers them pseudohormonal properties, such as the ability to bind estrogen receptors; therefore, they are classified as phytoestrogens or plant estrogens. The benefits often ascribed to soy and soy products (e.g. tofu) are believed to result from the ability of isoflavones to act as estrogen mimics .
It should be underlined that the binding to estrogen receptors seems to lose strength with time, therefore their potential efficacy should not be overestimated.
In foods, they are present in four forms:
aglycone;
7-O-glucoside;
6′-O-acetyl-7-O-glucoside;
6′-O-malonyl-7-O-glucoside.
Soy isoflavones: genistein, daidzein and glycitein
Soy and soy products, such as soy milk, tofu, tempeh and miso, are the main source of isoflavones in the human diet.
The isoflavone content of soy and soy products varies greatly as a function of growing conditions, geographic zone, and processing; for example, in soy it ranges between 580 and 3800mg/kg fresh weight, while in soy milk it range between 30 and 175 mg/L. The most abundant isoflavones in soy and soy products are genistein, daidzein and glycitein, generally present in a concentration ratio of 1:1:0,2.; biochanin A and formononetin are other isoflavones present in less concentrations.
Isoflavones
The 6′-O-malonyl derivatives have a bitter, unpleasant, and astringent taste; therefore they give a bad flavor to the food in which they are contained. However, being sensitive to temperature, they are often hydrolyzed to glycosides during processing, such as the production of soy milk.
The fermentation processes needed for the preparation of certain foods, such as tempeh and miso, determines in turn the hydrolysis of glycosides to aglycones, i.e. the sugar-free molecule.
Isoflavone glycosides present in soy and soy products can also be deglycosylated by β-glucosidases in the small intestine.
The aglycones are very resistant to heat.
Although many compounds present in the diet are converted by intestinal bacteria to less active molecules, other compounds are converted to molecules with increased biological activity. This is the case of isoflavones, but also of prenylflavonoids from hops (Humulus lupulus), and lignans, that are other phytoestrogens.
Phytoestrogens and menopause
Vasomotor symptoms, such as night sweats and hot flashes, and bone loss are very common in perimenopause, also called menopausal transition, and menopause. Hormone replacement therapy (HRT) has proved to be a highly effective treatment for the prevention of menopausal bone loss and vasomotor symptoms.
The use of alternative therapies based on phytoestrogens is increased as a result of the publication of the “Women’s Health Initiative” study, that suggests that hormone replacement therapy could lead to more risks than benefits, in particular an increased risk of developing some chronic diseases.
Soy isoflavones are among the most used phytoestrogens by menopausal women, often taken in the form of isoflavone fortified foods or isoflavone supplements.
However, many studies have highlighted the lack of efficacy of soy isoflavones, and red clover isoflavones, even in large doses, in the prevention of vasomotor symptoms (hot flushes and night sweats) and bone loss during menopause.
References
de la Rosa L.A., Alvarez-Parrilla E., Gonzàlez-Aguilar G.A. Fruit and vegetable phytochemicals: chemistry, nutritional value, and stability. 1th Edition. Wiley J. & Sons, Inc., Publication, 2010
Han X., Shen T. and Lou H. Dietary polyphenols and their biological significance. Int J Mol Sci 2007;9:950-988. doi:10.3390/i8090950
Lagari V.S., Levis S. Phytoestrogens for menopausal bone loss and climacteric symptoms. J Steroid Biochem Mol Biol 2014;139:294-301 doi:10.1016/j.jsbmb.2012.12.002
Lethaby A., Marjoribanks J., Kronenberg F., Roberts H., Eden J., Brown J. Phytoestrogens for menopausal vasomotor symptom. Cochrane Database of Systematic Reviews 2013, Issue 12. Art. No.: CD001395. doi:10.1002/14651858.CD001395.pub4
Levis S., Strickman-Stein N., Ganjei-Azar P., Xu P., Doerge D.R., Krischer J. Soy isoflavones in the prevention of menopausal bone loss and menopausal symptoms: a randomized, double-blind trial. Arch Intern Med 2011:8;171(15):1363-1369 doi:10.1001/archinternmed.2011.330
Manach C., Scalbert A., Morand C., Rémésy C., and Jime´nez L. Polyphenols: food sources and bioavailability. Am J Clin Nutr 2004;79(5):727-747. doi:10.1093/ajcn/79.5.727
Tsao R. Chemistry and biochemistry of dietary polyphenols. Nutrients 2010;2:1231-1246. doi:10.3390/nu2121231
The interest on proanthocyanidins, and their content in foods, has increased as a result of the discovery, due to clinical and laboratory studies, of their anti-infectious, anti-inflammatory, cardioprotective and anticarcinogenic properties. These protective effects have been attributed to their ability to:
constituent catechin units and bonds between units.
In some foods, such as black beans and cashew nuts, only dimers are present, called A-type procyanidins and B-type procyanidins, whereas in most of the foods proanthocyanidins are found in a wide range of polymerizations, from 2 to 10 units or more.
Foods with the highest proanthocyanidin content are cinnamon and sorghum, which contain respectively about 8,000 and up to 4,000 mg/100 g of fresh weight (FW); grape seeds (Vitis vinifera) are another rich source, with a content of about 3,500 mg/100 g dry weight.
Other important sources are fruits and berries, some legumes (peas and beans), red wine and to a less extent beer, hazelnuts, pistachios, almonds, walnuts and cocoa.
The coffee is not a good source.
Proanthocyanidins are not detectable in the majority of vegetables; they have been found in small concentrations in Indian pumpkin. They are not detectable also in maize, rice and wheat, while there are present in barley.
Although many food plants contain high amounts of proanthocyanidins, only a few, such as plums, avocados, peanuts or cinnamon, contain A-type procyanidins, and none in amounts equal to cranberries (Vacciniun macrocarpon).
Note: A-type procyanidins exhibit, in vitro, a capacity of inhibition of P-fimbriated Escherichia coli adhesion to uroepithelial cells greater than B-type procyanidins (adhesion represents the initial step of urogenital infections).
B-type procyanidins in foods
B-type procyanidins, consisting of catechin and/or epicatechin as constituent units, are the exclusive proanthocyanidins in at least 20 kinds of foods including blueberries (Vaccinium myrtillus), blackberries, marion berries, choke berries, grape seeds, apples, peaches, pears, nectarines, kiwi, mango, dates, bananas, Indian pumpkin, sorghum, barley, black eye peas, beans blacks, walnuts and cashews.
Proanthocyanidins in fruits
In the Western diet, fruit is the most important source of proanthocyanidins.
The major sources are some berries (blueberries, cranberries, and black currant) and plums (prunes), with a content of about 200 mg/100 g FW.
Intermediate sources are apples, chokeberries, strawberries, and green and red grapes (60-90 mg/100 g FW).
In other fruits the content is less than 40 mg/100 g FW.
In fruit, the most common proanthocyanidins are tetramers, hexamers, and polymers.
Good sources of proanthocyanidins are also some fruit juices.
Proanthocyanidins in grape seeds
A particularly rich source of proanthocyanidins is the seeds of grape.
Proanthocyanidins in grape seeds are only B-type procyanidins, for the most part present in the form of dimers, trimers and highly polymerized oligomers.
Grape seed proanthocyanidins are potent antioxidants and free radical scavenger, being the more effective either than vitamin E and vitamin C (ascorbic acid).
In vivo and in vitro experiments support the idea that proanthocyanidins, and in particular those from grape seeds, can act as anti-carcinogenic agents; it seems that they are involved, in cancer cells, in:
reduction of cell proliferation;
increase of apoptosis;
cell cycle arrest;
modulation of the expression and activity of NF-kB and NF-kB target genes.
References
de la Rosa L.A., Alvarez-Parrilla E., Gonzàlez-Aguilar G.A. Fruit and vegetable phytochemicals: chemistry, nutritional value, and stability. 1th Edition. Wiley J. & Sons, Inc., Publication, 2010
Gu L., Kelm M.A., Hammerstone J.F., Beecher G., Holden J., Haytowitz D., Gebhardt S., and Prior R.L. Concentrations of proanthocyanidins in common foods and estimations of normal consumption. J Nutr 2004;134(3):613-617. doi:10.1093/jn/134.3.613
Han X., Shen T. and Lou H. Dietary polyphenols and their biological significance. Int J Mol Sci 2007;9:950-988. doi:10.3390/i8090950
Manach C., Scalbert A., Morand C., Rémésy C., and Jime´nez L. Polyphenols: food sources and bioavailability. Am J Clin Nutr 2004;79(5):727-747. doi:10.1093/ajcn/79.5.727
Nandakumar V., Singh T., and Katiyar S.K. Multi-targeted prevention and therapy of cancer by proanthocyanidins. Cancer Lett 2008;269(2):378-387. doi:10.1016/j.canlet.2008.03.049
Ottaviani J.I., Kwik-Uribe C., Keen C.L., and Schroeter H. Intake of dietary procyanidins does not contribute to the pool of circulating flavanols in humans. Am J Clin Nutr 2012;95:851-858. doi:10.3945/ajcn.111.028340
Tsao R. Chemistry and biochemistry of dietary polyphenols. Nutrients 2010;2:1231-1246. doi:10.3390/nu2121231
Wang Y.,Chung S., Song W.O., and Chun O.K. Estimation of daily proanthocyanidin intake and major food sources in the U.S. diet. J Nutr 2011;141(3):447-452. doi:10.3945/jn.110.133900
Flavonols are polyphenols belonging to the flavonoid family.
They are colorless molecules that accumulate mainly in the outer and aerial tissues, therefore skin and leaves, of fruit and vegetables, since their biosynthesis is stimulated by light, whereas they are virtually absent in the flesh.
Flavonols are the most common flavonoids in fruit and vegetables, where they are generally present in relatively low concentrations.
Due to their widespread in nature and human diet, they should be taken into consideration when the positive effect on health associated with fruit and vegetable consumption is examined. Their effect is probably related to their ability to:
act as antioxidants;
act as anti-inflammatory agents;
act as anticancer factors;
regulate different cellular signaling pathways; an example is the action of quercetin, the most widespread flavonols, on the oxidative stress-induced MAPK activities.
Chemically, these molecules differ from many other flavonoids since they have a double bond between positions 2 and 3 and an oxygen (a ketone group) in position 4 of the C ring, like flavones from which, however, they differ in the presence of a hydroxyl group at the position 3. Therefore, flavonol skeleton is a 3-hydroxyflavone.
3-Hydroxyflavone
The 3-hydroxyl group can link a sugar, that is, it can be glycosylated.
Like many other flavonoids, most of them is found in fruit and vegetables, and in plant-derived foods, in glycosylated form. The sugar associated with flavonols is often glucose or rhamnose, but other sugars may also be involved, such as:
Flavonols are mainly represented by glycosides of:
quercetin;
kaempferol;
myricetin;
isorhamnetin.
Flavonols
The most ubiquitous compounds are glycosylated derivatives of quercetin and kaempferol; in nature, these two molecules have respectively about 280 and 350 different glycosidic combinations.
Finally, it should be underlined that sugar moiety influences flavonol bioavailability.
Food sources
The major sources in human diet are:
fruit;
vegetables;
beverages such as red wine and tea.
In human diet, the richest source are capers, which contain up to 490 mg/100 g fresh weight (FW), but they are also abundant in onions, leeks, broccoli, curly kale, berries (e.g. blueberries), grapes and some herbs and spices, for example dill weed (Anethum graveolens). In these sources, their content ranges between 10 and 100 mg/100 g FW.
Even cocoa, green tea, black tea, and red wine are good sources of flavonols. In wine, together with other polyphenols such as catechins, proanthocyanidins and low molecular weight polyphenols, they contribute to the astringency of the beverage.
Main flavonols in foods
The main flavonols in foods, listed in decreasing order of abundance, are quercetin, kaempferol, myricetin and ishoramnetin.
Quercetin
The richest sources of quercetin are capers, followed by onions, asparagus, lettuce and berries; in many other fruit and vegetables, it is present in smaller amounts, between 0.1 and 5 mg/100 g FW.
This flavonol is also present in cocoa and it could be one of its main protective agents against LDL oxidation.
Together with isoflavones, quercetin glycosides are the most well-absorbed polyphenols, followed by flavanones and catechins (on the contrary, gallic acid derivatives of catechins are among the least well absorbed polyphenols, together with anthocyanins and proanthocyanidins).
Kaempferol
Typical dietary sources of kaempferol include vegetables, such as spinach, kale and endive, with concentrations between 0.1 and 27 mg/100 g FW, and some spices such as chives, fennel and tarragon, with concentrations between 6.5 and 19 mg/100 g FW.
Fruit is a poor source of the molecule, with content down to 0.1 mg/100 g FW.
Myricetin
Myricetin is the third most abundant flavonol. It is found in some spices, such as oregano, parsley, and fennel, with concentrations between 2 and 20 mg/100 g FW, but also in tea, 0.5-1.6 mg/100 ml, and red wine, 0-9.7 mg/100 ml.
In fruit, it is only found in high concentrations in berries, while in most other fruit and vegetables it is present in a content of less than 0.2 mg/100 g FW.
Isorhamnetin
A fourth flavonol, less abundant than the previous ones, is isorhamnetin. It is only present in some foods such as some spices: chives, 5.0-8.5 mg/100 g FW, fennel, 9.3 mg/100 g FW, tarragon, 5 mg/100 g FW.
In fruit and vegetables it is only present in almonds, with a concentration between 1.2 and 10.3 mg/100 g FW, pears and onions.
References
de la Rosa L.A., Alvarez-Parrilla E., Gonzàlez-Aguilar G.A. Fruit and vegetable phytochemicals: chemistry, nutritional value, and stability. 1th Edition. Wiley J. & Sons, Inc., Publication, 2010
Han X., Shen T. and Lou H. Dietary polyphenols and their biological significance. Int J Mol Sci 2007;9:950-988. doi:10.3390/i8090950
Manach C., Scalbert A., Morand C., Rémésy C., and Jime´nez L. Polyphenols: food sources and bioavailability. Am J Clin Nutr 2004;79(5):727-747. doi:10.1093/ajcn/79.5.727
Tsao R. Chemistry and biochemistry of dietary polyphenols. Nutrients 2010;2:1231-1246. doi:10.3390/nu2121231
Anthocyanins are a subgroup of flavonoids, therefore they are polyphenols, which give plants their distinctive colors.
They are water soluble pigments and are present in the vacuolar sap of the epidermal tissues of flowers and fruit.
They are responsible for the colors of the most of the petals, fruits and vegetables, and of some varieties of cereals such as black rice. In fact, they impart red, pink and purple to blue colors to berries, red apples, red grapes, cherries, and of many other fruits, red lettuce, red cabbage, onions or eggplant, but also red wine.
Together with carotenoids, they are responsible for autumn leaf color.
Finally, anthocyanins contribute to attract animals when a fruit is ready to eat or a flower is ready for pollination.
They are bioactive compounds found in plant foods that have a double interest for man:
the first one, a technological interest, due to their effects on the organoleptic characteristics of food products;
the other due to their healthy properties, being implicated in the protection against cardiovascular risk.
In fact:
in vitro, they have an antioxidant activity, due to their ability to delocalize electrons and form resonance structures, and a protective role against oxidation of low density lipoproteins (LDL);
like other polyphenols, such as catechins, proanthocyanidins and other uncolored flavonoids, they can regulate different signaling pathways involved in cell growth, differentiation and survival.
The basic chemical structure is flavylium cation (2-phenyl-1-benzopyrilium), which links hydroxyl (-OH) and/or methoxyl (-OCH3) groups, and one or more sugars.
The sugar-free molecule is called anthocyanidins.
Flavylium Cation
Depending on the number and position of hydroxyl and methoxyl groups, various anthocyanidins have been described, and of these, six are commonly found in vegetables and fruits:
pelargonidin
cyaniding
delphinidin
petunidin
peonidin
malvidin
Antocyanins
Anthocyanins, as most of the other flavonoids, are present in plants and plant foods in the form of glycosides, that is, linked to one or more sugar units.
The most common carbohydrates present in these natural pigments are:
The sugars are linked mainly to the C3 position as 3-monoglycosides, to the C3 and C5 positions as diglycosides, with the possible forms: 3-diglycosides, 3,5-diglycosides, and 3-diglycoside-5-monoglycosides. Glycosylations have been also found at C7, C3′ and C5′ positions.
The structure of these molecules is further complicated by the bond to the sugar unit of different acyl substituents such as:
aliphatic acids, such as acetic, malic, succinic and malonic acid;
cinnamic acids (aromatic substituents), such as sinapic, ferulic and p-coumaric acid;
finally, there are pigments with both aromatic and aliphatic substituents.
Furthermore, some anthocyanins have several acylated sugars in the molecule; these anthocyanins are sometimes called polyglycosides.
Depending on the type of hydroxylation, methoxylation and glycosylation patterns, and the different substituents linked to the sugar units, more than 500 different anthocyanins have been identified that are based on 31 anthocyanidins. Among these 31 monomers:
30 percent are from cyanidin;
22 percent are from delphinidin;
18 percent are from pelargonidin.
Methylated derivatives of cyanidin, delphinidin and pelargonidin, namely peonidin, malvidin, and petunidin, all together represent 20 percent of the anthocyanins.
Therefore, up to 90 percent of the most frequently encountered anthocyanins are related to delphinidin, pelargonidin, cyanidin, and their methylated derivatives.
Role of pH
The color of these molecules is influenced by the pH of the vacuole where they are stored, ranging in color from:
red, under very acidic conditions;
to purple-blue, in intermediate pH conditions;
until yellow-green, in alkaline conditions.
In addition to the pH, the color of these flavonoids can be affected by the degree of hydroxylation or methylation pattern of the A and B rings, and by glycosylation pattern.
Finally, the color of certain plant pigments result from complexes between anthocyanins, flavones and metal ions.
It should be noted that anthocyanins are often used as pH indicators thanks to the differences in chemical structure that occur in response to changes in pH.
References
de la Rosa L.A., Alvarez-Parrilla E., Gonzàlez-Aguilar G.A. Fruit and vegetable phytochemicals: chemistry, nutritional value, and stability. 1th Edition. Wiley J. & Sons, Inc., Publication, 2010
de Pascual-Teresa S., Moreno D.A. and García-Viguera C. Flavanols and anthocyanins in cardiovascular health: a review of current evidence. Int J Mol Sci 2010;11:1679-1703. doi:10.3390/ijms11041679
Escribano-Bailòn M.T., Santos-Buelga C., Rivas-Gonzalo J.C. Anthocyanins in cereals. J Chromatogr A 2004:1054;129-141. doi:10.1016/j.chroma.2004.08.152
Han X., Shen T. and Lou H. Dietary polyphenols and their biological significance. Int J Mol Sci 2007;9:950-988. doi:10.3390/i8090950
Manach C., Scalbert A., Morand C., Rémésy C., and Jime´nez L. Polyphenols: food sources and bioavailability. Am J Clin Nutr 2004;79(5):727-747. doi:10.1093/ajcn/79.5.727
Ottaviani J.I., Kwik-Uribe C., Keen C.L., and Schroeter H. Intake of dietary procyanidins does not contribute to the pool of circulating flavanols in humans. Am J Clin Nutr 2012;95:851-858. doi:10.3945/ajcn.111.028340
Tsao R. Chemistry and biochemistry of dietary polyphenols. Nutrients 2010;2:1231-1246. doi:10.3390/nu2121231
Proanthocyanidins or condensed tannins, also called pycnogenols and leukocyanidins, are polyphenolic compounds (in particular they are a flavonoid subgroup) widely distributed in the plant kingdom, second only to lignin as the most abundant phenol in nature.
They are present in high concentrations in various parts of the plants such as flowers, fruits, berries, seeds (e.g. in grape seeds), and bark (e.g. pine bark).
Together with anthocyanins and their oxidation products, and catechins, they are the most abundant flavonoids in human diet and it has been suggested that they constitute a significant fraction of the polyphenols ingested in the Western diet.
Therefore, condensed tannins should be taken into consideration when the epidemiological association between the intake of polyphenols, especially flavonoids, and chronic diseases are examined.
Condensed tannins have a complex chemical structure being oligomers (dimers to pentamers) or polymers (six or more units, up to 60) of catechins or flavanols, which are joined by carbon-carbon bonds.
(epi)afzelechin, and they are named propelargonidins;
(epi)gallocatechin, and they are named prodelphinidins.
Propelargonidins and prodelphinidins are less common in nature and in foods than procyanidins.
Depending on the bonds between monomers, proanthocyanidins have a:
B-type structure, if the polymerization occurs via carbon-carbon bond between the position 8 of the terminal unit and the 4 of the extender (or C4-C6);
A-type structure, less frequent, if monomers are doubly linked via an ether bond C2-O-C7 or C2-O-C5 plus a B-type bond.
Procyanidins
The most common dimers are B-type procyanidins, B1 to B8, formed by catechin or epicatechin; in B1, B2, B3 and B-4 dimers, the two flavanol units are joined by a C4-C8 bond; in B5, B6, B7 and B8 dimers the two units are joined by C4-C6 bond.
Procyanidins B1, B2, B3, and B4
Procyanidin C1 is a B-type trimer.
Procyanidin A-2 is an example of A-type procyanidin.
Intestinal absorption
Condensed tannins are poorly absorbed from the intestine; together with anthocyanins and gallic acid ester derivatives of tea catechins, they are the least well-absorbed polyphenols.
It seems that low molecular weight oligomers (2-3 monomers) may be absorbed as such while polymers are not.
In the systemic circulation, dimers reach concentrations of two orders of magnitude lower than those of catechins.
It seems that condensed tannins with a degree of polymerization greater than three transit into the stomach and small intestine without significant modifications, and then, into the large intestine, they are catabolized by gut microbiota, which is part of the human microbiota, with production of phenylpropionic, phenilvaleric and phenylacetic acids. These degradation products have been suggested to be the major metabolites of proanthocyanidins in healthy humans.
Procyanidins and catechins
It had been proposed that the catabolism of procyanidins in the gastrointestinal tract lead to the release of monomeric catechins, thus indirectly contributing to their systemic pool in humans. In recent years, it has been shown that this does not happen because procyanidins do not significantly contribute to:
the concentration of catechin metabolites in the systemic circulation;
the total catechin metabolites excreted in the urine;
finally, they do not significantly affect plasma metabolite profile derived from catechol-O-methyltransferase activity.
Therefore, analyzing the potential health benefits associated with the intake of foods containing these phytochemicals, catechins and procyanidins should be considered distinct classes of related compounds.
References
de la Rosa L.A., Alvarez-Parrilla E., Gonzàlez-Aguilar G.A. Fruit and vegetable phytochemicals: chemistry, nutritional value, and stability. 1th Edition. Wiley J. & Sons, Inc., Publication, 2010
Gu L., Kelm M.A., Hammerstone J.F., Beecher G., Holden J., Haytowitz D., Gebhardt S., and Prior R.L. Concentrations of proanthocyanidins in common foods and estimations of normal consumption. J Nutr 2004;134(3):613-617. doi:10.1093/jn/134.3.613
Han X., Shen T. and Lou H. Dietary polyphenols and their biological significance. Int J Mol Sci 2007;9:950-988. doi:10.3390/i8090950
Manach C., Scalbert A., Morand C., Rémésy C., and Jime´nez L. Polyphenols: food sources and bioavailability. Am J Clin Nutr 2004;79(5):727-747. doi:10.1093/ajcn/79.5.727
Nandakumar V., Singh T., and Katiyar S.K. Multi-targeted prevention and therapy of cancer by proanthocyanidins. Cancer Lett 2008;269(2):378-387. doi:10.1016/j.canlet.2008.03.049
Ottaviani J.I., Kwik-Uribe C., Keen C.L., and Schroeter H. Intake of dietary procyanidins does not contribute to the pool of circulating flavanols in humans. Am J Clin Nutr 2012;95:851-858. doi:10.3945/ajcn.111.028340
Tsao R. Chemistry and biochemistry of dietary polyphenols. Nutrients 2010;2:1231-1246. doi:10.3390/nu2121231
Wang Y.,Chung S., Song W.O., and Chun O.K. Estimation of daily proanthocyanidin intake and major food sources in the U.S. diet. J Nutr 2011;141(3):447-452. doi:10.3945/jn.110.133900
Catechins or flavanols, with flavonols such as quercetin, and flavones such as luteolin, are a subgroup of flavonoids among the most widespread in nature.
Flavanols and proanthocyanidins, together with anthocyanins and their oxidation products, are the most abundant flavonoids in human diet.
Chemically they differ from many other flavonoids as:
they lack the double bond between positions 2 and 3 of the C ring;
they not have a keto group at position 4;
they have a hydroxyl group in position 3, and for this reason they are also called flavan-3-ols.
Basic Skeleton of Catechins
Another distinctive feature of flavan-3-ols is their ability to form oligomers (two to ten units) or polymers (eleven or more units, up to 60 units) called proanthocyanidins or condensed tannins.
Food sources
Flavanols commonly found in plant-derived food products are catechin, epicatechin, gallocatechin, epigallocatechin, and their gallic acid ester derivatives: catechin gallate, gallocatechin gallate, epicatechin gallate, and epigallocatechin gallate or EGCG.
Catechins
Flavanols present with higher frequency are catechin and epicatechin, which are also among the most common known flavonoids, and almost as popular as the related flavonol quercetin.
Cocoa and green tea are by far the richest sources in flavanols. In these foods the main flavonoids are catechin and epicatechin (cocoa is also a good source of epigallocatechin), but also their gallic acid ester derivatives, the gallocatechins.
Gallic Acid Ester Derivatives of Catechins
However, they are also present in many fruits, especially in the skins of apples, blueberries (Vaccinium myrtillus) and grapes, in vegetables, red wine and beer, and peanuts.
As in many cases flavanols are present in the seeds or peels of fruits and vegetables, their intake may be limited by the fact that these parts are discarded during processing or while eaten.
Furthermore, in contrast to other flavonoids, catechins are not glycosylated in foods.
Proanthocyanidins, that is polymeric flavan-3-ols, are also commonly found in plant-derived food products. Their presence has been reported in the skin of peanuts and almonds, as in the berries.
Green and black tea
Green tea is an excellent source of flavonoids. The main flavonoids present in the leaves of the tea (as in cocoa beans) are catechin and epicatechin, monomeric flavanols, together with their gallate derivatives such as EGCG.
Epigallocatechin gallate is the most abundant catechin in green tea and it seems to have an important role in determining green tea benefits, as the reduction of:
vascular inflammation;
blood pressure;
concentration of oxidized LDL.
Black tea (fermented tea) contains fewer monomeric flavanols, as they are oxidized during fermentation of the leaves to more complex polyphenols such as theaflavins (theaflavin digallate, theaflavin-3-gallate, and theaflavin-3′-gallate, all dimers) and thearubigins (polymers).
Theaflavins and thearubigins are present only in the tea; their concentrations in brewed tea are between 50- and 100-folds lesser than in tea leaves.
It should be noted that tea epicatechins are remarkably stable to heat in acidic environment: at pH 5, only about 15% is degraded after seven hours in boiling water (therefore, adding lemon juice to brewed tea does not cause any reduction in their content).
Cocoa and cocoa products
Cocoa has the highest content of polyphenols and flavanols per serving, a concentration greater than those found in green tea and red wine. Most of the flavonoids present in cocoa beans and derived products, such as black chocolate, are catechin and epicatechin, monomeric flavanols, but also epigallocatechin, and their derivatives such as the gallocatechins; among polymers, proanthocyanidins are also important.
Fruits, vegetables, and legumes
Catechin and epicatechin are the main flavanols in fruits. They are found in many fruits in different concentrations, respectively, between 5-3 and 0.5-6 mg/100 g fresh weight.
On the contrary, gallocatechin, epicatechin gallate, epigallocatechin, and epigallocatechin gallate are present in various fruits such as red grapes, berries, apples, peaches and plums, but in very low concentrations, less than 1mg/100 g fresh weight.
Except for lentils and broad beans, few legumes and vegetables contain catechins, and in very low concentrations, less than 1.5 mg/100 g fresh weight.
References
de la Rosa L.A., Alvarez-Parrilla E., Gonzàlez-Aguilar G.A. Fruit and vegetable phytochemicals: chemistry, nutritional value, and stability. 1th Edition. Wiley J. & Sons, Inc., Publication, 2010
de Pascual-Teresa S., Moreno D.A. and García-Viguera C. Flavanols and anthocyanins in cardiovascular health: a review of current evidence. Int J Mol Sci 2010;11:1679-1703. doi:10.3390/ijms11041679
Han X., Shen T. and Lou H. Dietary polyphenols and their biological significance. Int J Mol Sci 2007;9:950-988. doi:10.3390/i8090950
Manach C., Scalbert A., Morand C., Rémésy C., and Jime´nez L. Polyphenols: food sources and bioavailability. Am J Clin Nutr 2004;79(5):727-747. doi:10.1093/ajcn/79.5.727
Tsao R. Chemistry and biochemistry of dietary polyphenols. Nutrients 2010;2:1231-1246. doi:10.3390/nu2121231
Flavonoids are the most abundant polyphenols in human diet, representing about 2/3 of all those ones ingested. Like other phytochemicals, they are the products of secondary metabolism of plants and, currently, it is not possible to determine precisely their number, even if over 4000 have been identified.
In fruits and vegetables, they are usually found in the form of glycosides and sometimes as acylglycosides, while acylated, methylated and sulfate molecules are less frequent and in lower concentrations.
They are water-soluble and accumulate in cell vacuoles.
Their basic structure is a skeleton of diphenylpropane, namely, two benzene rings linked by a three carbon chain that forms a closed pyran ring (heterocyclic ring containing oxygen, the C ring) with benzenic A ring. Therefore, their structure is also referred to as C6-C3-C6.
Basic Skeleton of Flavonoids
In most cases, B ring is attached to position 2 of C ring, but it can also bind in position 3 or 4; this, together with the structural features of the ring B and the patterns of glycosylation and hydroxylation of the three rings, makes the flavonoids one of the larger and more diversified groups of phytochemicals, so not only of polyphenols, in nature.
Their biological activities, for example they are potent antioxidants, depend both on the structural characteristics and the pattern of glycosylation.
Classification
They can be subdivided into different subclasses depending on the carbon of the C ring on which B ring is attached, and the degree of unsaturation and oxidation of the C ring.
Flavonoids in which B ring is linked in position 3 of the ring C are called isoflavones; those in which B ring is linked in position 4, neoflavonoids, while those in which the B ring is linked in position 2 can be further subdivided into several subgroups on the basis of the structural features of the C ring. These subgroup are: flavones, flavonols, flavanones, flavanonols, flavanols or catechins and anthocyanins.
Finally, flavonoids with open C ring are called chalcones.
Flavonoid Subclasses
Flavones
They have a double bond between positions 2 and 3 and a ketone in position 4 of the C ring. Most flavones of vegetables and fruits has a hydroxyl group in position 5 of the A ring, while the hydroxylation in other positions, for the most part in position 7 of the A ring or 3′ and 4′ of the B ring may vary according to the taxonomic classification of the particular vegetable or fruit.
Glycosylation occurs primarily on position 5 and 7, methylation and acylation on the hydroxyl groups of the B ring.
Some flavones, such as nobiletin and tangeretin, are polymethoxylated.
Flavonols
Compared to flavones, they have a hydroxyl group in position 3 of the C ring, which may also be glycosylated. Again, like flavones, flavonols are very diverse in methylation and hydroxylation patterns as well, and, considering the different glycosylation patterns, they are perhaps the most common and largest subgroup of flavonoids in fruits and vegetables. For example, quercetin is present in many plant foods.
Flavanones
Flavanones, also called dihydroflavones, have the C ring saturated; therefore, unlike flavones, the double bond between positions 2 and 3 is saturated and this is the only structural difference between the two subgroups of flavonoids.
The flavanones can be multi-hydroxylated, and several hydroxyl groups can be glycosylated and/or methylated.
Some have unique patterns of substitution, for example, furanoflavanones, prenylated flavanones, pyranoflavanones or benzylated flavanones, giving a great number of substituted derivatives.
Over the past 15 years, the number of flavanones discovered is significantly increased.
Flavanonols
Flavanonols, also called dihydroflavonols, are the 3-hydroxy derivatives of flavanones; they are an highly diversified and multisubstituted subgroup.
Isoflavones
As anticipated, isoflavones are a subgroup of flavonoids in which the B ring is attached to position 3 of the C ring. They have structural similarities to estrogens, such as estradiol, and for this reason they are also called phytoestrogens.
Catechins
Catechins are also referred to flavan-3-ols as the hydroxyl group is almost always bound to position 3 of C ring; they are called flavanols as well.
They have two chirality centers in the molecule, on positions 2 and 3, then four possible diastereoisomers. Epicatechin is the isomer with the cis configuration and catechin is the one with the trans configuration. Each of these configurations has two stereoisomers, namely, (+)-epicatechin and (-)-epicatechin, (+)-catechin and (-)-catechin.
(+)-Catechin and (-)-epicatechin are the two isomers most often present in edible plants.
Another important feature of flavanols, particularly of catechin and epicatechin, is the ability to form polymers, called proanthocyanidins or condensed tannins. The name “proanthocyanidins” is due to the fact that an acid-catalyzed cleavage produces anthocyanidins. Proanthocyanidins typically contain 2 to 60 monomers of flavanols.
Monomeric and oligomeric flavanols (containing 2 to 7 monomers) are strong antioxidants.
Anthocyanidins
Chemically, anthocyanidins are flavylium cations and are generally present as chloride salts.
They are the only group of flavonoids that gives plants colors (all other flavonoids are colorless).
Anthocyanins are glycosides of anthocyanidins. Sugar units are bound mostly to position 3 of the C ring and they are often conjugated with phenolic acids, such as ferulic acid.
The color of the anthocyanins depends on the pH and also by methylation or acylation at the hydroxyl groups on the A and B rings.
Chalcones
Chalcones and dihydrochalcones are flavonoids with open structure; they are classified as flavonoids because they have similar synthetic pathways.
References
de la Rosa L.A., Alvarez-Parrilla E., Gonzàlez-Aguilar G.A. Fruit and vegetable phytochemicals: chemistry, nutritional value, and stability. 1th Edition. Wiley J. & Sons, Inc., Publication, 2010
Han X., Shen T. and Lou H. Dietary polyphenols and their biological significance. Int J Mol Sci 2007;9:950-988. doi:10.3390/i8090950
Manach C., Scalbert A., Morand C., Rémésy C., and Jime´nez L. Polyphenols: food sources and bioavailability. Am J Clin Nutr 2004;79(5):727-747. doi:10.1093/ajcn/79.5.727
Panche A.N., Diwan A.D., and Chandra S.R. Flavonoids: an overview. J Nutr Sci. 2016;5:e47. doi:10.1017/jns.2016.41
Tsao R. Chemistry and biochemistry of dietary polyphenols. Nutrients 2010;2:1231-1246. doi:10.3390/nu2121231
Polyphenols are among the most important, and certainly the most numerous, phytochemicals present in the plant kingdom.
Currently, over 8,000 phenolic structures have been identified, of which more than 4,000 belonging to the class of flavonoids, and several hundred occur in edible plants.
However, it is thought that the total content of polyphenols in plants is underestimated as many of the phenolic compounds present in fruits, vegetables and derivatives have not yet been identified, escaping the methods and techniques of analysis used, and the composition in polyphenols for most fruits and some varieties of cereals is not yet known.
They are present in many edible plants, both for men and animals, and it is thought to be their presence, along with that of other molecules such as carotenoids, vitamin C or vitamin E, the responsible for the healthy effects of fruits and vegetables.
In the human diet, they are the most abundant natural antioxidants, and the main sources are fruits, vegetables, whole grains, but also other types of foods and beverages derived from them, such as red wine, rich in resveratrol, the extra virgin olive oil, rich in hydroxytyrosol, chocolate or tea, in particularly green tea, rich in epigallocatechin gallate or EGCG.
The term polyphenols refers to a wide variety of molecules that can be divided into many subclasses, subdivisions that can be made on the basis of their origin, biological function, or chemical structure.
Chemically, they are compounds with structural phenolic features, which can be associated with different organic acids and carbohydrates.
Ball-and-Stick Model of Phenol
In plants, the most part of them are linked to sugars, and therefore they are in the form of glycosides. Carbohydrates and organic acids can be bound in different positions on polyphenol skeletons.
Among polyphenols, there are simple molecules, such as phenolic acids, or complex structures such as proanthocyanidins, that are highly polymerized molecules.
Classification
They can be classified into different classes, according to the number of phenolic rings in their structure, the structural elements that bind these rings each others, and the substituents linked to the rings. Therefore, two main groups can then be identified: the flavonoid group and the non-flavonoid group.
Flavonoids share a structure formed by two aromatic rings, indicated as A and B, linked together by three carbon atoms forming an oxygenated heterocycle, the C ring; they can be further subdivided into six main subclasses, as a function of the type of heterocycle (the C ring) that is involved:
Variability of polyphenol content of plants and plant products
Although several classes of phenolic molecules, such as quercetin (a flavonol, see figure), are present in most plant foods (tea, wine, cereals, legumes, fruits, fruit juices, etc.), other classes are found only in a particular type of food (e.g. flavanones in citrus, isoflavones in soya, phloridzin in apples, etc.).
However, it is common that different types of polyphenols are in the same product; for example, apples contain flavanols, chlorogenic acid, hydroxycinnamic acids, glycosides of phloretin, glycosides of quercetin and anthocyanins.
The polyphenol composition may also be influenced by other parameters such as environmental factors, the degree of ripeness at harvest time, household or industrial processing, storage, and plant variety. From currently available data, it seems that the fruits with the highest content of polyphenols are strawberries, lychees and grapes, and the vegetables are artichokes, parsley and brussels sprouts. Melons and avocados have the lowest concentrations.
References
de la Rosa L.A., Alvarez-Parrilla E., Gonzàlez-Aguilar G.A. Fruit and vegetable phytochemicals: chemistry, nutritional value, and stability. 1th Edition. Wiley J. & Sons, Inc., Publication, 2010
Han X., Shen T. and Lou H. Dietary polyphenols and their biological significance. Int J Mol Sci 2007;9:950-988. doi:10.3390/i8090950
Manach C., Scalbert A., Morand C., Rémésy C., and Jime´nez L. Polyphenols: food sources and bioavailability. Am J Clin Nutr 2004;79(5):727-747. doi:10.1093/ajcn/79.5.727
Tsao R. Chemistry and biochemistry of dietary polyphenols. Nutrients 2010;2:1231-1246. doi:10.3390/nu2121231
Carbohydrate ingestion can improve endurance capacity and performance.
The ingestion of different types of carbohydrates, which use different intestinal transporters, can:
increase total carbohydrate absorption;
increase exogenous carbohydrate oxidation;
and therefore improve performance.
Glucose and fructose
When a mixture of glucose and fructose is ingested, in the analyzed literature, respectively 1.2 and 0.6 g/min, ratio 2:1, for total carbohydrate intake rate to 1.8 g/min, there is less competition for intestinal absorption compared with the ingestion of an iso-energetic amount of glucose or fructose, two different intestinal transporters being involved. Furthermore, fructose absorption is stimulated by the presence of glucose.
increase the availability of exogenous carbohydrates in the bloodstream;
cause the higher exogenous carbohydrate oxidation rates in fructose plus glucose combination compared to high glucose intake alone.
The combined ingestion of glucose and fructose allows to obtain exogenous carbohydrate oxidation rate around 1,26 g/min, therefore, higher than the rate reported with glucose alone (1g/min), also in high concentration.
The observed difference (+0,26 g/min) can be fully attributed to the oxidation of ingested fructose.
Sucrose and glucose
The ingestion of sucrose and glucose, in the same conditions of the ingestion of glucose and fructose (therefore, respectively 1.2 and 0.6 g/min, ratio 2:1, for total carbohydrate intake rate to 1.8 g/min), gives similar results.
Glucose, sucrose and fructose
Very high oxidation rates are found with a mixture of glucose, sucrose, and fructose, in the analyzed literature, respectively 1.2, 0.6 and 0.6 g/min, ratio 2:1:1, for total carbohydrate intake rate to 2.4 g/min; however, note the higher amounts of ingested carbohydrates.
Maltodextrin and fructose
High oxidation rates are also observed with combinations of maltodextrin and fructose, in the same conditions of the ingestion of glucose plus fructose, therefore, respectively 1.2 and 0.6 g/min, ratio 2:1, for total carbohydrate intake rate to 1.8 g/min.
Such high oxidation rates can be achieved with carbohydrates ingested in a beverage, in a gel or in a low-fat, low protein, low-fiber energy bar.
The best combination of carbohydrates ingested during exercise seems to be the mixture of maltodextrin and fructose in a 2:1 ratio, in a 5% solution, and in a dose around 80-90 g/h.
Oxidation of Ingested Carbohydrates
Why?
This mixture has the best ratio between amount of ingested carbohydrates and their oxidation rate and it means that smaller amounts of carbohydrates remain in the stomach or gut reducing the risk of gastrointestinal complication/discomfort during prolonged exercise (see brackets grafa in the figure).
A solution containing a combination of multiple transportable carbohydrates and a carbohydrate content not exceeding 5% optimizes gastric emptying rate and improves fluid delivery.
Example of a 5% carbohydrate solution containing around 80-90 g of maltodextrin and fructose in a 2:1 rate; ingestion time around 1 h.
1.5 L solution: 80 g of carbohydrates, including around 55 g of maltodextrin and around 25 of fructose.
1.8 L solution: 90 g of carbohydrates, including 60 g of maltodextrin and 30 of fructose.
Conclusion
During prolonged exercise, when high exogenous carbohydrate oxidation rates are needed, the ingestion of multiple transportable carbohydrates is preferred above that of large amounts of a single carbohydrate.
The best mixture seems to be maltodextrin and , in a 2:1 ratio, in a 5% concentration solution, and at ingestion rate of around 80-90 g/h.
References
Burke L.M., Hawley J.A., Wong S.H.S., & Jeukendrup A. Carbohydrates for training and competition. J Sport Sci 2011;29:Sup1,S17-S27. doi:10.1080/02640414.2011.585473
Jentjens R.L.P.G., Moseley L., Waring R.H., Harding L.K., and Jeukendrup A.E. Oxidation of combined ingestion of glucose and fructose during exercise. J Appl Physiol 2004:96;1277-1284. doi:10.1152/japplphysiol.00974.2003
Jentjens R.L.P.G., Venables M.C., and Jeukendrup A.E. Oxidation of exogenous glucose, sucrose, and maltose during prolonged cycling exercise. J Appl Physiol 2004:96;1285-1291. doi:10.1152/japplphysiol.01023.2003
Jeukendrup A.E. Carbohydrate feeding during exercise. Eur J Sport Sci 2008:2;77-86. doi:10.1080/17461390801918971
Jeukendrup A.E. Nutrition for endurance sports: marathon, triathlon, and road cycling. J Sport Sci 2011:29;sup1, S91-S99. doi:10.1080/02640414.2011.610348
Carotenoids are a class of fat-soluble pigments widely present in nature.
They are yellow, orange, and red organic compounds, made up of 8 isoprene units, and have many conjugated double bonds. Their hydrocarbon chain can undergo modifications which significantly influence the biological properties.
Discovered in the first half of the 1800s, carotenoids are synthesized by all photosynthetic organisms, including plants, macroalgae and microalgae, and by some non-photosynthetic organisms, such as some types of fungi, bacteria, and insects, such as pea aphids, some species of gall midges, and spider mites. In plants and microalgae they are synthesized and accumulated in plastids.
They form, with polyphenols and glucosinolates, the group of phytochemicals.
In the course of evolution, thanks to their chemical and physical properties, they have proved to be extremely versatile, as they can perform many functions in both plants and animals, among which the antioxidant activity is very important. Furthermore, in humans, some carotenoids serve as vitamin A precursor.
There are more than 750 different carotenoids, more than 100 have been found in fruits and vegetables, and about 40 are consumed in significant amounts by humans.
Thanks to their color, carotenoids are used as food additives.
Carotenoids were discovered in the first half of the nineteenth century.
The first carotenoid to be isolated was beta-carotene, in 1831, thanks to the work of the German pharmacist Heinrich Wilhelm Ferdinand Wackenroder, who called “carotene” the yellow pigment crystallized from the carrot root.
Jöns Jacob Berzelius, considered one of the fathers of modern chemistry, named the yellow pigments extracted from autumn leaves xanthophylls, from the Greek xanthos, which means yellow, and phyllon, which means leaf.
Mikhail Semyonovich Tsvet, an Italian-Russian botanist, who invented chromatography in 1906, managed to separate leaf pigments, namely, chlorophylles from carotenes and xanthophylls, thanks to column chromatography, and called the yellow-to-orange pigments carotenoids.
Chemical structure
Carotenoids are a class of lipids having as a basic structure a linear sequence of 8 isoprene units. Therefore, they are terpenes, specifically tetraterpenes, and then consist of 40 carbon atoms.
The isoprene units are joined in a 1,5 positional relationship, that is, head to tail, except in the middle of the hydrocarbon chain, where the positional relationship is 1,6, that is, tail to tail. This reverses the order making the molecule symmetrical.
Carotenoids are characterized by the presence of an extended double-bond system, 3 to 13 of which can be conjugated.
The hydrocarbon chain of carotenoids can undergo hydrogenation, dehydrogenation, introduction of oxygen atoms, cyclization of one or both ends to form an ionone rings, and may be esterification with fatty acids. Such modifications allow the formation of many different structures, and most of them are described by the chemical formula C40H56On, with 0≤n≤6.
Traditionally, carotenoids have common names related to the biological source from which they are extracted, although they can be named using IUPAC nomenclature.
Isomerism
Carotenoids have many double bonds which can exhibit cis–transisomerism, also known as geometric isomerism. Although in theory their double bonds can be in a cis– or trans-configuration, in nature the trans-configuration prevails, as it is thermodynamically more stable than cis-configuration, thanks to the lower steric hindrance between the substituents.
The rotation around the simple bonds, or sigma bonds, allows the formation of conformational isomers, as well. When the double bonds are on the same side with respect to the sigma bond, namely, cis in reference to the single bond, the conformation is called s-cis conformation; conversely, when the double bonds are on opposite sides with respect to the sigma bond, namely, trans in reference to the single bond the conformation is called s-trans conformation. In nature, acyclic carotenoids are mainly in the s-trans conformation, as it has the least steric hindrance. When the polyene chain ends with cyclic structures, the rotation around the C6-C7 sigma bond gives rise to the formation of a 6-s-cis isomer with less steric hindrance and therefore energetically favored.
It should be noted that the steric hindrance and the dimensions of the carotenoids influence the ability to interact with enzymes and to form supramolecular structures.
Most carotenoids also have a chirality center or a chirality axis, which causes optical isomers to exist. In these cases, to give a unique and unambiguous name to the to the molecule, the RS system is used instead of the Fischer-Rosanoff convention, which is used only for carbohydrates and amino acids.
Classification
Carotenoids can be classified on the basis of the presence or absence of oxygen or cyclic structures.
Based on the presence or absence of oxygen, they are divided into xanthophylls and carotenes.
Carotenes, which are oxygen-free molecules, are made up of only carbon and hydrogen atoms, and have chemical formula C40H56. Examples of carotenes are alpha-carotene, beta-carotene, delta-carotene, zeta-carotene, phytoene, and lycopene.
Xanthophylls also contain oxygen atoms, have chemical formula C40H56On, with 0˂n≤6, and can, in turn, be divided into:
hydroxycarotenoids, which contain at least one hydroxyl group, such as alpha-cryptoxanthin, beta-cryptoxanthin, zeaxanthin and lutein;
epoxycarotenoids, which have at least one epoxy group, such as antheraxanthin, auroxanthin and luteoxanthin;
ketocarotenoids, which have one or more carbonyl groups, such as astaxanthin and canthaxanthin.
Depending on the presence or absence of rings in the molecule, carotenoids can be divided into cyclic and acyclic.
Cyclic carotenoids contain one or two cyclic structures, and, compared to acyclic carotenoids, are shorter, but with a greater steric hindrance and a greater space occupied. Examples are alpha-carotene, beta-carotene, gamma-carotene and delta-carotene.
Acyclic carotenoids are formed by a linear carbon chain. Examples are lycopene, zeta-carotene, phytoene, and phytofluene.
Finally, there are also uncommon or species-specific carotenoids, such as bixin, capsanthin and capsorubin.
Solubility
Carotenoids are hydrophobic molecules, therefore soluble in organic solvents, solubility which varies according to the substituents present. Given their hydrophobicity, they are found in cell membranes. In most cases, the xanthophylls have the polar groups at the ends of the polyene chain, and, when present in cell membranes, in order to minimize the energy of the system, they arrange themselves in such a way that the polar groups are in contact with the polar groups of the lipid bilayer.
Carotenoids can also have access to the aqueous environment if in association with proteins, to which they bind non-covalently. In plasma, they are transported by lipoproteins.
Color
The conjugated double bond system, acting as a chromophore, is responsible for the color of carotenoids. However, only carotenoids that have at least seven conjugated double bonds are colored; hence, phytofluene, which has five conjugated bonds, or phytoene, which has three conjugated double bonds, are colorless.
As the number of conjugated double bonds increases, the color changes from yellow to orange to red; for example, lutein, alpha-cryptoxanthin, and violaxanthin are yellow, alpha-carotene, beta-carotene, and gamma-carotene are orange, and lycopene is red.
Role in plants
Carotenoids play many roles in plants.
They contribute to cell protection against oxidative damage, increase the absorption of sunlight, are the precursors of phytohormones, such as abscisic acid, and are involved in signaling pathways. Furthermore, with chlorophylls and anthocyanins, a class of flavonoids, the major type of polyphenols, they contribute to the color of leaves, fruits, vegetables, and grains, color which, attracting animals, promotes pollination and seed dispersion. Finally, they can act as repellent agents for phytophages and pathogens, as well.
Quenching of singlet oxygen
In organisms that carry out oxygenic photosynthesis, carotenoids contribute to the protection from damage caused by excessive solar radiation. When the sunlight arriving at the photosystem II antenna complex exceeds the conversion capacity of the reaction centers, the excess energy can cause chlorophyll to remain in its excited state, which can lead to the formation of its triplet state. The excess energy can be transferred from chlorophyll to molecular oxygen causing the formation of singlet oxygen, a reactive oxygen species, capable of damaging the photosynthetic apparatus and, more generally, nucleic acids, proteins, membrane unsaturated fatty acids, as well as enzyme cofactors.
Carotenoids can prevent oxidative damage caused by singlet oxygen in two ways.
They can directly quench the singlet oxygen. In this case the energy is transferred to the carotenoid by the singlet oxygen, which decays to the triplet ground state, while the carotenoid reach the triplet state, then releasing the excess energy in the form of heat. The capacity of quench singlet oxygen increases with the number of conjugated double bonds, being maximal at nine or more conjugated double bonds. In vitro studies seem to indicate that monocyclic carotenoids are able to quench singlet oxygen more efficiently than acyclic structures, and that the presence of carbonyl groups, such as in astaxanthin, improves the antioxidant potential compared to those with hydroxyl groups, probably thanks to the extended system of conjugated double bonds. It seems that each carotenoid, before undergoing degradation reactions, is able to quench about 1000 singlet oxygen molecules.
Carotenoids are also able to prevent the formation of singlet oxygen by absorbing the energy of the excited chlorophyll, so turning into a triplet state. As the triplet state of carotenoids has an energy level lower than that of singlet oxygen, it spontaneously decays to the fundamental state.
Free radical scavenging activity
Carotenoids are able to scavenge free radicals, such as hydroxyl, peroxyl, and superoxide radicals, and nitric oxide radical. Their action can occur in four different ways.
Carotenoid can donate an electron to the radical cation, producing the radical cation of the carotenoid, while the radical becomes a stable molecule. The carotenoid radical cation can be regenerated to parent carotenoid by other cellular antioxidants, such as vitamin E, vitamin C and glutatione.
A proton can be transferred from the carotenoid to the radical species, which becomes a neutral molecule, while the carotenoid becomes a radical anion.
The neutralization of the free radicals can also occur as a result of addition reactions, as in the case of the neutralization of hydroxyl and peroxyl radicals.
An hydrogen atom can be transfer from carotenoid to the reactive oxygen species, which leads to a neutral-resonance-stabilized carotenoid radical.
Light-harvesting role
Carotenoids are present in the antenna complexes as accessory light-harvesting pigments, mainly associated with antenna proteins.
Thanks to the system of conjugated double bonds, they are able to absorb sunlight in the range of 400-500 nm. Then, the absorbed energy is conveyed to the reaction centers.
The absorption spectra of individual carotenoids depend on the length of the conjugation network and the type of functional groups present.
The main carotene involved in light-harvesting is beta-carotene, present in the core of photosystems I and II of all organisms that carry out an oxygenic photosynthesis, whereas lutein, violaxanthin, neoxanthin and zeaxanthin, the main xanthophylls in plants, are bound to the light-harvesting complexes.
Food sources
Humans are not able to synthesize carotenoids. They take them from food, and store them mainly in liver and adipose tissue, but also in lung, kidney, brain, and bone, where they play many functions.
Of all the carotenoids identified, about a hundred have been found in foods consumed by humans, while, if we consider the single food item, generally there are one to five main carotenoids, accompanied by others present in traces or in any case small quantities.
Fruits and vegetables are the major source of carotenoids in the human diet. Among vegetables, leafy greens are rich in beta-carotene, the most abundant carotenoid in human diet and tissues, and lutein, followed by violaxanthin and neoxanthin, carrot root is rich in beta-carotene, pumpkin in alpha-carotene, tomato in lycopene, and peppers in capsanthin and capsorubin. Carotenoids in fruits are very varied, and those in ripe fruit can be different from those in unripe fruit. Furthermore, most of the carotenoids present in ripe fruits are esterified with fatty acids. However, those of some fruits, in particular fruits that remain green when ripe, such as kiwis, undergo limited or absent esterification.
Chicken eggs, thanks to the fact that laying hens mostly eat corn, are a good source of some carotenoids, such as lutein and zeaxanthin, which are responsible for the yellow-orange color of egg yolk.
Finally, mollusks and crustaceans, which together with fish are the main sources of long-chain omega-3 polyunsaturated fatty acids, such as eicosapentaenoic acid and docosahexaenoic acid, are the main source of carotenoids produced by microalgae and rarely found in plants, such as astaxanthin in shrimp, but also in salmon.
Food additives
Carotenoids used in food industry as additives, unlike naturally occurring carotenoids, are relatively unstable, being susceptible to the action of oxygen and sunlight, auto-oxidation, and dispersion into food ingredients which facilitates their degradation. Furthermore, at body and food storage temperatures the added carotenoids, due to their high melting point, are in crystalline form; to overcome this problem, they are used in the form of an oil-in-water emulsion.
Thanks to their coloring power, they are used as colours in foods which, due to processing or storage, lose part of their natural colour, or to standardize the colour of the products, as in the case of beverages, fruit juices or sausages, or to intensify their colour, thus improving their appearance.
Carotenoids are also precursors of compounds responsible for the flavor and aroma of some foods, hence, they can be used as flavour enhancers.
Furthermore, some carotenoids are vitamin A precursors and are used to fortify foods.
Finally, it should be emphasized that, when added to food, carotenoids are not powerful antioxidants.
Carotenoids and human health
In humans, carotenoids play important roles.
The most important role is to be precursors of vitamin A, which controls the expression of nearly 700 genes. Not all carotenoids are vitamin A precursors; only those with an unsubstituted beta-ionone ring are vitamin A precursors. The most important is beta-carotene which, having two unsubstituted beta-ionone rings, is converted into two molecules of the vitamin. Alpha-carotene and beta-cryptoxanthin, having only an unsubstituted beta-ionone ring, provide one molecule of vitamin A, hence, they have 50 percent provitamin A activity. The importance of provitamin A carotenoids is underlined by the fact that vitamin A deficiency can lead to night blindness and xerophthalmia, delay the growth and regeneration of the mucous membranes, increases the mortality rate caused by infectious diseases due to immune-related disorders, and is the single most important cause of childhood blindness in developing countries.
Carotenoids contribute to human health also by preventing the development of numerous chronic diseases through different mechanisms than provitamin A activity, such as antioxidant and anti-inflammatory actions, and photoprotection. Here are some examples. It has been observed that supplementation with lutein and zeaxanthin, two xanthophylls which accumulate in the macula lutea, is associated with an improvement in visual function and a reduction in the risk of progression of age-related macular degeneration. Lutein and zeaxanthin also seem to have a preventive effect on the development of cataracts and retinopathies, and lutein also a positive effect on cognitive functions. Among carotenes, the consumption of lycopene–rich foods has been associated with a reduction in the incidence of certain types of cancer, such as prostate and stomach cancer, and a reduction in cardiovascular risk.
Plasma carotenoids
Alpha-carotene, beta-carotene, lycopene, lutein, beta-cryptoxanthin and zeaxanthin make up more than 90 percent of the carotenoids present in plasma.
Carotenoid plasma concentrations depend on several factors including methods of cooking foods, the amount of lipids in the diet, individual variables regarding the processes of lipid digestion and lipid absorption, in which bile salts play an essential role, and vitamin A levels in the body. Considering the latter factor, a subject with low vitamin A levels may have a high conversion rates of provitamin A carotenoids, and this could be reflected in a lower plasma concentration.
References
Amengual J. Bioactive properties of carotenoids in human health. Nutrients 2019;11(10):2388. doi:10.3390/nu11102388
Archetti, M., Döring T.F., Hagen S.B., Hughes N.M., Leather S.R., Lee D.W., Lev-Yadun S., Manetas Y., Ougham H.J. Unravelling the evolution of autumn colours: an interdisciplinary approach. Trends Ecol Evol 2009;24(3):166-73. doi:10.1016/j.tree.2008.10.006
Böhm V., Lietz G., Olmedilla-Alonso B., Phelan D., Reboul E., Bánati D., Borel P., Corte-Real J., de Lera A.R., Desmarchelier C., Dulinska-Litewka J., Landrier J.F., Milisav I., Nolan J., Porrini M., Riso P., Roob J.M., Valanou E., Wawrzyniak A., Winklhofer-Roob B.M., Rühl R., Bohn T. From carotenoid intake to carotenoid blood and tissue concentrations – implications for dietary intake recommendations. Nutr Rev 2021;79(5):544-573. doi:10.1093/nutrit/nuaa008
Burrows T.L., Williams R., Rollo M., Wood L., Garg M.L., Jensen M., Clare Collins C.E. Plasma carotenoid levels as biomarkers of dietary carotenoid consumption: a systematic review of the validation studies. J Nutr Intermed Metab 2015;2(1-2):15-64. doi:10.1016/j.jnim.2015.05.001
de la Rosa L.A., Alvarez-Parrilla E., Gonzàlez-Aguilar G.A. Fruit and vegetable phytochemicals: chemistry, nutritional value, and stability. 1th Edition. Wiley J. & Sons, 2010
Desmarchelier C., Borel P. Overview of carotenoid bioavailability determinants: from dietary factors to host genetic variations. Trends Food Sci Technol 2017;69:270-280 doi:10.1016/j.tifs.2017.03.002
Eggersdorfer M., Wyss A. Carotenoids in human nutrition and health. Arch Biochem Biophys 2018;652:18-26. doi:10.1016/j.abb.2018.06.001
Gruszecki W.I., Strzałka K. Carotenoids as modulators of lipid membrane physical properties. Biochim Biophys Acta 2005;1740(2):108-15. doi:10.1016/j.bbadis.2004.11.015
Leyva-Porras C., Román-Aguirre M., Cruz-Alcantar, P., Pérez-Urizar, J.T., Saavedra-Leos M.Z. Application of antioxidants as an alternative improving of shelf life in foods. Polysaccharides 2021;2:594-607. doi:10.3390/polysaccharides2030036
Namitha K.K., Negi P.S. Chemistry and biotechnology of carotenoids. Crit Rev Food Sci 2010;50:728-760. doi:10.1080/10408398.2010.499811
Ramel F., Birtic S., Cuiné S., Triantaphylidès C., Ravanat J.L., Havaux M. Chemical quenching of singlet oxygen by carotenoids in plants. Plant Physiol 2012;158(3):1267-78. doi:10.1104/pp.111.182394
Rodriguez-Amaya D.B. Food carotenoids: chemistry, biology and technology. Wiley J. & Sons, 2015.
Saini R.K., Prasad P., Lokesh V., Shang X., Shin J., Keum Y.S., Lee J.H. Carotenoids: dietary sources, extraction, encapsulation, bioavailability, and health benefits – A review of recent advancements. Antioxidants 2022;11(4):795. doi:10.3390/antiox11040795
Sourkes T. L. The discovery and early history of carotene. Bull Hist Chem 2009;34(1)
Swapnil P., Meena M., Kumar Singh S., Praveen Dhuldhaj U., Harish, Marwal A. Vital roles of carotenoids in plants and humans to deteriorate stress with its structure, biosynthesis, metabolic engineering and functional aspects. Curr Plant Biol 2021;26: 100203. doi:10.1016/j.cpb.2021.100203
Xu P., Chukhutsina V.U, Nawrocki W.J., Schansker G, Bielczynski L.W., Lu Y., Karcher D., Bock R., Croce R. Photosynthesis without β-carotene. eLife 2020;9:e58984. doi:10.7554/eLife.58984
Carbohydrate loading is a good strategy to increase fuel stores in muscles before the start of the competition.
What does the muscle “eat” during endurance exercise?
Muscle “eats” carbohydrates, in the form of liver and muscle glycogen, carbohydrates ingested during the exercise or just before that, and fat.
During endurance exercise, the most likely contributors to fatigue are dehydration and carbohydrate depletion, especially of muscle and liver glycogen.
To prevent the “crisis” due to the depletion of muscle and liver carbohydrates, it is essential having high glycogen stores before the start of the activity.
What does affect glycogen stores?
The diet in the days before the competition.
The level of training (well-trained athletes synthesize more glycogen and have potentially higher stores, because they have more efficient enzymes).
The activity in the day of the competition and the days before (if muscle doesn’t work it doesn’t lose glycogen). Therefore, it is better to do light trainings in the days before the competition, not to deplete glycogen stores, and to take care of nutrition.
The “Swedish origin” of carbohydrate loading
Very high muscle glycogen levels (the so-called glycogen supercompensation) can improve performance, i.e. time to complete a predetermined distance, by 2-3% in the events lasting more than 90 minutes, compared with low to normal glycogen, while benefits seem to be little or absent when the duration of the event is less than 90 min.
Well-trained athletes can achieve glycogen supercompensation without the depletion phase prior to carbohydrate loading, the old technique discovered by two Swedish researchers, Saltin and Hermansen, in 1960s.
The researchers discovered that muscle glycogen concentration could be doubled in the six days before the competition following this diet:
three days of low carb menu (a nutritional plan very poor in carbohydrates, i.e. without pasta, rice, bread, potatoes, legumes, fruits etc.);
three days of high carbohydrate diet, the so-called carbohydrate loading (a nutritional plan very rich in carbohydrates).
This diet causes a lot of problems: the first three days are very hard and there may be symptoms similar to depression due to low glucose delivery to brain, and the benefits are few.
Moreover, with the current training techniques, the type and amount of work done, we can indeed obtain high levels of glycogen: above 2.5 g/kg of body weight.
The “corrent” carbohydrate loading
If we compete on Sunday, a possible training/nutritional plan to obtain supercompensation of glycogen stores can be the following:
Wednesday, namely four days before the competition, moderate training and then dinner without carbohydrates;
from Thursday on, namely the three days before the competition, hyperglucidic diet and light trainings.
Example of Carbohydrate Loading
The amount of dietary carbohydrates needed to recover glycogen stores or to promote glycogen loading depends on the duration and intensity of the training programme, and they span from 5 to 12 g/kg of body weight/d, depending on the athlete and his activity. With higher carbohydrate intake you can achieve higher glycogen stores but this does not always results in better performance; moreover, it should be noted that glycogen storage is associated with weight gain due to water retention (approximately 3 g per gram of glycogen), and this may not be desirable in some sports.
References
Burke L.M., Hawley J.A., Wong S.H.S., & Jeukendrup A. Carbohydrates for training and competition. J Sport Sci 2011;29:Sup1,S17-S27. doi:10.1080/02640414.2011.585473
Hargreaves M., Hawley J.A., & Jeukendrup A.E. Pre-exercise carbohydrate and fat ingestion: effects on metabolism and performance. J Sport Sci 2004;22:31-38. doi10.1080/0264041031000140536
Jeukendrup A.E., C. Killer S.C. The myths surrounding pre-exercise carbohydrate feeding. Ann Nutr Metab 2010;57(suppl 2):18-25. doi:10.1159/000322698
Moseley L., Lancaster G.I, Jeukendrup A.E. Effects of timing of pre-exercise ingestion of carbohydrate on subsequent metabolism and cycling performance. Eur J Appl Physiol 2003;88:453-458. doi:10.1007/s00421-002-0728-8
“The acid-ash hypothesis posits that protein and grain foods, with a low potassium intake, produce a diet acid load, net acid excretion, increased urine calcium, and release of calcium from the skeleton, leading to osteoporosis.” (Fenton et al., 2009, see References).
Is it true?
Calcium, present in bones in form of carbonates and phosphates, represents a large reservoir of base in the body. In response to an acid load such as the high protein diets these salts are released into the circulation to bring about pH homeostasis. This calcium is lost in the urine and it has been estimated that the quantity lost with the such diet over time could be as high as almost 480 g over 20 years or almost half the skeletal mass of calcium!
Even these losses of calcium may be buffered by ingestion of foods that are alkali rich as fruit and vegetables, and on-line information promotes an alkaline diet for bone health as well as a number of books, a recent meta-analysis has shown that the causal association between osteoporotic bone disease and dietary acid load is not supported by evidence and there is no evidence that the alkaline diet is protective of bone health, but it is protective against the risk for kidney stones.
Note: it is possible that fruit and vegetables are beneficial to bone health through mechanisms other than via the acid-ash hypothesis.
What is the role of proteins?
Excess dietary proteins with high acid renal load may decrease bone density, if not buffered by ingestion of foods that are alkali rich, that is fruit and vegetables. However, an adequate protein intake is needed for the maintenance of bone integrity. Therefore, increasing the amount of fruit and vegetables may be necessary rather than reducing protein too much.
Therefore it is advisable to consume a normo-proteic diet rich in fruits and vegetables and poor in sodium, such as medieterranean diet, eating foods with a negative acid load together with foods with a positive acid load. Example: pasta plus vegetables or meats plus vegetables and fruits .
Food and Acid Load
Alkaline diet and muscle mass
As we age, there is a loss of muscle mass, which predispose to falls and fractures. A diet rich in potassium, obtained from fruits and vegetables, as well as a reduced acid load, results in preservation of muscle mass in older men and women.
Alkaline diet and growth hormone
In children, severe forms of metabolic acidosis are associated with low levels of growth hormone with resultant short stature; its correction with potassium or bicarbonate citrate increases growth hormone significantly and improves growth. In postmenopausal women, the use of enough potassium bicarbonate in the diet to neutralize the daily net acid load resulted in a significant increase in growth hormone and resultant osteocalcin.
Improving growth hormone levels may reduce cardiovascular risk factors, improve quality of life, body composition, and even memory and cognition.
Conclusion
Alkaline diet may result in a number of health benefits.
Increased fruits and vegetables would improve the potassium/sodium ratio and may benefit bone health, reduce muscle wasting, as well as mitigate other chronic diseases such as hypertension and strokes.
The increase in growth hormone may improve many outcomes from cardiovascular health to memory and cognition.
The increase in intracellular magnesium is another added benefit of the alkaline diet; for example, magnesium, required to activate vitamin D, would result in numerous added benefits in the vitamin D systems.
It should be noted that one of the first considerations in an alkaline diet, which includes more fruits and vegetables, is to know what type of soil they were grown in since this may significantly influence the mineral content and therefore their buffering capacity.
References
Fenton T.R., Lyon A.W., Eliasziw M., Tough S.C., Hanley D.A. Meta-analysis of the effect of the acid-ash hypothesis of osteoporosis on calcium balance. J Bone Miner Res 2009;24(11):1835-1840. doi:10.1359/jbmr.090515
Fenton T.R., Lyon A.W., Eliasziw M., Tough S.C., Hanley D.A. Phosphate decreases urine calcium and increases calcium balance: a meta-analysis of the osteoporosis acid-ash diet hypothesis. Nutr J 2009;8:41. doi:10.1186/1475-2891-8-41
Fenton T.R., Tough S.C., Lyon A.W., Eliasziw M., Hanley D.A. “Causal assessment of dietary acid load and bone disease: a systematic review and meta-analysis applying Hill’s epidemiologic criteria for causality.” Nutr J 2011;10:41. doi:10.1186/1475-2891-10-41
Schwalfenberg G.K. The alkaline diet: is there evidence that an alkaline pH diet benefits health? J Environ Public Health 2012; Article ID 727630. doi:10.1155/2012/727630
Life depends on appropriate pH levels around and in living organisms and cells.
We requires a tightly controlled pH level in our serum of about 7.4 to avoid metabolic acidosis and survive. As a comparison, in the past 100 years the pH of the ocean has dropped from 8.2 to 8.1 because of increasing carbon dioxide deposition with a negative impact on life in the ocean.
The pH Scale
Even the mineral content of the food we eat is considerable influenced by the pH of the soil in which plants are grown. The ideal pH of soil for the best overall availability of essential nutrients is between 6 and 7: an acidic soil below pH of 6 may have reduced magnesium and calcium, and soil above pH 7 may result in chemically unavailable zinc, iron, copper and manganese.
Metabolic acidosis and agricultural and industrial revolutions
In the human diet, there has been considerable change from the hunter gather civilization to the present in the pH and net acid load. With the agricultural revolution, in the last 10,000 years, and even more recently with industrialization, in the last 200 years, it has been seen:
an increase in sodium compared to potassium, as the ratio potassium/sodium has reversed from 10 to 1 to a ratio of 1 to 3 in the modern diet, and in chloride compared to bicarbonate;
This results in a diet that may induce metabolic acidosis which is mismatched to the genetically determined nutritional requirements.
Moreover, with aging, there is a gradual loss of renal acid-base regulatory function and a resultant increase in diet-induced metabolic acidosis.
Finally, a high protein low-carbohydrate diet with its increased acid load results in very little change in blood chemistry, and pH, but results in many changes in urinary chemistry: urinary calcium, undissociated uric acid, and phosphate are increased, while urinary magnesium, urinary citrate and pH are decreased.
All this increases the risk for kidney stones.
pH as a protective barrier
The human body has an amazing ability to maintain a steady pH in the blood with the main compensatory mechanisms being renal and respiratory.
The pH in the body vary considerably from one area to another. The highest acidity is found in the stomach (pH of 1.35 to 3.5) and it aids in digestion and protects against opportunistic microbial organisms. The skin is quite acidic (pH 4-6.5) and this provides an acid mantle as a protective barrier to the environment against microbial overgrowth (this is also seen in the vagina where a pH of less than 4.7 protects against microbial overgrowth).
The urine have a variable pH from acid to alkaline depending on the need for balancing the internal environment.
Modified from: Schwalfenberg G.K.; see in References
References
Fenton T.R., Lyon A.W., Eliasziw M., Tough S.C., Hanley D.A. Meta-analysis of the effect of the acid-ash hypothesis of osteoporosis on calcium balance. J Bone Miner Res 2009;24(11):1835-1840. doi:10.1359/jbmr.090515
Fenton T.R., Lyon A.W., Eliasziw M., Tough S.C., Hanley D.A. Phosphate decreases urine calcium and increases calcium balance: a meta-analysis of the osteoporosis acid-ash diet hypothesis. Nutr J 2009;8:41. doi:10.1186/1475-2891-8-41
Fenton T.R., Tough S.C., Lyon A.W., Eliasziw M., Hanley D.A. Causal assessment of dietary acid load and bone disease: a systematic review and meta-analysis applying Hill’s epidemiologic criteria for causality. Nutr J 2011;10:41. doi:10.1186/1475-2891-10-41
Schwalfenberg G.K. The alkaline diet: is there evidence that an alkaline pH diet benefits health? J Environ Public Health 2012; Article ID 727630. doi:10.1155/2012/727630
One of the main functions of the liver is to participate in the maintaining of blood glucose levels within well defined range (in the healthy state before meals 60-100 mg/dL or 3.33-5.56 mmol/L). To do it the liver releases glucose into the bloodstream in:
fasting state;
between meals;
during physical activity.
Blood glucose levels and hepatic glucose 6-phosphatase
In the liver, glycogen is the storage form of glucose which is released from the molecule not as such, but in the phosphorylated form i.e. with charge, the glucose 1-phosphate (this process is called glycogenolysis). The phosphorylated molecule can’t freely diffuse from the cell, but in the liver it is present the enzyme glucose-6-phosphatase that hydrolyzes glucose 6-phosphate, produced from glucose 1-phosphate in the reaction catalyzed by phosphoglucomutase, to glucose (an irreversible dephosphorylation).
Then, glucose can diffuse from the hepatocyte, via a transporter into the plasma membrane called GLUT2, into the bloodstream to be delivered to extra-hepatic cells, in primis neurons and red blood cells for which it is the main, and for red blood cells the only energy source (neurons, with the exception of those in some brain areas that can use only glucose as energy source, can derive energy from another source, the ketone bodies, which becomes predominant during periods of prolonged fasting).
Note: the liver obtains most of the energy required from the oxidation of fatty acids, a class of lipids, and not from glucose.
Glucose-6-phosphatase is present also in the kidney and gut but not in the muscle and brain; therefore in these tissues glucose-6-phosphate can’t be released from the cell.
Glucose 6-phosphatase plays an important role also in gluconeogenesis.
Glucose 6-phosphatase is present into the membrane of endoplasmic reticulum and the hydrolysis of glucose-6-phosphate occurs into its lumen (therefore this reaction is separated from the process of glycolysis). The presence of a specific transporter, the glucose 6-phosphate translocase, is required to transport the phosphorylated molecule from citosol into the lumen of endoplasmic reticulum. Although a glucose transporter is present into the membrane of endoplasmic reticulum, most of the released glucose is not transported back into the cytosol of the cell but is secreted into the bloodstream. Finally, an ion transporter transports back into the cytosol the inorganic phosphate released into the endoplasmic reticulum.
References
Nelson D.L., M. M. Cox M.M. Lehninger. Principles of biochemistry. 6th Edition. W.H. Freeman and Company, 2012
Roach P.J., Depaoli-Roach A.A., Hurley T.D and Tagliabracci V.C. Glycogen and its metabolism: some new developments and old themes. Biochem J 2012;441:763-787. doi:10.1042/BJ20111416
Stipanuk M.H., Caudill M.A. Biochemical, physiological, and molecular aspects of human nutrition. 3rd Edition. Elsevier health sciences, 2012
The international scientific literature is unanimous in setting the lower limit for the daily caloric intake to 1200 kcal for women and 1500 kcal for men (adults).
To make negative the daily caloric intake, and therefore lose body weight, but expecially lose body fat, evaluation of actual caloric needs of the subject will be alongside:
the correct distribution of meals during the day;
an increased physical activity, by which the negative balance can be achieved without major sacrifices during meals.
Daily Caloric Balance
This will make weight loss easier and protect from subsequent weight gains and yo-yo effect.
Ultimately, there must be a change in lifestyle.
So, the best strategy for losing body fat is not a drastic reduction in caloric intake, nor follow constrictive or “strange” diets, such as hcg diet plan, sacred heart diet, paleo diet, etc., that require to eliminate or greatly reduce the intake of certain macronutrients, mostly carbohydrates.
Such conducts can be:
very stressful from psychological point of view;
not passable for long periods;
hazardous to health because of inevitable nutrient deficiencies.
Finally, they do not ensure that all the weight lost is only or almost only body fat and are often followed by substantial increases in body weight and/or by yo-yo effect.
Why?
Body fat and reduction of energy intake
An excessive reduction of energy intake means eating very little and this determines the risk, high, not to take adequate amounts of the various essential nutrients, that is, what we can’t synthesize, such as vitamins, certain amino acids, essential fatty acids, a class of lipids, and minerals, including e.g. calcium, essential for bone metabolism at every stage of life, or iron, used in many body functions as the transport of oxygen to the tissues. This results in a depression of metabolism and hence a reduction in energy expenditure.
Whether the reduction in energy intake is excessive, or even there are periods of fasting, it adds insult to injury because a proportion of free fatty mass will be lost. How?
Reduction in energy intake and role of carbohydrates
Glucose is the only energy source for red blood cells and some brain areas, while other brain areas can also derive energy from ketone bodies, which are a product of the metabolism of fatty acids.
At rest, brain extracts 10 percent of the glucose from the bloodstream, a significant amount, about 75 mg/min., considering that its weight is about 1.5 kg. To maintain a constant glycemia, and thus ensure a constant supply of glucose to tissues, we needs to take carbohydrates or alternatively amino acids, both easily obtained from foods.
In the case of a low or absent dietary intake of carbohydrates, whereas after about 18 hours liver glycogen, which releases glucose into circulation, depletes, body synthesizes de novo glucose from certain amino acids through a process called gluconeogenesis (actually this metabolic pathway is active even after a normal meal but increases its importance in fasting).
But what’s the main source of amino acids in the body when their dietary intake is low or absent? Endogenous proteins, and there is a hierarchy in their use that is before we consume the less important and only after the most important ones. For the first digestive enzymes, pepsin, chymotrypsin, elastase, carboxypeptidase and aminopeptidase, around 35-40 g, will be used; successively liver and pancreas slow down their synthesis activities for export proteins and unused amino acids are directed to gluconeogenesis. It’s clear that these are quite modest reserves of amino acids and it is the muscle that will undertake to provide the required amounts of amino acids that is proteolysis of muscle proteins begins.
Note: Anyway, there is no absolute sequentiality in the degradation of several proteins, there is instead a plot in which, proceeding, some ways lose their importance and others will buy. So, to maintain constant glycemia the protein component of muscle is reduced, including skeletal muscle that is a tissue that represents a fairly good portion of the value of the basal metabolism and that, with exercise, can significantly increase its energy consumption: thus essential for weight loss and subsequent maintenance. It is as if the engine capacity was reduced.
One thing which we don’t think about is that heart is a muscle that may be subject to the same processes seen for skeletal muscle.
Ultimately make glucose from proteins, also food-borne, is like heat up the fire-place burning the furniture of the eighteenth century, amino acids, having available firewood, dietary carbohydrates.
Therefore, an adequate intake of carbohydrates with diet prevents excessive loss of proteins, namely, there is a saving effect of proteins played by carbohydrates.
Mammals, and therefore humans, can’t synthesize glucose from fats.
What goes in when carbohydrates goes out?
The elimination or substantial reduction in carbohydrate intake in the diet results in an increased intake of proteins, lipids, including cholesterol, because it will increase the intake of animal products, one of the main defects in hyperproteic diet.
In the body there are no amino acids reserves, thus they are metabolized and, as a byproduct of their use, ammonia is formed and it’ll be eliminated as toxic. For this reason high-protein diets imply an extra work for liver and kidneys and also for this they are not without potential health risks.
An increased fat intake often results into an increased intake of saturated fatty acids, trans fatty acids, and cholesterol, with all the consequences this may have on cardiovascular health.
What has been said so far should not induce to take large amounts of carbohydrates; this class of macronutrients should represent 55-60% of daily calories, fats 25-30% (primarily olive oil) and the remainder proteins: thus a composition in macronutrient that refers to prudent diet or mediterranean diet.
Body fat and the entry in a phase of famine/disease
A excessive reduction in caloric intake is registered by our defense mechanisms as an “entry” in a phase of famine/disease.
The abundance of food is a feature of our time, at least in industrialized countries, while our body evolved over hundreds of thousands of years during which there was no current abundance: so it’s been programmed to try to overcome with minimal damage periods of famine. If caloric intake is drastically reduced it mimics a famine: what body does is to lower consumption, lower the basal metabolism, that is, consumes less and therefore also not eating much we will not get great results. It is as if a machine is lowered the displacement, it’ll consume less (our body burns less body fat).
Yo-yo effect
Yo-yo effect or weight cycling, namely, repeated phases of loss and weight gain, appears related to excess weight and accumulation of fat in the abdomen.
Several studies suggest a link in women with:
Lastly, yo-yo effect is related to a greater easy to gain weight than those who are not subject to it. In this regard there should be emphasized that the weight cycling occurs over years, during which, aging, the rate of metabolism inevitably tends to decrease: this could make more difficult the subsequent losses.
References
Cereda E., Malavazos A.E., Caccialanza R., Rondanelli M., Fatati G. and Barichella M. Weight cycling is associated with body weight excess and abdominal fat accumulation: a cross-sectional study. Clin Nutr 2011;30(6):718-723. doi:10.1016/j.clnu.2011.06.009
Montani J-P., Viecelli A.K., Prévot A. & Dulloo A.G. Weight cycling during growth and beyond as a risk factor for later cardiovascular diseases: the ‘repeated overshoot’ theory. Int J Obes (Lond) 2006;30:S58-S66. doi:10.1038/sj.ijo.0803520
Ravussin E., Lillioja S., Knowler W.C., Christin L., Freymond D., Abbott W.G.H., Boyce V., Howard B.V., and Bogardus C. Reduced rate of energy expenditure as a risk factor for body-weight gain. N Engl J Med 1988;318:467-472. doi:10.1056/NEJM198802253180802
Sachiko T. St. Jeor S.T. St., Howard B.V., Prewitt T.E., Bovee V., Bazzarre T., Eckel T.H., for the AHA Nutrition Committee. Dietary Protein and Weight Reduction. A Statement for Healthcare Professionals From the Nutrition Committee of the Council on Nutrition, Physical Activity, and Metabolism of the American Heart Association. Circulation 2001;104:1869-1874. doi:10.1161/hc4001.096152
When excess calories are consumed from carbohydrates or proteins, such surplus is used to synthesize fatty acids and then triacylglycerols, while it doesn’t occur if the excess come from fats.
De novo fatty acid synthesis in plants and animals
De novofatty acid synthesis is largely similar among plants and animals.
It occurs in chloroplasts of photosynthetic cells of higher plants, and in cytosol of animal cells by the concerted action of two enzymes: acetyl-CoA carboxylase (EC 6.4.1.2) and fatty acid synthase (EC 2.3.1.85).
Fatty acid synthase catalyzes a repeating four-step sequence by which the fatty acyl chain is extended by two carbons, at the carboxyl end, every each passage through the cycle; this four-step process is the same in all organisms.
In animals, the primary site for lipid metabolism is liver, not the adipose tissue. However, adipose tissue is a major organ system in which fatty acid synthesis occurs, though in humans it is less active than in many other animal species.
Although myristic acid, lauric acid and a trace of stearic acid may also be produced, in animals and plants the main product of these reactions is palmitic acid.
It should be noted that in certain plants, such as palm and coconut, chain termination occurs earlier than palmitic acid release: up to 90% of the fatty acids produced and then present in the oils of these plants are between 8 (caprylic acid) and 14 (myristic acid) carbons long (palmitic acid: 16 carbon atoms).
Synthesis of long chain saturated and unsaturated fatty acids
Palmitic acid is the commonest saturated fatty acid in plant and animal lipids, but generally it is not present in very large proportions because it may be undergo into several metabolic pathways.
In fact:
it is the precursor of stearic acid;
it may be desaturated (insertion of a double bond into fatty acid chain) to palmitoleic acid, the precursor of all fatty acids of omega-7 or n-7 family, in a reaction catalyzed by Δ9-desaturase (EC 1.14.19.1), an ubiquitous enzyme in both plant and animal kingdoms and the most active lipid enzyme in mammalian tissues, the same enzyme that catalyzes the desaturation of stearic acid to oleic acid.
Note: Δ9- desaturase inserts double bounds in the 9-10 position of the fatty acid carbon chain, position numbered from the carboxyl end of the molecule, and:
if the substrate is palmitic acid, the double bond is inserted between n-7 and n-8 position of the chain (in this case numbered from the methyl end of the molecule), so producing palmitoleic acid, the founder of omega-7 series;
if the substrate is stearic acid, the double bond is inserted between n-9 and n-10 position of the chain and oleic acid will be produced.
It may be esterified into complex lipids.
Of course, in plants and animals there are fatty acids longer and/or more unsaturated than these just seen thanks to modification systems (again desaturation and elongation) that catalyze reactions of fatty acid synthesis that are organism- tissue- and cell- specific.
For example, stearic acid may be:
elongated to arachidic acid, behenic acid and lignoceric acid, all saturated fatty acids, in reactions catalyzed by elongases. Again, chain elongation occurs, both in mitochondria and in the smooth endoplasmic reticulum, by the addition of two carbon atom units at a time at the carboxylic end of the fatty acid through the action of fatty acid elongation systems (particularly long and very long saturated fatty acids, from 18 to 24 carbon atoms, are synthesized only on cytosolic face of the smooth endoplasmic reticulum);
desaturated, as seen, to oleic acid, an omega-9 or n-9 fatty acid, in a reaction catalyzed by Δ9-desaturase.
Several researchers have postulated that the reason for which stearic acid does not concur to hypercholesterolemia is its rapid conversion to oleic acid.
Oleic acid is the start point for the synthesis of many other unsaturated fatty acids by reactions of elongation and/or desaturation.
In fact:
gadoleic acid, erucic acid and nervonic acid, all monounsaturated fatty acids.
Saturated fatty acids, and unsaturated fatty acids of the omega-9 series, usually oleic acid (but also palmitoleic acid and other omega-7 fatty acids) are the only fatty acids produced de novo in mammal systems.
Thanks to the consecutive action of the enzymes Δ12-desaturase (1.14.19.6) and Δ15-desaturase (EC 1.14.19.25), that insert a double bond respectively in the 12-13 and 15-16 position of the carbon chain of the fatty acid, oleic acid is converted first to linoleic acid, founder of all the omega-6 polyunsaturated fatty acids, and then to alpha-linolenic acid, founder of all the omega-3 polyunsaturated fatty acids (omega-3 and omega-6 PUFA that will be produced from these precursors through repeating reactions of elongation and desaturation).
In the case of essential fatty acid (EFA) deficiency, oleic acid may be desaturated and elongated to omega-9 polyunsaturated fatty acids, with accumulation especially of Mead acid.
Omega-3 and omega-6 PUFA synthesis
Animal tissues can desaturate fatty acids in the 9-10 position of the chain, thanks to the presence of Δ9 desaturase; as previously seen, if the substrate of the reaction is palmitic acid, the double bond will appear between n-7 and n-8 position, with stearic acid between n-9 and n-10 position, so leading to formation respectively of palmitoleic acid and oleic acid.
Animals lack Δ12- and Δ15-desaturases, enzymes able to desaturate carbon carbon bonds beyond the 9-10 position of the chain. For these reason, they can’t produce de novo omega-3 and omega-6 PUFA (which have double bonds also beyond the 9-10 position), that are so essential fatty acids.
Δ12- and Δ15-desaturases are present in plants; though many land plants lack Δ15-desaturase, also called omega-3 desaturase, planktons and aquatic plants in colder water possess it and produce abundant amounts of the omega-3 fatty acids.
References
Akoh C.C. and Min D.B. “Food lipids: chemistry, nutrition, and biotechnology”. CRC Press Taylor & Francis Group, 2008 3th ed. 2008
Bender D.A. “Benders’ dictionary of nutrition and food technology”. 2006, 8th Edition. Woodhead Publishing. Oxford
Burr G.O. and Burr M.M. A new deficiency disease produced by the rigid exclusion of fat from the diet. Nutr Rev 1973;31(8):148-149. doi:10.1111/j.1753-4887.1973.tb06008.x
Chow Ching K. “Fatty acids in foods and their health implication”. 3rd Edition. CRC Press Taylor & Francis Group, 2008
Rosenthal M.D., Glew R.H. Mediacal biochemistry. Human metabolism in health and disease. John Wiley & Sons, Inc. 2009
Stipanuk M.H., Caudill M.A. Biochemical, physiological, and molecular aspects of human nutrition. 3rd Edition. Elsevier health sciences, 2012
Muscle glycogen is an important energy source for prolonged moderate to high intensity exercise, an importance that increases during high-intensity interval exercise, common in training session of swimmers, runners, rowers or in team-sport players, or during resistance exercise. For example, considering marathon, about 80% of energy needed comes from carbohydrate oxidation, for the most part skeletal muscle glycogen.
Fatigue and low muscle glycogen levels are closely correlated, but the underlying molecular mechanisms remain elusive. One hypothesis is that there is a minimum glycogen concentration that is “protected” and is not used during exercise, perhaps to ensure an energy reserve in case of need. Due to the closely relationship between skeletal muscle glycogen depletion and fatigue, its re-synthesis rate during post-exercise is one of the most important factors in determining necessary recovery time.
Finally, the highly trained athlete has muscle glycogen stores potentially higher and is also able to synthesize it faster due to more efficient enzymes.
Glycogen Molecule: the Branched Structure, the Tiers, and Glycogenin
To synthesize glycogen it is necessary to ingest carbohydrates; but how many, which, when, and how often?
The two phases of muscle glycogen synthesis after exercise
In order to restore as quickly as possible muscle glycogen depots, it is useful to know that, as a result of training sessions that deplete muscle glycogen to values below 75 percent those at rest and not fasting, glycogen synthesis occurs in two phases.
To know and therefore take advantage of the biphasicity is important for those athletes who are engaged in more daily training sessions, or who otherwise have little time for recovery between a high intensity exercise and the subsequent one, less than 8 hours, in order to maximize glycogen synthesis and achieve the optimal performance during a second close exercise session.
The two phases are characterized by:
a different sensitivity to circulating insulin levels;
a different velocity.
The first phase
Theis phase, immediately following the end of an activity and lasting 30-60 minutes, is insulin-independent, i.e. glucose uptake by muscle cell as glycogen synthesis are independent from hormone action.
This phase is characterized by an elevated rate of synthesis that however decreases rapidly if you do not take in carbohydrates: the maximum rate is in the first 30 minutes, then declines to about one fifth in 60 minutes, and to about one ninth in 120 minutes from the end of exercise.
How is it possible to take advantage of this first phase to replenish muscle glycogen stores as much as possible? By making sure that the greatest possible amount of glucose arrives to muscle in the phase immediately following to the end of exercise, best if done within the first 30 minutes.
What to ingest?
High glycemic index, but easy to digest and absorb, carbohydrates.
Therefore, it is advisable to replace foods, even though of high glycemic index, that need some time for digestion and the subsequent absorption, with solutions/gel containing for example glucose and/or sucrose. These solutions ensure the maximal possible absorption rate and resupply of glucose to muscle because of they contain only glucose and are without fiber or anything else that could slow carbohydrate digestion and the following absorption of monosaccharides, that is, they are capable of producing high blood glucose levels in a relatively short time.
It is also possible to play on temperature and concentration of the solution to accelerate the gastric transit.
It should be further underlined that the use of these carbohydrate solutions is recommended only when the recovery time from a training/competition session causing significant depletion of muscle glycogen and the following one is short, less than 8 hours.
How many carbohydrates do you need?
Many studies has been conducted to find the ideal amount of carbohydrates to ingest.
If in post-exercise the athlete does not eat, glycogen synthesis rate is very low, while if he ingests adequate amounts of carbohydrates immediately after cessation of exercise, synthesis rate can reach a value over 20 times higher.
From the analysis of scientific literature it seems reasonable to state that, as a result of training sessions that deplete muscle glycogen stores as seen above (<75 percent of those at rest and not fasting), the maximum synthesis rate is obtained by carbohydrate intake, with high glycemic index and high digestion and absorption rates, equal to about 1.2 g/kg of body weight/h for the next 4-5 hours from the end of exercise.
In this way, the amount of glycogen produced is higher than 150 percent compared to the ingestion of 0.8 g/kg/h.
Because further increases, up to 1.6 g/kg/h, do not lead to further rise in glycogen synthesis rate, the carbohydrate amount equal to 1.2 g/kg/h can be considered optimum to maximize the resynthesis rate of muscle glycogen stores during post-exercise.
And the frequency of carbohydrate ingestion?
It was observed that if carbohydrates are ingested frequently, every 15-30 minutes, it seems there is a further stimulation of muscle glucose uptake as of muscle glycogen replenishment compared with ingestion at 2-hours intervals. Particularly, ingestions in the first post-exercise hours seem to optimize glycogen levels.
The second phase
The second phase begins from the end of the first, lasts until the start of the last meal before the next exercise, hence, from several hours to days, and is insulin-dependent i.e. muscle glucose uptake and glycogen synthesis are sensitive to circulating hormone levels.
Moreover, you observe a significant reduction in muscle glycogen synthesis rate: with adequate carbohydrate intake the synthesis rate is at a value of about 10-30 percent lower than that observed during the first phase.
This phase can last for several hours, but tends to be shorter if:
carbohydrate intake is high;
glycogen synthesis is more active;
muscle glycogen levels are increased.
In order to optimize the resynthesis rate of glycogen, experimental data indicate that meals with high glycemic index carbohydrates are more effective than those with low glycemic index carbohydrates; but if between a training/competition session and the subsequent one days and not hours spend, the evidences do not favor high glycemic index carbohydrates as compared to low glycemic index ones as long as an adequate amount is taken in.
Muscle glycogen synthesis rate and ingestion of carbohydrates and proteins
The combined ingestion of carbohydrates and proteins, or free insulinotropic amino acids, allows to obtain post-exercise glycogen synthesis rate that does not significantly differ from that obtained with larger amounts of carbohydrates alone. This could be an advantage for the athlete who may ingest smaller amount of carbohydrates, therefore reducing possible gastrointestinal complications commons during training/competition afterward to their great consumption.
From the analysis of scientific literature it seems reasonable to affirm that, after an exercise that depletes at least 75 percent of muscle glycogen stores, you can obtain a glycogen synthesis rate similar to that reached with 1.2 g/kg/h of carbohydrates alone (the maximum obtainable) with the coingestion of 0.8 g/kg/h of carbohydrates and 0.4 g/kg /h of proteins, maintaining the same frequency of ingestion, therefore every 15-30 minutes during the first 4-5 hours of post-exercise.
The two phases of muscle glycogen synthesis: molecular mechanisms
The biphasicity is consequence, in both phases, of an increase in:
glucose transport rate into cell;
the activity of glycogen synthase, the enzyme that catalyzes glycogen synthesis.
However, the molecular mechanisms underlying these changes are different.
In the first phase, the increase in glucose transport rate, independent from insulin presence, is mediated by the translocation, induced by the contraction, of glucose transporters, called GLUT4, on the cytoplasmatic membrane of the muscle cell.
In addition, the low glycogen levels also stimulate glucose transport as it is believed that a large portion of transporter-containing vesicles are bound to glycogen, and therefore they may become available when its levels are depleted.
Finally, the low muscle glycogen levels stimulate glycogen synthase activity too: it has been demonstrated that these levels are a regulator of enzyme activity far more potent than insulin.
In the second phase, the increase in muscle glycogen synthesis is due to insulin action on glucose transporters and on glycogen synthase activity of muscle cell. This sensibility to the action of circulating insulin, that can persist up to 48 hours, depending on carbohydrate intake and the amount of resynthesized muscle glycogen, has attracted much attention: it is in fact possible, through appropriate nutritional intervention, to increase the secretion in order to improve glycogen synthesis itself, but also protein anabolism, reducing at the same time the protein-breakdown rate.
Glycogen synthesis rate and insulin
The coingestion of carbohydrates and proteins (or free amino acids) increases postprandial insulin secretion compared to carbohydrates alone (in some studies there was an increase in hormone secretion 2-3 times higher compared to carbohydrates alone).
It was speculated that, thanks to the higher circulating insulin concentrations, further increases in post-exercise glycogen synthesis rate could be obtained compared to those observed with carbohydrates alone, but in reality it does not seem so. In fact, if carbohydrate intake is increased to 1.2 g/kg/h plus 0.4 g/kg/h of proteins no further increases in glycogen synthesis rate are observed if compared to those obtained with the ingestion of carbohydrates alone in the same amount, 1,2 g/kg/h, that, as mentioned above, like the coingestion of 0,8 g/kg/h of carbohydrates and 0,4 g/kg/h of proteins, allows to attain the maximum achievable rate in post-exercise, or in isoenergetic quantities, that is, 1.6 g/kg.
Insulin and preferential carbohydrate storage
The greater circulating insulin levels reached with the coingestion of carbohydrates and proteins, or free amino acids, might stimulate the accumulation of ingested carbohydrates in tissues most sensitive to its action, such as liver and previously worked muscle, thus resulting in a more efficient storage, for the purposes of sport activity, of the same carbohydrates.
References
Beelen M., Burke L.M., Gibala M.J., van Loon J.C. Nutritional strategies to promote postexercise recovery. Int J Sport Nutr Exerc Metab 2010:20(6);515-532. doi:10.1123/ijsnem.20.6.515
Berardi J.M., Noreen E.E., Lemon P.W.R. Recovery from a cycling time trial is enhanced with carbohydrate-protein supplementation vs. isoenergetic carbohydrate supplementation. J Intern Soc Sports Nutrition 2008;5:24. doi:10.1186/1550-2783-5-24
Betts J., Williams C., Duffy K., Gunner F. The influence of carbohydrate and protein ingestion during recovery from prolonged exercise on subsequent endurance performance. J Sports Sciences 2007;25(13):1449-1460. doi:10.1080/02640410701213459
Howarth K.R., Moreau N.A., Phillips S.M., and Gibala M.J. Coingestion of protein with carbohydrate during recovery from endurance exercise stimulates skeletal muscle protein synthesis in humans. J Appl Physiol 2009:106;1394–1402. doi:10.1152/japplphysiol.90333.2008
Jentjens R., Jeukendrup A. E. Determinants of post-exercise glycogen synthesis during short-term recovery. Sports Medicine 2003:33(2);117-144. doi:10.2165/00007256-200333020-00004
Millard-Stafford M., Childers W.L., Conger S.A., Kampfer A.J., Rahnert J.A. Recovery nutrition: timing and composition after endurance exercise. Curr Sports Med Rep 2008;7(4):193-201. doi:10.1249/JSR.0b013e31817fc0fd
Price T.B., Rothman D.L., Taylor R., Avison M.J., Shulman G.I., Shulman R.G. Human muscle glycogen resynthesis after exercise: insulin-dependent and –independent phases. J App Physiol 1994:76(1);104–111. doi:10.1152/jappl.1994.76.1.104
Schweitzer G.G., Kearney M.L., Mittendorfer B. Muscle glycogen: where did you come from, where did you go? J Physiol 2017;595(9):2771-2772. doi:10.1113/JP273536
van Loon L.J.C., Saris W.H.M., Kruijshoop M., Wagenmakers A.J.M. Maximizing postexercise muscle glycogen synthesis: carbohydrate supplementation and the application of amino acid or protein hydrolysate mixtures. Am J Clin Nutr 2000;72: 106-111. doi:10.1093/ajcn/72.1.106
Omega-6 polyunsaturated fatty acids are the major polyunsaturated fatty acids or PUFA in the Western diet (about 90% of all of them in the diet), being components of most animal and vegetable fats.
Within the omega-6 family, linoleic acid is one of the most important and widespread fatty acids and the precursor of all omega-6 polyunsaturated fatty acids. It is produced de novo from oleic acid, an omega-9 fatty acid, only by plant in a reaction catalyzed by Δ12-desaturase, i.e. the enzyme that forms the omega-6 polyunsaturated fatty acid family from omega-9 one.
Δ12-desaturase catalyzes the insertion of the double bond between carbon atoms 6 and 7, numbered from the methyl end of the molecule.
Linoleic acid, together with alpha-linolenic acid, is a primary product of plant polyunsaturated fatty acids synthesis.
Omega-6 Polyunsaturated Fatty Acid Metabolism
Animals, lacking Δ12-desaturase, can’t synthesize it, and all the omega-6 polyunsaturated fatty acid family de novo, and they are obliged to obtain it from plant foodstuff and/or from animals that eat them; for this reason omega-6 polyunsaturated fatty acid are considered essential fatty acids, so called EFA. The essentiality of omega-6 polyunsaturated fatty acids, in particular just the essentiality of linoleic acid, was first reported in 1929 by Burr and Burr.
Omega-6 PUFA: from linoleic acid to arachidonic acid
Animals are able to elongate and desaturase dietary linoleic acid in a cascade of reactions to form very omega-6 polyunsaturated fatty acids.
Linoleic acid is first desaturated to gamma-linolenic acid, another important omega-6 fatty acid with significant physiologic effects, in the reaction catalyzed by Δ6-desaturase. It is thought that the rate of this reaction is limiting in certain conditions like in the elderly, under certain disease states and in premature infants; for this reason, and because it is found in relatively small amounts in the diet, few oils containing it, such as black currant, evening primrose, and borage oils, have attracted attention.
In turn gamma-linolenic acid may be elongated to dihomo-gamma-linolenic acid by an elongase. The enzyme catalyzes the addition of two carbon atoms from glucose metabolism to lengthen the fatty acid chain that may be further desaturated in a very limited amount to arachidonic acid, in a reaction catalyzed by another rate limiting enzyme, Δ5-desaturase.
Arachidonic acid can be elongated and desaturated to adrenic acid.
It should be noted that polyunsaturated fatty acids in the omega-6 family, and in any other n-families, can be interconverted by enzymatic processes only within the same family, not among families.
C-20 polyunsaturated fatty acids belonging to omega-6 and omega-3 polyunsaturated fatty acids are the precursors of eicosanoids (prostaglandins, prostacyclin, thromboxanes, and leukotrienes), powerful, short-acting, local hormones.
While the deprivation of omega-3 polyunsaturated fatty acids causes dysfunction in a wide range of behavioral and physiological modalities, the omission in the diet of omega-6 polyunsaturated fatty acids results in manifest systemic dysfunction.
In plant seed oils omega-6 fatty acids with chain length longer than 18 carbons are present only in trace while arachidonic acid is found in all animal tissues and animal-based food products.
References
Akoh C.C. and Min D.B. “Food lipids: chemistry, nutrition, and biotechnology” 3th ed. 2008
Aron H. Uber den Nahvert (On the nutritional value). Biochem Z. 1918;92:211–233 (German)
Bender D.A. “Benders’ dictionary of nutrition and food technology”. 2006, 8th Edition. Woodhead Publishing. Oxford
Bergstroem S., Danielsson H., Klenberg D. and Samuelsson B. The enzymatic conversion of essential fatty acids into prostaglandins. J Biol Chem 1964;239:PC4006-PC4008.
Burr G.O. and Burr M.M. A new deficiency disease produced by the rigid exclusion of fat from the diet. Nutr Rev 1973;31(8):148-149. doi:10.1111/j.1753-4887.1973.tb06008.x
Chow Ching K. “Fatty acids in foods and their health implication” 3th ed. 2008
Rosenthal M.D., Glew R.H. Mediacal biochemistry. Human metabolism in health and disease. John Wiley & Sons, Inc. 2009
Stipanuk M.H., Caudill M.A. Biochemical, physiological, and molecular aspects of human nutrition. 3rd Edition. Elsevier health sciences, 2012
Van D., Beerthuis R.K., Nugteren D.H. and Vonkeman H. Enzymatic conversion of all-cis-polyunsaturated fatty acids into prostaglandins. Nature 1964;203:839-841
Omega-3 polyunsaturated fatty acids or omega-3 PUFAs or omega-3 fatty acids are unsaturated fatty acids, hence lipids, that have a double bond three carbons from the methyl end of the carbon chain.[3] For humans, the most important omega-3 PUFAs are:
eicosapentaenoic acid (EPA) or 20:5n-3, with 20 carbon atoms and 5 double bonds;
docosahexaenoic acid (DHA) or 22:6n-3, that, with 22 carbon atoms and 6 double bonds, is the most complex.
EPA and DHA are termed long-chain polyunsaturated fatty acids (LC-PUFAs).
Mammals cannot synthesize linoleic acid or LA and alpha-linolenic acid, the precursors to omega-6 polyunsaturated fatty acids and omega-3 PUFAs, respectively, due to the lack of two desaturases: delta-12 desaturase (EC 1.14.19.6) and delta-15 desaturase or omega-3 desaturase or fatty acid desaturase 3 (EC 1-14.19.13).[9] Such desaturases insert double bonds at positions 6 and 3 from the methyl end of the molecule, respectively. Linoleic acid and alpha-linolenic acid are therefore essential fatty acids.[34] Humans and many other animals can produce, from dietary ALA, all the other omega-3 polyunsaturated fatty acids. Then, such omega-3 PUFAs become essential in the absence of dietary ALA, and for this reason they are termed conditionally essential fatty acids.[9]
EPA and DHA are important structural components of cell membranes, where they are mainly found, especially in muscle and nerve tissues.[35] Conversely, many other fatty acids are stored mainly in adipose tissue triglycerides.
DHA is the main component of cell membrane phospholipids of neural tissues of vertebrates, including photoreceptor of the retina, where it performs important functions.[22][26][29][32] In addition to their structural functions, omega-3 PUFAs are substrates for the production of bioactive lipid mediators with anti-inflammatory action, such as eicosanoids, maresins, resolvins, and protectins.[10][21]
Omega-3 polyunsaturated fatty acids are essential in neurological development of the fetus, and their intake during pregnancy is especially important in the third trimester of pregnancy, when significant brain growth occurs.[8] In the course of life their intake has been associated with a reduction in the risk of developing many chronic diseases, particularly cardiovascular diseases.[1][27][33]
The major dietary sources for humans are fishery products, especially those obtained from cold waters.[3][9][36]
Alpha-linolenic acid, the precursor for the synthesis of omega-3 polyunsaturated fatty acids, is produced from linoleic acid, an omega-6 PUFAs, in the plastids of phytoplankton and vascular terrestrial plants, where delta-15 desaturase inserts a double bond between carbon 3 and 4 from the methyl end of LA.[3][9] In turn, ALA undergoes desaturation reactions, catalyzed by delta-5 desaturase (EC 1.14.19.44) and delta-6 desaturase (EC 1.14.19.3), elongation reactions, catalyzed by elongase 5 (EC 2.3.1.199) and elongase 5 and/or by elongase 2 (EC 2.3.1.199), and a limited beta-oxidation in peroxisomes, to produce DHA.[6][8] Note that vascular terrestrial plants do not have the ability to synthesize long chain omega-3 PUFA, such as EPA and DHA.[23]
Omega-3 Fatty Acid Metabolism
The enzymes that catalyze the conversion of ALA to DHA are shared with the synthetic pathways leading to the synthesis of omega-6, omega-7 and omega-9 PUFAs.[9] Omega-3 PUFAs appear to be the preferred substrates for delta-5 desaturase and delta-6 desaturase. However, because in many Western diets there is a high intake of linoleic acid relative to alpha-linolenic acid intake, the omega-6 pathway would be preferred over the other pathways.[38] This could be one of the explanations for the low conversion rate of alpha-linolenic acid into the other omega-3 PUFAs, although the synthesis of arachidonic acid (ARA) from linoleic acid seems to be very low, too. Note that both the omega-3 and omega-6 families inhibit the synthesis of omega-9 polyunsaturated fatty acids.
Omega-3 synthesis in humans
Humans, like many other animals, can convert alpha-linolenic acid to docosahexaenoic acid, a metabolic pathway found mainly in the liver and cerebral microcirculation of the hematoencephalic barrier, but also in the cerebral endothelium and astrocytes.[18] It is common opinion that humans, like other terrestrial animals, have a limited capacity to synthesize LC-PUFAs, and therefore need an adequate intake of EPA and DHA from food.[7]
It has been shown that the yield of the synthesis decreases along the pathway: the rate of conversion of alpha-linolenic acid to eicosapentaenoic acid is low, and the limiting factor seems to be the activity of delta-6 desaturase, and the rate of conversion to docosahexaenoic acid is extremely low.[7] However recent studies have demonstrated the existence of a marked polymorphism in the fatty acid desaturase (FADS) gene cluster, especially for the contiguous genes FADS1 and FADS2 coding for delta-5 desaturase and delta-6 desaturase, respectively, which are present on chromosome 11q12.2.[6] By analyzing genome-wide sequencing data from Bronze Age individuals and present-day Europeans, a comprehensive overview was obtained of the changes in allele frequency of FADS genes.[25] In European populations, the transition from a hunter-gatherer society to an agricultural society would have resulted in an increase in the intake of linoleic acid and alpha-linolenic acid, and a reduction in the intake of EPA and ARA. Natural selection would then have favored the haplotype associated with the increase in the expression of FADS1 and the decrease in the expression of FADS2.[6] This pattern is opposite to that found in the Greenlander Inuit, where it is hypothesized that natural selection would have favored alleles associated with a decrease in the rate of conversion of linoleic acid and alpha-linolenic acid into LC-PUFAs, in order to compensate for their relatively high dietary intake in such population.[13]
Do other animals need EPA and DHA?
Organisms lacking delta-15 desaturase cannot synthesize alpha-linolenic acid and hence the other omega-3 PUFAs, and, if needed, must obtain it from dietary sources. However, many animals do not need to get EPA and DHA from diet.
Terrestrial herbivorous vertebrates satisfy their need for long chain omega-3 polyunsaturated fatty acids by synthesizing them from alpha-linolenic acid obtained from the green parts of plants.[19]
And there are animals that do not need EPA and DHA, and practically do not have them. These include terrestrial insects, that have very low levels of EPA. In such animals, EPA is synthesized from dietary alpha-linolenic acid and used for eicosanoid production.[16]
Conversely, aquatic insects have high levels of EPA, whereas DHA is practically absent.[31]
Some classes of phytoplankton, such as Cryptophyceae and Dinophyceae, are very rich in EPA and DHA, whereas Bacillariophyceae or diatoms are very rich in EPA. In general, microalgae are the primary producers of EPA and DHA, and then, aquatic ecosystems are the main source of omega-3 LC-PUFAs in the biosphere.[2][28] EPA and DHA are then transferred from these microalgae along the food chain, from invertebrates to fish, and from fish to terrestrial animals, including humans. So, from microalgae to humans.[16]
Benefits for humans
Omega-3 polyunsaturated fatty acids are essential components of a healthy and balanced diet.[36] They are needed throughout development, starting from fetal life, and are associated with health improvements and reduced risk of disease.[8][26]] Indeed, many epidemiological studies have associated high intake of EPA and DHA with a lower cardiovascular mortality, especially for cardiac diseases, than predicted, probably due to the improvements in many risk factors such as plasma levels of triglycerides, HDL-cholesterol, C-reactive protein, blood pressure, both systolic and diastolic, and heart rate.[1][27]
EPA and DHA have also been shown to be useful in the treatment of diseases such as rheumatoid arthritis, and could be useful in the treatment of other inflammatory conditions such as asthma, psoriasis or inflammatory bowel disease, due to their ability to modulate many aspects of the inflammatory processes.[33]
Conversely, LC-PUFAs seem to have little or no effects on measures of glucose metabolism, such as insulin, insulin resistance, fasting glucose, and glycated haemoglobin, or on type 2 diabetes.[5]
Omega-3/Omega-6 ratio
Epidemiological studies suggest that the consumption of a diet with a low omega-3/omega-6 ratio has had a negative impact on human health, contributing to the development, together with other risk factors such as sedentary life and smoking, of the main classes of diseases.[8] Indeed, a lower incidence of cancer, autoimmunity and coronary heart disease has been observed in populations whose diet has a high omega-3/omega-6 ratio, such as Eskimos and Japanese, populations with a high fish consumption.[20][37]
Despite these evidences, Western diet has become rich in saturated fatty acids and omega-6 polyunsaturated fatty acids, and poor in omega-3 polyunsaturated fatty acids, with an omega-3/omega-6 ratio between 1:10 and 1:20, then, far from the recommended ratio of 1:5.[33]
The low value of the omega-3/omega-6 ratio is due to several factors, some of which are listed below.
Although wild plant foods are generally high in omega-3 PUFAs, crops high in omega-6 PUFAs have been much more successful in industrial agriculture than those high in omega-3 PUFAs.[3]
Low consumption of fishery products and fish oils.[33]
The high consumption of animals raised on corn-based feed, such as chickens, cattle, and pigs. Added to this is the fact that the omega-3 PUFA content of some farmed fish species is lower than that of their wild counterparts.[9]
The high consumption of oils rich in omega-6 PUFAs and poor in omega-3 PUFAs, such as safflower, sunflower, soybeans and corn oils.[4]
Note: there is no evidence that the omega-3/omega-6 ratio is important for prevention and treatment of type 2
diabetes mellitus.[5]
Effects at the molecular level of EPA and DHA
In recent years, the molecular mechanisms underlying the functional effects attributed to omega-3 polyunsaturated fatty acids, especially to EPA and DHA, are being clarified, and most of these require their incorporation into membrane phospholipids.[23]
Omega-3 PUFAs are structural components of cell membranes where they play an essential role in regulating fluidity.[35] Due to this effect, omega-3, especially EPA and DHA, can modulate cellular responses that depend upon membrane protein functions. This is particularly important in the eye, where DHA allows for optimal activity of rhodopsin, a photoreceptor protein.[29] The effect on membrane fluidity is essential for animals living in cold water, as EPA and DHA also have an antifreeze function.
EPA and DHA can modify the formation of lipid raft, microdomains with a specific lipid composition that act as platforms for receptor activities and the initiation of intracellular signaling pathways. By modifying lipid raft formation, they affect intracellular signaling pathways in different cell types, such as neurons, immune system cells, and cancer cells. In this way, EPA and DHA can modulate the activation of transcription factors, such as NF-κB, PPARs and SREBPs, and so the corresponding gene expression patterns. This is central to their role in controlling adipocyte differentiation, the metabolism of fatty acids and triacylglycerols, and inflammation.[8]
EPA, DHA, and ARA are substrates for the synthesis of bioactive lipid mediators, such as eicosanoids, that are involved in the regulation of inflammation, immunity, platelet aggregation, renal function, and smooth muscle contraction.[21] Eicosanoids produced from arachidonic acid, that is the major substrate for their synthesis, have important physiological roles, but an excessive production has been associated with numerous disease processes.[8] The increase in EPA and DHA content in membrane phospholipids is paralleled by a reduction in ARA content and associated with a decreased production of lipid mediators form ARA and an increased production of lipid mediators from the two omega-3. Moreover, among the molecules derived from EPA and DHA, there are eicosanoids analogous to those produced from ARA, but with lower activity, resolvins, and, from DHA, protectins and maresins. These molecules appear to be responsible for many of the immune-modulating and anti-inflammatory actions attributed to the omega-3 polyunsaturated fatty acids EPA and DHA.[10]
EPA and DHA can also play a role in the non-esterified form, acting directly through receptors coupled to G proteins, modulating their activity.[30]
Finally, they can reduce the intestinal absorption of omega-6 PUFAs, and, at the enzymatic level, competitively inhibit cyclooxygenase-1 or COX-1 (EC 1.14.99.1) and lipoxygenases, and compete with omega-6 PUFAs for acyltransferases.[3]
Major sources of EPA and DHA for humans
In general, fish and aquatic invertebrates, such as molluscs and crustaceans, are the major sources of EPA and DHA for humans.[3][9][36] These animals can get EPA and DHA from food, namely, from phytoplankton, or synthesize them from alpha-linolenic acid.[16] Moreover, DHA is present in high concentrations in many fish oils, too, especially those from coldwater fish. However, it should be underscored that such oils are also high in saturated fatty acids.[24] For those who do not eat fishery products, good sources of omega-3 LC-PUFAs are the liver of terrestrial animals and several birds of the order Passeriformes.[14][15]
Regarding the recommended intake of omega-3 polyunsaturated fatty acids, it is not yet clear what it is. The following table shows the values suggested by Food and Agriculture Organization (FAO) of the United Nations and the European Food Safety Authority (EFSA).[11][12]
Population subgroup
Recommendation
FAO
Adult males and non-pregnant or non-lactating adult females
Minimum of 250 mg EPA + DHA daily
FAO
Pregnant or lactating females
Minimum of 300 mg EPA + DHA daily of which at least 200 mg should be DHA
FAO
Children aged 2-4 years
100-150 mg EPA + DHA daily
FAO
Children aged 4-6 years
150-200 mg EPA + DHA daily
FAO
Children aged 6-10 years
200-250 mg EPA + DHA daily
EFSA
Adult males and non-pregnant adult females
Adequate intake is 250 mg EPA + DHA
daily
EFSA
Pregnant females
An additional 100-200 mg DHA daily
EFSA
Infants and children aged 6 months to 2 years
100 mg DHA daily
EFSA
Children aged 2-18 years
‘‘Consistent with adults’’
Omega-3 and culinary treatments
As omega-3 polyunsaturated fatty acids are particularly susceptible to oxidation due to heating, cooking and other culinary treatments could reduce their content.[3] However, this is only partially true. In food, EPA and DHA are not in free form but mainly esterified into membrane phospholipids and, in such form, are much less susceptible to oxidation.[9]
Considering the content of EPA and DHA, to express it as a percentage of the total fatty acids instead of as absolute content, namely, mg/g wet weight, leads to erroneous conclusions. For example, a fatty fish like salmon has a high EPA + DHA content, ~8 mg/g wet weight, and expressed as a percentage of the total fatty acids ~20 percent; conversely Atlantic code has a low EPA + DHA content, ~3 mg/g of wet weight, but, if expressed as a percentage of the total fatty acids ~40 percent. Atlantic code has a high percentage of EPA + DHA because is a lean fish, whereas in fatty fish EPA + DHA content is diluted by the high fatty acid content of the adipose tissue of the animal.[17]
And when EPA + DHA content is expressed in mg/g of product, no decrease in LC-PUFAs content is observed following most common culinary treatments.[16]
References
^ ab AbuMweis S., Jew S., Tayyem R. Agraib L. Eicosapentaenoic acid and docosahexaenoic acid containing supplements modulate risk factors for cardiovascular disease: a meta-analysis of randomised placebo-control human clinical. J Hum Nutr Diet 2018;31(1):67-84. doi:10.1111/jhn.12493
^ Ahlgren G., Lundstedt L., Brett M., Forsberg C. Lipid composition and food quality of some freshwater phytoplankton for cladoceran zooplankters. J Plankton Res 1990;12(4):809-18. doi:10.1093/plankt/12.4.809
^ abcdefg Akoh C.C. and Min D.B. Food lipids: chemistry, nutrition, and biotechnology. 3th ed. 2008
^ Blasbalg T.L., Hibbeln J.R., Ramsden C.E., Majchrzak S..F, Rawlings R.R. Changes in consumption of omega-3 and omega-6 fatty acids in the United States during the 20th century. Am J Clin Nutr 2011;93(5):950-62. doi:10.3945/ajcn.110.006643
^ ab Brown T.J., Brainard J., Song F., Wang X., Abdelhamid A., Hooper L. Omega-3, omega-6, and total dietary polyunsaturated fat for prevention and treatment of type 2 diabetes mellitus: systematic review and meta-analysis of randomised controlled trials. BMJ 2019;366:l4697. doi:10.1136/bmj.l4697
^ abc Buckley M.T., Racimo F., Allentoft M.E., et al. Selection in Europeans on fatty acid desaturases associated with dietary changes. Mol Biol Evol 2017;34(6):1307-1318. doi:10.1093/molbev/msx103
^ ab Burdge G.C., Wootton S.A. Conversion of α-linolenic acid to eicosapentaenoic, docosapentaenoic and docosahexaenoic acids in young women. Br J Nutr 2002;88(4):411-420. doi:10.1079/BJN2002689
^ abcdef Calder P.C. Very long-chain n-3 fatty acids and human health: fact, fiction and the future. Proc Nutr Soc 2018 77(1):52-72. doi:10.1017/S0029665117003950
^ abcdefgh Chow Ching K. Fatty acids in foods and their health implication. 3th ed. 2008
^ ab Duvall M.G., Levy B.D. DHA- and EPA-derived resolvins, protectins, and maresins in airway inflammation. Eur J Pharmacol 2016;785:144-155. doi:10.1016/j.ejphar.2015.11.001
^ EFSA Panel on Dietetic Products, Nutrition, and Allergies (NDA). Scientific opinion on dietary reference values for fats, including saturated fatty acids, polyunsaturated fatty acids, monounsaturated fatty acids, trans fatty acids, and cholesterol. 2010. doi:10.2903/j.efsa.2010.1461
^ FAO. Global recommendations for EPA and DHA intake (As of 30 June 2014)
^ Fumagalli M., Moltke I., Grarup N., Racimo F., Bjerregaard P., Jørgensen M.E., Korneliussen T.S., Gerbault P., Skotte L., Linneberg A., Christensen C., Brandslund I., Jørgensen T., Huerta-Sánchez E., Schmidt E.B., Pedersen O., Hansen T., Albrechtsen A., Nielsen R.. Greenlandic Inuit show genetic signatures of diet and climate adaptation. Science 2015;349(6254):1343-7. doi:10.1126/science.aab2319
^ Gladyshev M.I., Makhutova O.N., Gubanenko G.A.; Rechkina E.A., Kalachova G.S., Sushchik N.N. Livers of terrestrial production animals as a source of long-chain polyunsaturated fatty acids for humans: an alternative to fish? Eur J Lipid Sci Technol 2015;117:1417-1421. doi:10.1002/ejlt.201400449
^ Gladyshev M.I., Popova O.N., Makhutova, O.N., Zinchenko, T.D., Golovatyuk, L.V., Yurchenko, Y.A., Kalachova, G.S., Krylov, A.V., Sushchik, N.N. Comparison of fatty acid compositions in birds feeding in aquatic and terrestrial ecosystems. Contemp Probl Ecol 2016;9:503-513. doi:10.1134/S1995425516040065
^ abcd Gladyshev M.I. and Sushchik N.N. Long-chain omega-3 polyunsaturated fatty acids in natural ecosystems and the human diet: assumptions and challenges. Biomolecules 2019;9(9):485. doi:10.3390/biom9090485
^ Gladyshev M.I., Sushchik N.N., Tolomeev A.P., Dgebuadze Y.Y. Meta-analysis of factors associated with omega-3 fatty acid contents of wild fish. Rev Fish Biol Fish 2018;28,:277-299. doi:10.1007/s11160-017-9511-0
^ Kim H-Y. Novel metabolism of docosahexaenoic acid in neural cells. J Biol Chem 2007;282(26):18661-18665. doi:10.1074/jbc.R700015200
^ Kouba M., Mourot J. A review of nutritional effects on fat composition of animal products with special emphasis on n-3 polyunsaturated fatty acids. Biochimie 2011;93(1):13-7. doi:10.1016/j.biochi.2010.02.027
^ Kromann N., Green A. Epidemiological studies in the Upernavik district, Greenland. Incidence of some chronic diseases 1950-1974. Acta Med Scand 1980;208(5):401-6. doi:10.1111/j.0954-6820.1980.tb01221.x
^ Lauritzen L., Hansen H.S., Jørgensen M.H., Michaelsen K.F. The essentiality of long chain n-3 fatty acids in relation to development and function of the brain and retina. Prog Lipid Res 2001;40(1-2):1-94. doi:10.1016/s0163-7827(00)00017-5
^ ab Lee J.M., Lee H., Kang S. and Park W.J. Fatty acid desaturases, polyunsaturated fatty acid regulation, and biotechnological advances. Nutrients 2016;8(1):23. doi:10.3390/nu8010023
^ Mason R.P., Sherratt S.C.R. Omega-3 fatty acid fish oil dietary supplements contain saturated fats and oxidized lipids that may interfere with their intended biological benefits. Biochem Biophys Res Commun 2017;483(1):425-429. doi:10.1016/j.bbrc.2016.12.127
^ Mathieson I., Lazaridis I., Rohland N., Mallick S., Patterson N., Roodenberg S.A., Harney E., Stewardson K., Fernandes D., Novak M., et al. Genome-wide patterns of selection in 230 ancient Eurasians. Nature 2015;528:499-503. doi:10.1038/nature16152
^ ab McCann J.C., Ames B.N. Is docosahexaenoic acid, an n-3 long-chain polyunsaturated fatty acid, required for development of normal brain function? An overview of evidence from cognitive and behavioral tests in humans and animals. Am J Clin Nutr 2005;82(2):281-95. doi:10.1093/ajcn.82.2.281
^ ab Mensink R.P., Zock P.L., Kester A.D., Katan M.B. Effects of dietary fatty acids and carbohydrates on the ratio of serum total to HDL cholesterol and on serum lipids and apolipoproteins: a meta-analysis of 60 controlled trials. Am J Clin Nutr 2003;77(5):1146-55. doi:10.1093/ajcn/77.5.1146
^ Muller-Navarra D.C. Biochemical versus mineral limitation in Daphnia. Limnol Oceanogr 1995;40:1209-1214. doi:10.4319/lo.1995.40.7.1209
^ ab Niu S.L., Mitchell D.C., Lim S.Y., Wen Z.M., Kim H.Y., Salem N. Jr, Litman B.J. Reduced G protein-coupled signaling efficiency in retinal rod outer segments in response to n-3 fatty acid deficiency. J Biol Chem 2004;279(30):31098-104. doi:10.1074/jbc.M404376200
^ Oh D.Y., Talukdar S., Bae E.J., Imamura T., Morinaga H., Fan WQ, Li P., Lu W.J., Watkins S.M., Olefsky J.M. GPR120 is an omega-3 fatty acid receptor mediating potent anti-inflammatory and insulin-sensitizing effects. Cell 2010 142(5):687-698. doi:10.1016/j.cell.2010.07.041
^ Popova O.N., Haritonov A.Y., Sushchik N.N., Makhutova O.N., Kalachova G.S., Kolmakova A.A., Gladyshev M.I. Export of aquatic productivity, including highly unsaturated fatty acids, to terrestrial ecosystems via Odonata. Sci Total Environ 2017;581-582:40-48. doi:10.1016/j.scitotenv.2017.01.017
^ Salem N. Jr, Litman B., Kim H.Y., Gawrisch K. Mechanisms of action of docosahexaenoic acid in the nervous system. Lipids 2001;36(9):945-59. doi:10.1007/s11745-001-0805-6
^ abcd Simopoulos A.P. The importance of the omega-6/omega-3 fatty acid ratio in cardiovascular disease and other chronic diseases. Exp Biol Med 2008;233(6):6746-88. doi:10.1016/S0753-3322(02)00253-6
^ Smith W., Mukhopadhyay R. Essential fatty acids: the work of George and Mildred Burr. J Biol Chem 2012;287(42):35439-35441. doi:10.1074/jbc.O112.000005
^ ab Stubbs C.D., Smith A.D. The modification of mammalian membrane polyunsaturated fatty acid composition in relation to membrane fluidity and function. Biochim Biophys Acta 1984;779(1):89-137. doi:10.1016/0304-4157(84)90005-4
^ abc Tocher D.R., Betancor M.B., Sprague M., Olsen R.E., Napier J.A. Omega-3 long-chain polyunsaturated fatty acids, EPA and DHA: bridging the gap between supply and demand. Nutrients 2019;11(1):89. doi:10.3390/nu11010089
^ Yano K., MacLean C.J., Reed D.M., Shimizu Y., Sasaki H., Kodama K., Kato H., Kagan A. A comparison of the 12-year mortality and predictive factors of coronary heart disease among Japanese men in Japan and Hawaii. Am J Epidemiol 1988;127(3):476-87. doi:10.1093/oxfordjournals.aje.a114824
^ Williams C.M., Burdge G. Long-chain n-3 PUFA: plant v. marine sources. Proc Nutr Soc 2006;65(1):42-50. doi:10.1079/pns2005473
Essential fatty acids or EFAs are unsaturated fatty acids that cannot be synthesized by animals, and, like other essential nutrients, must be obtained from the diet. They are linoleic acid and alpha-linolenic acid.
Animals cannot synthesize the two fatty acids due to the lack of delta-12 desaturase (E.C. 1.14.19.6) and delta-15 desaturase (EC 1.14.19.25).[1][9][15] These enzymes introduce cis double bonds beyond carbon 9, and are present in plants and some microorganisms such as some bacteria, fungi and molds.[10]
Delta-12 desaturase catalyzes the synthesis of linoleic acid from oleic acid, by introducing a double bond at delta-12 position, namely, between carbons 6 and 7 from the methyl end of the fatty acid.[15]
Delta-15 desaturase or omega-3 desaturase or fatty acid desaturase 3 catalyzes the synthesis of alpha-linolenic acid from linoleic acid by introducing a double bond at delta-15 position, namely, between carbons 3 and 4 from the methyl end of the fatty acid. The enzyme is only present in the plastids and in the endoplasmic reticulum of phytoplankton and vascular terrestrial plants.[1][9]
Synthesis of EFAs
Linoleic acid and alpha-linolenic acid are the precursors to omega-6 polyunsaturated fatty acids and omega-3 polyunsaturated fatty acids. In the absence of dietary EFAs, a rather rare condition, the other omega-3 and omega-6 fatty acids become essential, too. For this reason, these lipids are defined by some as conditionally essential fatty acids.[9]
It should be pointed out that all essential fatty acids are polyunsaturated fatty acids, but not all polyunsaturated fatty acids are essential, such as those belonging to the omega-7 and omega-9 families.
The first evidence of the existence of essential fatty acids dates back to 1918, when Hans Aron suggested that dietary fat could be essential for the healthy growth of animals and that, in addition to their caloric contribution, there was a inherent nutritive value due to the presence of certain lipid molecules.[2]
In 1927, Herbert M. Evans and George Oswald Burr demonstrated that, despite the addition of vitamins A, D, and E to the diet, a deficiency of fat severely affected both growth and reproduction of experimental animals. Therefore, they suggested the presence of an essential substance in the fat that they called vitamin F.[11]
Eleven years after Aron work, in 1929, Burr and his wife Mildred Lawson hypothesized that warm-blooded animals were not able to synthesize appreciable amounts of certain fatty acids.[7] One year later, they discovered that linoleic acid was essential for animals, and it was they who coined the term essential fatty acid.[8][19] However, EFA deficiency in humans was first described by Arild Hansen only in 1958, in infants fed a milk-based formula lacking them.[14]
And in 1964, thanks to the research of Van Dorp and Bergstroem, one of their biological functions was discovered: being the precursors for the synthesis of prostaglandins.[3][21]
Role
Essential fatty acids play important biological functions.
Linoleic acid and alpha-linolenic acid can be used as an energy source through beta-oxidation.[22]
Linoleic acid and alpha-linolenic acid are the precursors to omega-6 polyunsaturated fatty acids and omega-3 polyunsaturated fatty acids. Indeed, many animals, including humans, can synthesize, although with variable efficiency, the other omega-3 and omega-6 polyunsaturated fatty acids, for example arachidonic acid, eicosapentaenoic acid, and docosahexaenoic acid.[5][6][18]
Essential fatty acids are structural components of cellular membranes, modulating, for example, their fluidity.[20][22]
They are essential in the skin, especially linoleic acid in sphingolipids of the stratum corneum, where they contribute to the formation of the barrier against water loss.[23]
They have a crucial role in the prevention of many diseases, particularly coronary heart disease.[12][16]
Food sources
Linoleic acid is the most abundant polyunsaturated fatty acid in the Western diet, and accounts for 85-90 percent of dietary omega-6 polyunsaturated fatty acids.[13] The richest dietary sources are vegetable oils and seeds of many plants.[4]
Food sources
Linoleic acid (mg/g)
Safflower oil
∼ 740
Sunflower oil
∼ 600
Soybean oil
∼ 530
Corn oil
∼ 500
Cottonseed oil
∼ 480
Walnuts
∼ 340
Brazil nuts
∼ 250
Peanut oil
∼ 240
Rapeseed oil
∼ 190
Peanuts
∼ 140
Flaxseed oil
∼ 135
Linoleic acid is present in fair amounts also in animal products such as chicken eggs or lard, because it is present in their feed.[9]
It should be noted that some of the major sources of linoleic acid, such as walnuts, flaxseed oil, soybean oil, and rapeseed oil are also high in alpha-linolenic acid.[17]
Some of the richest dietary sources of alpha-linolenic acid are flaxseed oil, ~ 550 mg/g, rapeseed oil, ~ 85 mg/g, and soybean oil, ~ 75 mg/g. Other foods rich in alpha-linolenic acid include nuts, ~ 70 mg/g, and soybeans, ~ 10 mg/g.[1]
References
^ abc Akoh C.C. and Min D.B. Food lipids: chemistry, nutrition, and biotechnology. 3th Edition. CRC Press, Taylor & Francis Group, 2008
^ Aron H. Uber den Nahrwert. Biochem Z 1918; 92: 211-33
^ Bergstroem S., Danielsson H., Klenberg D., Samuelsson B. The enzymatic conversion of essential fatty acids into prostaglandins. J Biol Chem 1964;239:PC4006-8. doi:10.1016/S0021-9258(18)91234-2
^ Blasbalg T. L., Hibbeln J. R., Ramsden C. E., Majchrzak S. F. & Rawlings R. R. Changes in consumption of omega-3 and omega-6 fatty acids in the United States during the 20th century. Am J Clin Nutr 2011;93(5):950-962. doi:10.3945/ajcn.110.006643
^ Burdge G.C, Jones A.E, Wootton S.A. Eicosapentaenoic and docosapentaenoic acids are the principal products of α-linolenic acid metabolism in young men. Br J Nutr 2002;88(4):355-364. doi:10.1079/BJN2002662
^ Burdge G.C., Wootton S.A. Conversion of α-linolenic acid to eicosapentaenoic, docosapentaenoic and docosahexaenoic acids in young women. Br J Nutr 2002;88(4):411-420. doi:10.1079/BJN2002689
^ Burr G. and Burr M. A new deficiency disease produced by the rigid exclusion of fat from the diet. J Biol Chem 1929;82:345-367. doi:10.1016/S0021-9258(20)78281-5
^ Burr G.O., Burr M.M., Miller E.S. On the fatty acids essential in nutrition. III. J Biol Chem 1932;97(1):1-9. doi:10.1016/S0021-9258(18)76213-3
^ abcd Chow Ching K. Fatty acids in foods and their health implication. 3th Edition. CRC Press, Taylor & Francis Group, 2008
^ Das U.N. Essential fatty acids: biochemistry, physiology and pathology. Biotechnol J 2006;1;420-439. doi:10.1002/biot.200600012
^ Evans H. M. and G. O. Burr. A new dietary deficiency with highly purified diets. III. The beneficial effect of fat in the diet. Proc Soc Exp Biol Med 1928;25:390-397. doi:10.3181/00379727-25-3867
^ Farvid M.S., Ding M., Pan A., Sun Q., Chiuve S.E., Steffen L.M., Willett W.C., Hu F.B. Dietary linoleic acid and risk of coronary heart disease: a systematic review and meta-analysis of prospective cohort studies. Circulation 2014;130:1568-1578. doi:10.1161/CIRCULATIONAHA.114.010236
^ Guyenet S.J., Carlson S.E. Increase in adipose tissue linoleic acid of US adults in the last half century. Adv Nutr 2015;6(6):660-664. doi:https://DOI.org/10.3945/an.115.009944
^ Hansen A.E., Haggard M.E., Boelsche A.N., Adam D.J., Wiese H.F. Essential fatty acids in infant nutrition. III. Clinical manifestations of linoleic acid deficiency. J Nutr 1958;66(4):565-76. doi:10.1093/jn/66.4.565
^ ab Malcicka M., Visser B., Ellers J. An evolutionary perspective on linoleic acid synthesis in animals. Evol Biol 2018;45:15-26. doi:10.1007/s11692-017-9436-5
^ Mensink R.P., Zock P.L., Kester A.D., Katan M.B. Effects of dietary fatty acids and carbohydrates on the ratio of serum total to HDL cholesterol and on serum lipids and apolipoproteins: a meta-analysis of 60 controlled trials. Am J Clin Nutr 2003;77(5):1146-55. doi:10.1093/ajcn/77.5.1146
^ Rajaram S. Health benefits of plant-derived α-linolenic acid. Am J Clin Nutr 2014;100 Suppl 1:443S-8S. doi:10.3945/ajcn.113.071514
^ Rett B.S., Whelan J. Increasing dietary linoleic acid does not increase tissue arachidonic acid content in adults consuming Western-type diets: a systematic review. Nutr Metab (Lond) 2011;8:36. doi:10.1186/1743-7075-8-36
^ Smith W., Mukhopadhyay R. Essential fatty acids: the work of George and Mildred Burr. J Biol Chem 2012;287(42):35439-35441. doi:10.1074/jbc.O112.000005
^ Stubbs C.D., Smith A.D. The modification of mammalian membrane polyunsaturated fatty acid composition in relation to membrane fluidity and function. Biochim Biophys Acta 1984;779(1):89-137. doi:10.1016/0304-4157(84)90005-4
^ Van Dorp D.A., Beerthuis R.K., Nugteren D.H. and Vonkeman H. Enzymatic conversion of all-cis-polyunsaturated fatty acids into prostaglandins. Nature 1964;203:839-841. doi:10.1038/203839a0
^ ab Whelan J. and Fritsche K. Linoleic acid. Adv Nutr 2013;4(3): 311-312. doi:10.3945/an.113.003772
^ Ziboh V.A. Prostaglandins, leukotrienes, and hydroxy fatty acids in epidermis. Semin Dermatol 1992;11(2):114-20
Invert sugar, also known as inverted sugar, is sucrose partially or totally cleaved into fructose and glucose and, apart from the chemical process used, the obtained solution has the same amount of the two carbohydrates.
Moreover, according to the product, not cleaved sucrose may also be present.
Invert sugar production
The breakdown of sucrose may happen in a reaction catalyzed by enzymes, such as:
sucrase-isomaltase (EC 3.2.1.48), actives at our own intestinal level where it is involved in carbohydrate digestion;
invertase, an enzyme secreted by honeybees into the honey and used industrially to obtain invert sugar.
Another process applies acid action, as it happens partly in our own stomach and as it happened in the old times, and still happens, at home-made and industrial level. Sulfuric and hydrochloric acids was used, heating the solution with caution for some time; in fact the reaction is as fast as the solution is acid, regardless of the type of acid used, and as higher the temperature is. The acidity is then reduced or neutralized with alkaline substances, as soda or sodium bicarbonate.
A chemical process as described occurs when acid foods are prepared; i.e. in the preparation of jams and marmalades, where both conditions of acidity, naturally, and high temperatures, by heating, are present. The situation is analogous when fruit juices are sweetened with sucrose.
The reaction develops at room temperature as well, obviously more slowly.
What is the practical outcome of that?
It means that, during storage, also sweets and acid foods, even those just seen, go towards a slow reaction of inversion of contained/residue sucrose, with consequent modification of the sweetness, since invert sugar at low temperatures is sweeter (due to the presence of fructose), and assumption of a different taste profile.
Properties and uses
It is principally utilized in confectionery and ice-cream industries thanks to some peculiar characteristics.
It has an higher affinity for water (hydrophilicity) than sucrose (see fructose) therefore it keeps food more humid: e.g. cakes made with invert sugar dry up less easily.
It avoids or slows down crystal formation (dextrose and fructose form less crystals than sucrose), property useful in confectionery industries for icings and coverage.
It has a lower freezing point.
It increases, just a bit, the sweetness of the product in which it has been added, as it is sweeter than an equal amount of sucrose (the sweetness of fructose depends on the temperature in which it is present).
It may take part to Maillard reaction (sucrose can’t do it) thus contributing to the color and taste of several bakery products.
It should be noted that honey, lacking in sucrose, has a fructose and glucose composition almost equal to that of 100% invert sugar (fructose is slightly more abundant than glucose). So, diluted honey, better if not much aromatic, may replace industrial invert sugar.
References
Belitz .H.-D., Grosch W., Schieberle P. “Food Chemistry” 4th ed. Springer, 2009
Bender D.A. “Benders’ Dictionary of Nutrition and Food Technology”. 8th Edition. Woodhead Publishing. Oxford, 2006
Jordan S. Commercial invert sugar. Ind Eng Chem 1924;16(3):307-310. doi:10.1021/ie50171a037
Stipanuk M.H., Caudill M.A. Biochemical, physiological, and molecular aspects of human nutrition. 3rd Edition. Elsevier health sciences, 2012
Biochemistry, metabolism, and nutrition
Manage your privacy
To provide the best experiences, we and our partners use technologies like cookies to store and/or access device information. Consenting to these technologies will allow us and our partners to process personal data such as browsing behavior or unique IDs on this site and show (non-) personalized ads. Not consenting or withdrawing consent, may adversely affect certain features and functions.
Click below to consent to the above or make granular choices. Your choices will be applied to this site only. You can change your settings at any time, including withdrawing your consent, by using the toggles on the Cookie Policy, or by clicking on the manage consent button at the bottom of the screen.
Funzionale
Always active
L'archiviazione tecnica o l'accesso sono strettamente necessari al fine legittimo di consentire l'uso di un servizio specifico esplicitamente richiesto dall'abbonato o dall'utente, o al solo scopo di effettuare la trasmissione di una comunicazione su una rete di comunicazione elettronica.
Preferenze
L'archiviazione tecnica o l'accesso sono necessari per lo scopo legittimo di memorizzare le preferenze che non sono richieste dall'abbonato o dall'utente.
Statistiche
L'archiviazione tecnica o l'accesso che viene utilizzato esclusivamente per scopi statistici.L'archiviazione tecnica o l'accesso che viene utilizzato esclusivamente per scopi statistici anonimi. Senza un mandato di comparizione, una conformità volontaria da parte del vostro Fornitore di Servizi Internet, o ulteriori registrazioni da parte di terzi, le informazioni memorizzate o recuperate per questo scopo da sole non possono di solito essere utilizzate per l'identificazione.
Marketing
L'archiviazione tecnica o l'accesso sono necessari per creare profili di utenti per inviare pubblicità, o per tracciare l'utente su un sito web o su diversi siti web per scopi di marketing simili.
 Keto acids, and in particular alpha-keto acids, are very important in biochemistry, being involved in many metabolic pathways.
 The enzyme, like
 Age-related risk is a function of variables such as weight gain, low physical activity, excessive use of salt, fats and
 PTST1 appears to associate, in the plastid stoma, with GBSS. The complex binds to the nascent starch granule, the protein dissociates from the enzyme, that begins to catalyze the elongation of the malto-oligosaccharides, while the protein returns to the stroma where it recruits another GBSS.
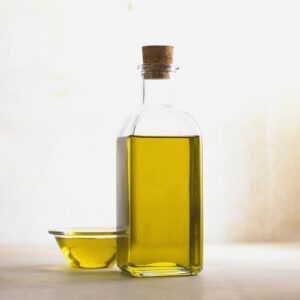 Being the major source of lipids, when associated with a low consumption of high fat animal products, it ensures a high ratio of monounsaturated to
  The few branches are connected to the linear chain by α-(1→6) glycosidic bonds, such as in amylopectin and
 Note: in Nature, D-sugars are much more abundant than L-sugars.
 In the case of a C=Y double bond, one Y atom is attached to the carbon atom, and one carbon atom is attached to the Y atom.
 Consider carbon 2. The order of priority of the groups is –OH > –CH2OHCH3 > –CH3 > –H. Rotate the molecule so that the hydrogen, the lowest priority group, is pointed away from the viewer. Tracing a path from –OH, the highest priority group, to –CH3, the lowest priority group, we move in a clockwise direction: the configuration of the carbon 2 is, therefore, R. Applying the same procedure to carbon 3, its configuration is R. Then, the enantiomer shown in figure is (2R,3R)-2,3-butanediol.
 The distomer, the S enantiomer, could cause serious birth defects, particularly phocomelia. This is probably the most striking example of the importance of the chiral properties of molecules, which prompted health care organizations to promote the synthesis of drugs, including thalidomide, containing a single enantiomer by the pharmaceutical industry.
 At room temperature, nitrogen rapidly inverts its configuration. The phenomenon is known as nitrogen inversion, namely, a rapid oscillation of the atom and its ligands, during which nitrogen passes through a planar sp2-hybridized transition state. As a consequence, if the nitrogen atom is the only chiral center of the molecule, there is no optical activity because a racemic mixture exists. The inversion of configuration does not occur only in some cases in which nitrogen is part of a cyclic structure that prevents it. Therefore, the presence of a chiral center could be not sufficient to allow the separation of the respective enantiomers.
 In this case, chirality is due to the presence of an axis of chirality.
 Note: the word chirality derives from the Greek cheiros, meaning “hand”.
 And one of the factors limiting the rate of an enzymatic reaction is just the frequency with which substrates and enzymes collide. The simplest way to increase the frequency of collisions would be to increase the concentration of substrates and enzymes. However, due to the large number of different reactions that take place in the cell, this route is not feasible. In other words, there is a limit to the concentration that substrates and enzymes can reach, concentrations that are in the micromolar range for substrates, and even lower for enzymes. Exceptions are the enzymes of
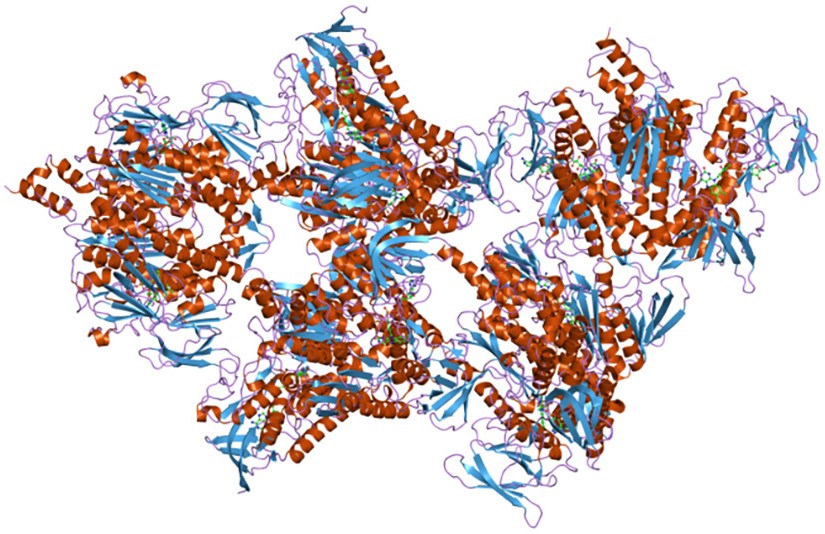
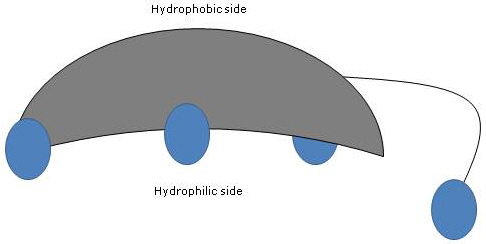
 Below we will analyze the energy expenditure of runners engaged in workouts on various distances, the amounts of
 The consumption limited to these quantities must be obtained by intake of drinks with low ethanol content, preferably at meals (drinking even lightly to moderately outside of meals increases the probability to have hypertension). This means no more than 680 ml or 24 oz of regular beer or 280 ml or 10 oz of wine (12% ethanol), especially in hypertension; for women and thinner subjects consumption should be halved1.

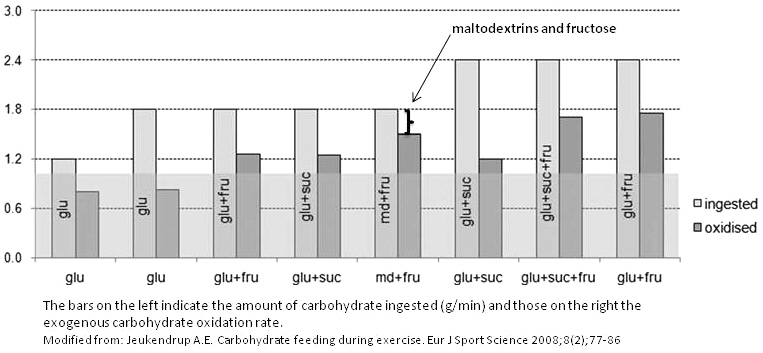
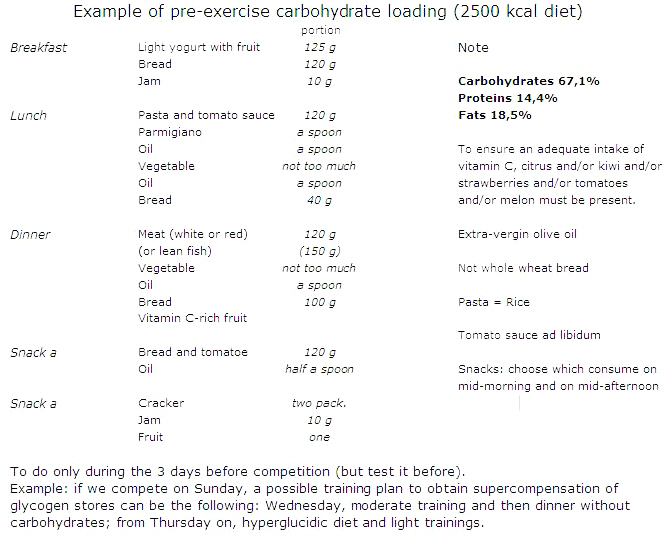
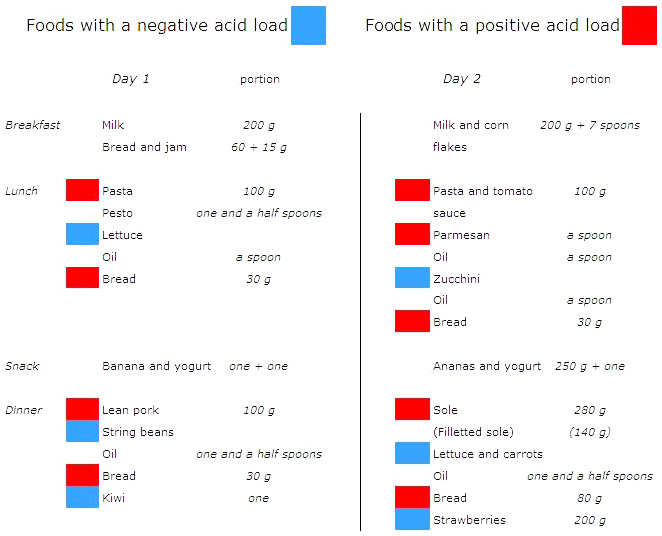
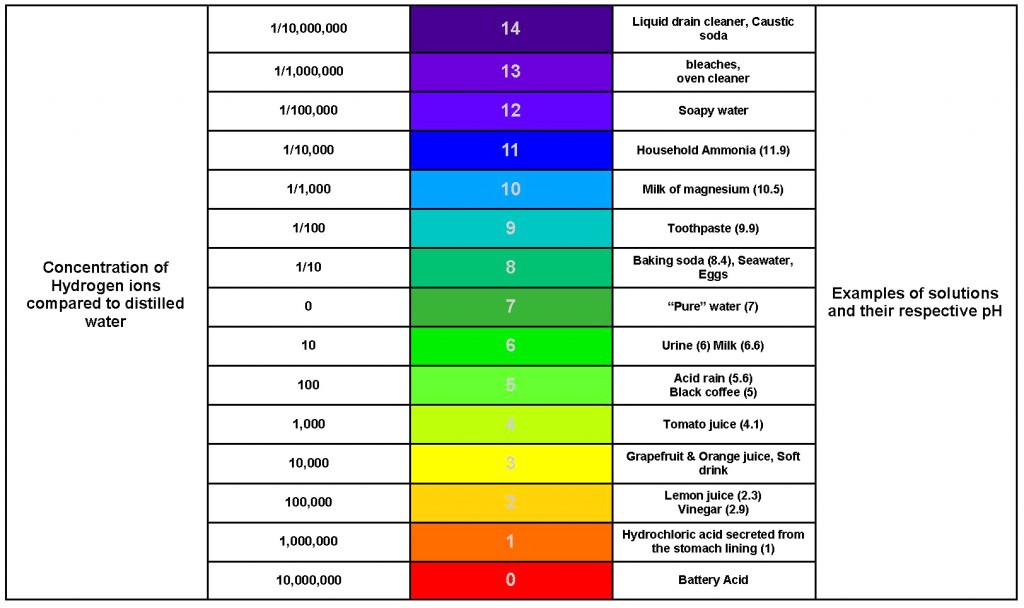
 Then, glucose can diffuse from the hepatocyte, via a transporter into the plasma membrane called GLUT2, into the bloodstream to be delivered to extra-hepatic cells, in primis neurons and red blood cells for which it is the main, and for red blood cells the only energy source (neurons, with the exception of those in some brain areas that can use only glucose as energy source, can derive energy from another source, the ketone bodies, which becomes predominant during periods of prolonged fasting).