Nutrition is a key factor in maintaining good health throughout life.
Eating a balanced diet, starting from birth with breastfeeding, and continuing through childhood, adolescence, and adulthood, helps achieve and maintain a healthy state. When combined with a healthy lifestyle, it contributes to the prevention of many chronic diseases, such as cardiovascular diseases, osteoporosis, type II diabetes, and various types of cancer, which are becoming increasingly common today.
It is also important to highlight the connection between nutrition and the gut microbiota, the community of microorganisms that colonize the intestine. Diet appears to be the main factor influencing its composition, beginning with breast milk.
Proper nutrition is essential even in the presence of food allergies, such as in celiac disease, a condition in which all foods containing gluten must be permanently avoided.
Good nutrition is also crucial for athletes. When combined with appropriate training, it enhances performance in all sports.
Among the different dietary models, the Mediterranean diet is considered one of the healthiest. This pattern gained international scientific attention in the 1950s thanks to the work of Ancel Keys, an American physiologist. The Mediterranean diet is rich in plant-based foods such as extra virgin olive oil, vegetables, legumes, and whole grains, and low in red meats, processed meats, and high-fat dairy products. It ensures a good intake of fiber and compounds with anti-inflammatory and antioxidant properties, while keeping saturated fat consumption low.
Hypertension is defined as a mean resting arterial pressure of 140/90 mm Hg or higher and/or current use of antihypertensive drugs.
It is the most common public health problem in developed countries. Often referred to as the “silent killer”, as affected individuals may be asymptomatic for many years and then suffer a fatal heart attack, it is a major risk factor for developing coronary artery disease, myocardial infarction, heart failure, stroke, and a leading cause of morbidity and mortality. However, among the risk factors for cardiovascular disease, it is the most modifiable.
It is often classified as primary or essential hypertension and secondary hypertension.
Primary hypertension, responsible for about 95 percent of cases, is probably the consequence of environmental factors, genetic factors, and their interaction. Among the environmental factors, diet plays a central role. Among the genetic factors, interest has focused on factors influencing the blood pressure response to salt intake, and several genotypes have been identified, many of which influence the renin-angiotensin-aldosterone system or renal salt handling.
Secondary hypertension is due to other diseases, usually endocrine, such as hyperthyroidism, hyperaldosteronism, and Cushing’s syndrome.
Above-optimal blood pressure levels, not yet in the hypertensive or prehypertensive range, confers an increased risk of cardiovascular disease, as shown by the fact that nearly one-third of blood pressure-related deaths from coronary heart disease are estimated to occur in non-hypertensive individuals with systolic blood pressure of 120-139 mm Hg, or diastolic blood pressure of 80-89 mm Hg. This means that the risk of cardiovascular disease increases throughout the blood pressure range, starting from 115/75 mm Hg.
Classification of blood pressure values (mm Hg)
Category
Blood Pressure (mm Hg)
Systolic
Diastolic
Optimal
< 120
< 80
Normal
< 130
< 85
High-Normal
130 – 139
85 – 89
Grade 1 hypertension
140 – 159
90 – 99
Grade 2 hypertension
160 – 179
100 – 109
Grade 3 hypertension
≥180
≥110
Isolated systolic hypertension
≥140
≤ 90
Finally, pre-hypertensive individuals have a high risk, about 90%, of developing hypertension over time, although the transition is not inevitable.
Age-related hypertension
The prevalence of hypertension increases with increasing age, as shown by the fact that more than half of the adult population over 60 years old is hypertensive. Age-related risk is a function of variables such as weight gain, low physical activity, excessive use of salt, fats and saturated fatty acids, alcohol, hypercholesterolemia, and low intake of fruits and vegetables, rather than of aging per se. For example, studies of vegetarians living in industrialized countries have shown that such dietary habits are associated with a lower increase in blood pressure with increasing age, and with a markedly lower blood pressure compared to non-vegetarians.
Hypertension and childhood
According to a study conducted by a team of researchers from Johns Hopkins University, prevention of hypertension starts in childhood.
Furthermore, a meta-analysis on studies from diverse populations, studies published between January 1970 and July 2006, have examined the tracking of blood pressure from childhood to adulthood showing that childhood blood pressure is associated with blood pressure in later life, and that a high values in childhood are likely to help predict hypertension in adulthood.
Finally, other studies have also shown that increased blood pressure among children is related to the growing obesity epidemic.
How to prevent hypertension
A downward trend in blood pressure has been documented in the USA over the last two decades, and the adoption of healthy lifestyle have contributed to this trend.
Lifestyle modifications that effectively lower blood pressure are:
reduce the intake of salt and other forms of sodium;
follow a diet rich in fresh fruit, vegetables, complex carbohydrates and low-fat dairy products;
increase potassium intake by consuming fruit, vegetables and legumes;
lose body weight if overweight, or prevent weight gain among those who are thin;
increase physical activity of low or moderate intensity;
stop smoking;
These changes are the first line of defense in preventing high blood pressure, and need not be made one at a time: the best results are achieved when they occur simultaneously, as demonstrated by two studies in which multicomponent interventions lowered blood pressure in hypertensive and nonhypertensive individuals.
Finally, it has been demonstrated that there is also a relationship between alcohol and hypertension.
Role of potassium intake
Potassium, an essential nutrient for humans, is the most abundant cation in intracellular fluids. It is therefore widely distributed in foods that come from living tissues, both animal and vegetable, but which have not undergone salting and/or drying. Cooking methods tend to lower the amount of potassium, as well.
Considering vegetables, the worst cooking method is boiling in plenty of water, for more than an hour, whereas the best is microwave cooking.
Potassium content (mg/100 g) in selected food categories: classification and sources
Potassium content
Category
Examples
>250
Legumes
Chickpeas, beans (dried and fresh), lentils, peas, soybeans
Fresh or preserved (latter should be limited due to high sodium content)
A high dietary potassium intake and blood pressure are inversely correlated, as demonstrated by animal studies, observational epidemiological studies, clinical trials, controlled feeding studies, such as the DASH Study and the OmniHeart trial, and meta-analysis. Furthermore, a high potassium intake also increases urinary sodium excretion.
The optimal strategy for increasing potassium intake is to consume foods naturally rich in the mineral, such as seasonal fruit and vegetables, and legumes, typical foods of the Mediterranean diet. It is therefore not difficult to reach the recommended daily intake, for the healthy population, equal to 4.7 g per day.
Role of sodium intake
Sodium is the most abundant cation in extracellular fluids, of which it strongly affects the osmotic pressure values.
There are three main source of sodium.
The most intuitive source is table salt, which represents up to 20 percent of the daily intake. It is important to note the terms salt and sodium are often used interchangeably, but this is incorrect. On a weight basis, salt is 40 percent sodium and 60 percent chlorine.
A second source is salt or sodium compounds added during food preparation or processing. Between 35 to 80 percent of the daily sodium intake comes from processed foods such as:
The third source is negligible, namely, the sodium naturally present in foods, generally low in fresh foods.
A high sodium intake contributes to the increase in blood pressure and the development of hypertension. This is supported by many epidemiological, animal, and migration studies, and meta-analysis, with the final evidence coming from carefully controlled dose-response studies. Furthermore, in primitive societies, where sodium intake is very low, people rarely develop hypertension, and blood pressure does not increase with increasing age.
Therefore, a reduction in sodium intake is recommended to prevent the development of hypertension. In view of the available food supply and the high daily sodium intake, a reasonable recommendation may be to limit its intake to 2.3 g per day, equal to 5.8 g per day of salt. How can this level be achieved?
Using as little salt as possible when preparing food.
Avoiding adding salt at the table.
Avoiding highly salted, processed foods.
Clinical studies have documented that a reduced sodium intake is able to lower blood pressure even the setting of antihypertensive therapy, and can facilitate hypertension control.
Some components of the diet may modify the blood pressure response to sodium. A high dietary intake of foods rich in potassium and calcium may prevent or attenuate the increase in blood pressure for a given increase in sodium intake. Conversely, some data, mainly observed in animal models, suggest that a high sucrose intake could enhance salt sensitivity of blood pressure.
Note: high sodium intakes may contribute to the development of osteoporosis by increasing renal calcium excretion, particularly if daily calcium intake is low.
Role of body weight
Body weight, especially overweight and obesity, is a determinant of blood pressure at any age. Indeed:
it has been estimated that the risk of developing high blood pressure is two to six times greater in overweight people than in normal weight people;
there is a linear correlation between blood pressure and body weight or body mass index, which, if greater than 27, correlates with an increase in blood pressure;
even when sodium intake is held constant, the correlation between change in weight and change in blood pressure is linear;
60 percent of hypertensive subjects are more than 20 percent overweight;
the central distribution of body fat, as a determinant of blood pressure, with a waist circumference greater than 88 cm in women and 102 in men, is more important than the peripheral distribution of fat, both in men and women;
weight loss, in both hypertensive and normotensive subjects, may reduce blood pressure, and the reduction occurs before, and without, achieving a desirable body weight.
Role of physical activity
Physical activity produces a drop in systolic and diastolic blood pressure. Therefore, for the primary prevention of hypertension, it is important to increase physical activity of low or moderate intensity for 30-45 minutes 3-4 times a week up to an hour most days, as recommended by the World Health Organization. Conversely, less active people are 30 to 50 percent more likely to develop hypertension than active people.
References
Appel L.J., Brands M.W., Daniels S.R., Karanja N., Elmer P.J. and Sacks F.M. Dietary approaches to prevent and treat HTN: a scientific statement from the American Heart Association. Hypertension 2006;47:296-08. doi:10.1161/01.HYP.0000202568.01167.B6
Bibbins-Domingo K., Chertow G.M., Coxson P.G., Moran A., Lightwood J.M., Pletcher M.J., and Goldman L. Projected effect of dietary salt reductions on future cardiovascular disease. N Engl J Med 2010;362:590-9. doi:10.1056/NEJMoa0907355
Cappuccio FP. Overview and evaluation of national policies, dietary recommendtions and programmes around the world aiming at reducing salt intake in the population. World Health Organization. Reducing salt intake in populations: report of a WHO forum and technical meeting. WHO Geneva 2007;1-60.
Chen J, Gu D., Jaquish C.E., Chen C., Rao D.C., Liu D., Hixson J.E., Lee Hamm L., Gu C.C., Whelton P.K. and He J. for the GenSalt Collaborative Research Group. Association between blood pressure responses to the cold pressor test and dietary sodium intervention in a chinese population. Arch Intern Med. 2008;168:1740-1746. doi:10.1001/archinte.168.16.1740
Chen X. and Wang Y. Tracking of blood pressure from childhood to adulthood. A systematic review and meta-regression analysis. Circulation 2008;117:3171-80. doi:10.1161/CIRCULATIONAHA.107.730366
Denton D., Weisinger R., Mundy N.I., Wickings E.J., Dixson A., Moisson P., Pingard A.M., Shade R., Carey D., Ardaillou R., Paillard F., Chapman J., Thillet J. & Michel J.B. The effect of increased salt intake on blood pressure of chimpanzees. Nature Med 1995;10:1009-1016. doi:10.1038/nm1095-1009
Ford E.S., Ajani U.A., Croft J.B., Critchley J.A., Labarthe D.R., Kottke T.E., Giles W.H, and Capewell S. Explaining the decrease in U.S. deaths from coronary disease, 1980-2000. N Engl J Med 2007;356:2388-98. doi:10.1056/NEJMsa053935
Geleijnse J.M., Witteman J.C., den Breeijen J.H., Hofman A., de Jong P., Pols H.A. and Grobbee D.E. Dietary electrolyte intake and blood pressure in older subjects: the Rotterdam Study. J Hyperten 1996;14:73741. doi:10.1097/00004872-199606000-00009
Gutiérrez O.M. Sodium- and phosphorus-based food additives: persistent but surmountable hurdles in the management of nutrition in chronic kidney disease. Adv Chronic Kidney Dis 2013;20(2):150-6. doi:10.1053/j.ackd.2012.10.008
Harlan W.R. and Harlan L.C. Blood pressure and calcium and magnesium intake. In: Laragh J.H., Brenner B.M., eds. Hypertension: pathophysiology, diagnosis and management. 2end ed. New York: Raven Press 1995;1143-1154
He F.J., Tan M., Ma Y., MacGregor G.A. Salt reduction to prevent hypertension and cardiovascular disease: JACC state-of-the-art review. J Am Coll Cardiol 2020;75(6):632-647. doi:10.1016/j.jacc.2019.11.055
Holmes E., Loo R.L., Stamler J., Bictash M., Yap I.K.S., Chan Q., Ebbels T., De Iorio M., Brown I.J., Veselkov K.A., Daviglus M.L., Kesteloot H., Ueshima H., Zhao L., Nicholson J.K. and Elliott P. Human metabolic phenotype diversity and its association with diet and blood pressure. Nature 2008;453:396-400. doi:10.1038/nature06882
Nugroho P., Andrew H., Kohar K., Noor C.A., Sutranto A.L. Comparison between the world health organization (WHO) and international society of hypertension (ISH) guidelines for hypertension. Ann Med 2022;54(1):837-845. doi:10.1080/07853890.2022.2044510
Sesso H.D., Cook N.R., Buring J.E., Manson J.E. and Gaziano J.M. Alcohol consumption and the risk of hypertension in women and men. Hypertension 2008;51:1080-1087. doi:10.1161/HYPERTENSIONAHA.107.104968
Simpson F.O. Blood pressure and sodium intake. In: Laragh J.H., Brenner B.M. eds. Hypertension: pathophysiology, diagnosis and management. 2end ed. New York: Raven Press 1995;273-281
Stone M.S., Martyn L., Weaver C.M. Potassium intake, bioavailability, hypertension, and glucose control. Nutrients 2016;8(7):444. doi:10.3390/nu8070444
Strazzullo P., D’Elia L., Kandala N. and Cappuccio F.P. Salt intake, stroke, and cardiovascular disease: meta-analysis of prospective studies. BMJ 2009;339:b4567. doi:10.1136/bmj.b4567
Tzoulaki I., Brown I.J., Chan Q., Van Horn L., Ueshima H., Zhao L., Stamler J., Elliott P., for the International Collaborative Research Group on Macro-/Micronutrients and Blood Pressure. Relation of iron and red meat intake to blood pressure: cross sectional epidemiological study. BMJ 2008;337:a258. doi:10.1136/bmj.a258
Unger T., Borghi C., Charchar F., Khan N.A., Poulter N.R., Prabhakaran D., Ramirez A., Schlaich M., Stergiou G.S., Tomaszewski M., Wainford R.D., Williams B., Schutte A.E. 2020 International society of hypertension global hypertension practice guidelines. hypertension 2020;75(6):1334-1357. doi:10.1161/HYPERTENSIONAHA.120.15026
Weinberger M.H. The effects of sodium on blood pressure in humans. In: Laragh J.H., Brenner B.M., eds. Hypertension: pathophysiology, diagnosis and management. 2end ed. New York: Raven Press 1995;2703-2714.
Writing Group of the PREMIER Collaborative Research Group. Effects of comprehensive lifestyle modification on blood pressure control: main results of the PREMIER Clinical Trial. JAMA 2003;289:2083-2093. doi:10.1001/jama.289.16.2083
World Health Organization, International Society of Hypertension Writing Group. 2003 World Health Organization (WHO)/ISH statement on management of HTN. Guidelines and recommendations. J Hyperten 2003;21:1983-92. doi:10.1097/00004872-200311000-00002
And dietary cholesterol?
There is not a direct correlation between blood cholesterol and cholesterol intake. Dietary cholesterol may increase plasma cholesterol only when it is consumed with trans fats and saturated fatty acids.
However, if you want to reduce your cholesterol intake, we advise to reduce the use of animal products and/or use semi-skimmed or skimmed milk, light cheese, light yogurt, and lean meat.
A risky factor for hypercholesterolemia is a high intake of saturated fatty acids, a group of lipids that can be easily used for the endogenous synthesis of cholesterol.
These fatty acids are present in meat, diary products, and in abundance in vegetal fats and oils, such as margarine, palm oil, palm seed oil, and coconut oil, which are much used in the confectionery industry.
What to do:
to eliminate the visible fat of meat, or buy lean cuts;
to replace whole milk, butter, fat cheese, creams, and ice-creams with products which contain less fat, such as low-fat yogurt, semi-skimmed or skimmed milk, low-fat cheeses;
to avoid confectionery products.
Trans fatty acids
Trans fatty acids or trans fats are an extremely risky factor, and not only for hypercholesterolemia.
Studies have observed a high atherogenic potential caused by changes in plasmatic lipoproteins, where a decrease of HDL levels, and an increase of LDL and triglyceride levels occur.
Where can they be found?
In a lot of foods for kids.
In baked industrial products, such as crackers, breadsticks, cakes, packed bread, and snacks.
In a lot of industrial foods, such as soups, ready fresh or frozen meals, and mixtures to prepare pies and pizza.
In bouillon cubes.
In soft candies.
In some corn flakes.
In ice creams, in vegetal substitutes of cream, and in margarine.
In a lot of preserves, jams included.
As regards to the content of saturated and trans fatty acids, there is often no difference between classic products and “natural” or “organic” ones.
What can we do?
To avoid to buy products that contain vegetal fats and/or hydrogenated fatty acids, and to avoid to buy fried products.
Overweight
A significant body fat gain contributes to hypercholesterolemia.
In a lot of people, the decrease in the intake of satured and trans fatty acids doesn’t reduce the cholesterolemia levels till weight starts to drop.
What to do:
to reduce the intake of animal and vegetable fats;
to reduce foods rich in simple sugars, such as sweets, soft drinks, desserts, candies, and cakes;
do not win back calories you have eliminated in the preceding points by an excessive use of extravergin olive oil and starch, namely pasta, potatoes, rice, bread;
to increase the physical activity;
to increase the intake of fruit and vegetables.
Genetic causes
In this case, it needs a drug prescription by physician, which must be however combined with right nutritional advices.
References
Ascherio A., Katan M.B., Zock P.L., Stampfer M.J., Willett W.C. Trans fatty acids and coronary heart disease. N Engl J Med 1999;340:1994-1998. doi:10.1056/NEJM199906243402511
Benito-Vicente A., Uribe K.B., Jebari S., Galicia-Garcia U., Ostolaza H., Martin C. Familial hypercholesterolemia: the most frequent cholesterol metabolism disorder caused disease. Int J Mol Sci 2018;19(11):3426. doi:10.3390/ijms19113426
Fernandez M.L., Murillo A.G. Is there a correlation between dietary and blood cholesterol? Evidence from epidemiological data and clinical interventions. Nutrients 2022;14(10):2168. doi:10.3390/nu14102168
Hu F.B., Willett W.C. Optimal diet for prevention of coronary heart disease JAMA 2002;288:2569-2578. doi:10.1001/jama.288.20.2569
Lichtenstein A.H. Dietary fat, carbohydrate, and protein: effects on plasma lipoprotein patterns J. Lipid Res. 2006;47:1661-1667. doi:10.1194/jlr.R600019-JLR200
Lichtenstein A.H., Ausman L., Jalbert S.M., Schaefer E.J. Effect of different forms of dietary hydrogenated fats on serum lipoprotein cholesterol levels. N Engl J Med 1999;340:1933-1940. doi:10.1056/NEJM199906243402501
Mensink R.P., Katan M.B. Effect of dietary trans fatty acids on high-density and low-density lipoprotein cholesterol levels in healthy subjects. N Engl J Med 1990;323:439-445. doi:10.1056/NEJM199008163230703
Mozaffarian D., Katan M.B., Ascherio A., Stampfer M.J., Willett W.C. Trans fatty acids and cardiovascular disease. N Engl J Med 2006;354:1601-1613. doi:10.1056/NEJMra054035
Shils M.E., Olson J.A., Shike M., Ross A.C.: “Modern nutrition in health and disease” 9th ed., by Lippincott, Williams & Wilkins, 1999
The concept of the Mediterranean diet was first developed in the 1950s by the American physiologist Ancel Keys. Through the landmark Seven Countries Study, Keys highlighted for the first time the significant health benefits of this dietary pattern on cardiovascular disease (CVD) reductionn.[1][2][3]
Recognized as one of the healthiest models of nutrition, the Mediterranean diet is characterized by a high intake of minimally processed plant foods, such as vegetables, legumes, and whole-grain cereals, with extra virgin olive oil as the main source of fats. Consequently, it is naturally rich in antioxidant compounds and has well-documented anti-inflammatory properties.[4][5]
Subsequent research in both industrialized and non-industrialized populations confirmed its protective role not only against CVD, but also against chronic-degenerative diseases and depressive disorders, while showing positive effects on cognitive performance. Greater adherence to this pattern is consistently associated with better overall health and reduced mortality.[6]
No scientific evidence suggests that the Mediterranean diet is harmful. On the contrary, its reduced reliance on meat consumption supports public health and promotes environmental sustainability by helping lower greenhouse gas emissions.[7][8]
Ultimately, it represents a cultural and nutritional heritage that must be safeguarded, standing in contrast to the global trend toward dietary uniformityy.[9][10]
Summary: Key Points
Origins and research: developed in the 1950s by Ancel Keys, the benefits of the Mediterranean diet were first proven by the landmark “Seven Countries Study.”
Nutritional profile: characterized by a high intake of minimally processed plant foods, with extra virgin olive oil serving as the primary source of healthy fats.
Chronic prevention: scientific evidence confirms its protective role against cardiovascular diseases, cognitive decline, type 2 diabetes, and chronic inflammation.
Global sustainability: beyond personal longevity, its reduced reliance on meat consumption significantly helps lower greenhouse gas emissions compared to industrial diets.
In the early 1950s, Keys identified a correlation between diet and cardiovascular disease risk by comparing the incidence of CVD among American business executives with that of European populations just emerging from World War II. In the former group, composed of well-nourished subjects, the incidence was high, whereas in the latter, affected by food insecurity, it was low. These observations led Keys to hypothesize a correlation between dietary fat intake and deaths from cardiovascular diseases.[11]
Subsequent observations revealed an extremely low incidence of coronary heart disease and certain cancers in the population of Crete, in much of the rest of Greece, and in southern Italy compared with the United States.[3] This led Keys to hypothesize that the diet of these populations, characterized by a low intake of animal fats, was protective, and to launch the long-term observational project known as the Seven Countries Study, the most influential longitudinal study on the Mediterranean diet.
This study demonstrated:
an inverse correlation between diet quality and both overall and cardiovascular mortality;
that saturated fats were the major dietary risk factor;
that adherence to a Mediterranean-type diet reduced the risk of developing cardiovascular diseases.[1][12]
Characteristics of the Mediterranean diet
The Mediterranean diet is characterized by the consumption of large amounts of vegetables, legumes, fruits, cereals (preferably whole grain), and extra virgin olive oil, which provides an abundant supply of fiber, antioxidants, phytosterols, polyphenols and unsaturated fatty acids.[5]
As for animal products, the consumption of meat, especially red meat and processed meat, as well as high-fat dairy should be limited, while fish and seafood should be included regularly. Alcohol consumption should be moderate, primarily in the form of red wine consumed with meals. In the Greek cohort of the EPIC study, extra virgin olive oil, vegetables, legumes, moderate alcohol intake, and low consumption of meat and meat products were identified as the main dietary components associated with reduced mortality.[13][14]
A Bottle of Extra Virgin Olive Oil
A cornerstone of the Mediterranean diet is extra virgin olive oil. It is an excellent source of monounsaturated fatty acids and contains over 2,000 different compounds, many of which have antioxidant activity.
As the main source of dietary fat, and when combined with low consumption of high-fat animal products, it ensures a high ratio of monounsaturated to saturated fatty acids, which improves lipid profiles and glycemic control in people with diabetes.[15][16]
However, it is misleading to focus on a single element of this dietary pattern. There is no “magic bullet”, as shown by studies examining isolated components. People do not consume nutrients individually but as part of a complex whole, and more importantly, these nutrients interact with each other in synergistic or antagonistic ways. Thus, the health benefits of the Mediterranean diet arise from the combined effect of all its components.[17]
The Mediterranean diet and chronic diseases
Since the Seven Countries Study, numerous investigations have demonstrated the effectiveness of this dietary pattern in both primary and secondary prevention of major chronic diseases, from cardiovascular conditions to depressive disorders, as well as in reducing overall mortality.
Here are some examples.
A meta-analysis evaluated the association between adherence to the Mediterranean diet, mortality, and disease incidence, showing that “greater adherence to a Mediterranean diet is significantly associated with a reduced risk of overall mortality, cardiovascular mortality, cancer incidence and mortality, and incidence of Parkinson’s disease”.[4]
A randomized multicenter study demonstrated its efficacy in the primary prevention of cardiovascular events in subjects at high cardiovascular risk.[18][19]
Adherence to the Mediterranean diet has been associated with a lower risk of Alzheimer’s disease, as well as a more favorable course and outcome. Higher adherence is linked to lower mortality, with evidence suggesting a dose–response effect.[20][21][22]
Mounting evidence suggests a protective effect against weight gain.[23][24]
An inverse association has been reported between adherence to this dietary pattern and the incidence of type 2 diabetes, both among initially healthy individuals and among patients who survived myocardial infarction.[25][26]
It is also associated with a lower prevalence of metabolic syndrome.[27][28]
Epidemiological and interventional studies have revealed a protective effect against low-grade chronic inflammation and its metabolic complications.[29][30]
There is also evidence that adherence to the Mediterranean diet may play a protective role in the prevention of depressive disorders.[31][32]
Its role in reducing greenhouse gas emissions
The Mediterranean diet can also improve public health by contributing to the reduction of greenhouse gas emissions, namely carbon dioxide (CO2), methane, nitrous oxide, and similar compounds, originating from the livestock sector, which is responsible for four-fifths of agriculture-related emissions. These emissions exceed those generated by transportation and are second only to those produced by the energy sector.[33][34][35]
Considering that the global population is growing, and that this growth is accompanied by an increase in per capita meat consumption, with estimates predicting an 85% increase in meat production by 2030 compared with 2000, the role of the Mediterranean diet in mitigating greenhouse gas emissions becomes even more evident.[36][37]
Greenhouse gas emission and cattle farming
A detailed analysis of greenhouse gas emissions from cattle farming, the main contributor within the livestock sector, shows the following distribution:
about 40% comes from the loss of annual plants, grasses, and trees that originally covered the land used to grow feed crops;
32% from methane emissions generated by animal waste and by the animals themselves as a result of digestion;
14% from the use of fertilizers to grow feed grain (approximately 16 pounds of grain are required to produce every kilogram of meat consumed);
14% from agricultural production in general.
The table below compares CO2-equivalent emissions from the production of different foods (per 225 g portion) with the distance traveled by a gasoline-powered car consuming 1 liter of fuel every 12 km.
Comparison of CO2-equivalent emissions (g) for 225 g portions of various foods, relative to the distance (km and miles) traveled by a gasoline car (12 km/L fuel consumption)
Foods
CO2 equivalent (g)
Equivalent Distance (km/miles)
Potatoes
59
0.300 (0.17)
Apples
68
0.320 (0.2)
Asparagus
91
0.440 (0.27)
Chicken
249
1.17 (0.73)
Pork
862
4.10 (2.52)
Beef
3360
15.80 (9.81)
This comparison highlights the environmental impact of different food choices. Producing 225 grams of beef releases almost 13 times more greenhouse gases than producing an equal amount of chicken, and 57 times more than producing potatoes.
To put this into perspective, producing the 41 kilograms of beef consumed annually by the average American releases the same amount of CO2 as a gasoline car traveling approximately 3,000 kilometers.[38][39][40][41]
The Mediterranean diet is a proven path to health and longevity. Beyond personal wellness, it stands as a sustainable model, showing that what’s good for us is also good for the planet.
References
^ ab Keys A., Aravanis C., Blackburn H., et al. Seven Countries: A Multivariate Analysis of Death and Coronary Heart Disease. Harvard University Press, Cambridge, Harvard University Press, ISBN: 0-674-80237-3, 1980. 381 pp.
^ Keys A. Mediterranean diet and public health: personal reflections. Am J Clin Nutr 1995;61:1321S-1323S doi:10.1093/ajcn/61.6.1321S
^ ab Menotti A., Puddu P.E. Ancel Keys, the Mediterranean diet, and the Seven Countries Study: a review. J Cardiovasc Dev Dis 2025;12(4):141. doi:10.3390/jcdd12040141
^ ab Sofi F., Cesari F., Abbate R., Gensini G.F. and Casini A. Adherence to Mediterranean diet and health status: meta-analysis. BMJ 2008;337:a1344. doi:10.1136/bmj.a1344
^ ab Barbouti A., Goulas V. Dietary antioxidants in the Mediterranean diet. Antioxidants (Basel) 2021;10(8):1213. doi:10.3390/antiox10081213
^ Friel S., Dangour A.D., Garnett T., Lock K., Chalabi Z., Roberts I., Butler A., Butler C.D., Waage J., McMichael A.J. and Haines A. Public health benefits of strategies to reduce greenhouse-gas emissions: food and agriculture. Lancet 2009;374:2016-2025. doi:10.1016/S0140-6736(09)61753-0
^ García S., Bouzas C., Mateos D., et al. Carbon dioxide (CO2) emissions and adherence to Mediterranean diet in an adult population: the Mediterranean diet index as a pollution level index. Environ Health 2023;22(1):1. doi:10.1186/s12940-022-00956-7
^ Nestle M. Mediterranean diets: historical and research overview. Am J Clin Nutr 1995;61:1313S-1320S doi:10.1093/ajcn/61.6.1313S
^ Keys A., Taylor H.L., Blackburn H., Brozek J., Anderson J.T., Simonson E. Coronary heart disease among Minnesota business and professional men followed fifteen years. Circulation 1963;28:381–395. doi:10.1161/01.CIR.28.3.381
^ Menotti A., Lanti M., Kromhout D., Blackburn H. Nissinen A., Dontas A., Kafatos A., Nedeljkovic S., Adachi H. Forty-year coronary mortality trends and changes in major risk factors in the first 10 years of follow-up in the Seven Countries Study. Eur J Epidemiol 2007;22(11):747-54. doi:10.1007/s10654-007-9176-4
^ Trichopoulou A., Costacou T., Bamia C., Trichopoulos D. Adherence to a Mediterranean Diet and Survival in a Greek Population. N Engl J Med 2003;348:2599-2608. doi:10.1056/NEJMoa025039
^ Trichopoulou A., Bamia C. and Trichopoulos D. Anatomy of health effects of Mediterranean diet: Greek EPIC prospective cohort study. BMJ 2009;338:b2337. doi:10.1136/bmj.b2337
^ Covas M.I. Olive oil and the cardiovascular system. Pharmacol Res 2007;55(3):175-86. doi:10.1016/j.phrs.2007.01.010
^ Riolo R., De Rosa R., Simonetta I., Tuttolomondo A. Olive oil in the Mediterranean diet and Its biochemical and molecular effects on cardiovascular health through an analysis of genetics and epigenetics. Int J Mol Sci 2022;23(24):16002. doi:10.3390/ijms232416002
^ Giugliano D., Esposito K. Mediterranean diet and metabolic diseases. Curr Opin Lipidol 2008;19:63-68. doi:10.1097/MOL.0b013e3282f2fa4d
^ Estruch R., Ros E., Salas-Salvadó J., et al. Primary prevention of cardiovascular disease with a Mediterranean Diet. N Engl J Med 2013;368:1279-1290. doi:10.1056/NEJMoa1200303
^ Laffond A., Rivera-Picón C., Rodríguez-Muñoz P.M., Juárez-Vela R., Ruiz de Viñaspre-Hernández R., Navas-Echazarreta N., Sánchez-González J.L. Mediterranean det for primary and secondary prevention of cardiovascular disease and mortality: an updated systematic review. Nutrients 2023;15(15):3356. doi:10.3390/nu15153356
^ Scarmeas N., Luchsinger J.A., Mayeux R. and Stern Y. Mediterranean diet and Alzheimer disease mortality. Neurology 2007;69(11):1084-1093 doi:10.1212/01.wnl.0000277320.50685.7c
^ Morris M.C., Tangney C.C., Wang Y., Sacks F.M., Bennett D.A., Aggarwal N.T. MIND diet associated with reduced incidence of Alzheimer’s disease. Alzheimers Dement 2015;11(9):1007-14. doi:10.1016/j.jalz.2014.11.009
^ Vaziri Y. The Mediterranean diet: a powerful defense against Alzheimer disease – A comprehensive review. Clin Nutr ESPEN 2024;64:160-167. doi:10.1016/j.clnesp.2024.09.020
^ Schröder H. Protective mechanisms of the Mediterranean diet in obesity and type 2 diabetes. J Nutr Biochem 2007;18:149-60. doi:10.1016/j.jnutbio.2006.05.006
^ Lotfi K., Saneei P., Hajhashemy Z., Esmaillzadeh A. Adherence to the Mediterranean diet, five-year weight change, and risk of overweight and obesity: a systematic review and dose-response meta-analysis of prospective cohort studies. Adv Nutr 2022;13(1):152-166. doi:10.1093/advances/nmab092
^ Martínez-González M.Á., de la Fuente-Arrillaga C., Nunez-Cordoba J.M., Basterra-Gortari F.J., Beunza J.J., Vazquez Z., Benito S., Tortosa A., Bes-Rastrollo M. Adherence to Mediterranean diet and risk of developing diabetes: prospective cohort study. BMJ 2008;336:1348-1351. doi:10.1136/bmj.39561.501007.BE
^ Martín-Peláez S., Fito M., Castaner O. Mediterranean diet effects on type 2 diabetes prevention, disease progression, and related mechanisms. A review. Nutrients 2020;12(8):2236. doi:10.3390/nu12082236
^ Kastorini C.M., Milionis H.J., Esposito K., Giugliano D., Goudevenos J.A., Panagiotakos D.B. The effect of Mediterranean diet on metabolic syndrome and its components: a meta-analysis of 50 studies and 534,906 individuals. J Am Coll Cardiol 2011;57(11):1299-313. doi:10.1016/j.jacc.2010.09.073
^ Dayi T, Ozgoren M. Effects of the Mediterranean diet on the components of metabolic syndrome. J Prev Med Hyg 2022;63(2 Suppl 3):E56-E64. doi:10.15167/2421-4248/jpmh2022.63.2S3.2747
^ Casas R., Sacanella E., Urpí-Sardà M., et al. The effects of the mediterranean diet on biomarkers of vascular wall inflammation and plaque vulnerability in subjects with high risk for cardiovascular disease. A randomized trial. PLoS One 2014;9(6):e100084. doi:10.1371/journal.pone.0100084
^ Bonaccio M., Pounis G., Cerletti C., Donati M.B., Iacoviello L., de Gaetano G; MOLI-SANI Study Investigators. Mediterranean diet, dietary polyphenols and low grade inflammation: results from the MOLI-SANI study. Br J Clin Pharmacol 2017;83(1):107-113. doi:10.1111/bcp.12924
^ Sánchez-Villegas A., Delgado-Rodríguez M., Alonso A., Schlatter J., Lahortiga F., Serra Majem L., Martínez-González M.A. Association of the Mediterranean Dietary pattern with the incidence of depression: The Seguimiento Universidad de Navarra/University of Navarra Follow-up (SUN) Cohort. Arch Gen Psychiatry 2009;66:1090-1098 doi:10.1001/archgenpsychiatry.2009.129
^ Bizzozero-Peroni B., Martínez-Vizcaíno V., Fernández-Rodríguez R., Jiménez-López E., Núñez de Arenas-Arroyo S., Saz-Lara A., Díaz-Goñi V., Mesas A.E. The impact of the Mediterranean diet on alleviating depressive symptoms in adults: a systematic review and meta-analysis of randomized controlled trials. Nutr Rev 2025;83(1):29-39. doi:10.1093/nutrit/nuad176
^ Willett W., Rockström J., Loken B., et al. Food in the Anthropocene: the EAT-Lancet Commission on healthy diets from sustainable food systems. Lancet 2019;393(10170):447-492. doi:10.1016/S0140-6736(18)31788-4
^ Koliaki C.C., Katsilambros N.L., Dimosthenopoulos C. The Mediterranean diet in the era of climate change: a reference diet for human and planetary health. Climate 2024 12(9):136. doi:10.3390/cli12090136
^ Kristiansen S., Painter J., Shea M. Animal agriculture and climate change in the US and UK elite media: volume, responsibilities, rauses and solutions. Environ Commun 2021;15(2):153-172. doi:10.1080/17524032.2020.1805344
^ FAO. Livestock’s long shadow: environmental issues and options. Rome: Food and Agriculture Organization of the United Nations. 2006. https://www.fao.org/4/a0701e/a0701e00.htm
^ Font-I-Furnols M. Meat consumption, sustainability and alternatives: an overview of motives and barriers. Foods 2023;12(11):2144. doi:10.3390/foods12112144
^ Opio C., Gerber P., Mottet A., Falcucci A., Tempio G., MacLeod M., Vellinga T., Henderson B., Steinfeld H. Greenhouse gas emissions from ruminant supply chains – A global life cycle assessment. Food and Agriculture Organization of the United Nations (FAO), Rome. 2013. https://www.fao.org/4/i3461e/i3461e.pdf
^ Poore J., Nemecek T. Reducing food’s environmental impacts through producers and consumers. Science 2018;360(6392):987-992. doi:10.1126/science.aaq0216
^ Nugrahaeningtyas E., Lee J.S., Park K.H. Greenhouse gas emissions from livestock: sources, estimation, and mitigation. J Anim Sci Technol 2024;66(6):1083-1098. doi:10.5187/jast.2024.e86
The human gastrointestinal tract is one of the most highly competitive ecological niches in the human body. It harbors a complex ecosystem composed of viruses, eukaryotes, bacteria, and members of the Archaea, including Methanobrevibacter smithii. This ecosystem, collectively referred to as the gut microbiota, represents a major component of the broader human microbiota.[1][2]
The gut microbiota is characterized by a remarkable taxonomic and functional complexity. It comprises hundreds of microbial species organized into structured communities, shaped by ecological interactions among microorganisms, including bacteria, bacteriophages, and other components of the gut ecosystem. Together, these interactions contribute to both community stability and inter-individual variability.[3][4]
Beyond its compositional features, the gut microbiota is a highly dynamic entity whose structure changes profoundly over time. Microbial communities are established early in life, undergo rapid remodeling during infancy and childhood, and progressively evolve through adulthood and aging. Early-life events, particularly the mode of delivery, play a pivotal role in its initial assembly and may influence immune system development and long-term microbial trajectories.[5][6][7]
After this early developmental phase, additional factors progressively shape gut microbiota composition and function. These include spatial differences along the gastrointestinal tract, driven by variations in pH, oxygen availability, digestive enzymes, and bile salts, as well as external modulators such as diet and geographical location. Together, these pressures contribute to the diversification of microbial communities and to their functional specialization.[8][9][10]
As a result, the gut microbiota emerges as a dynamic, spatially organized, and temporally regulated ecosystem. As a central component of the human microbiota, it plays a fundamental role in host physiology and represents a key link between environmental exposures, host biology, and health and disease.[11]
Bacterial abundance and composition vary along the gastrointestinal tract and are particularly high in the colon.
The adult human colon contains more than 400 bacterial species, belonging to nine major phyla out of the approximately 30 currently recognized. However, metagenomic approaches suggest that the actual diversity is substantially higher.[12]
The most abundant bacterial phyla of the Western adult gut microbiota and their representative genera are summarized in the table below.[13][14]
Major bacterial phyla of the Wester adult gut microbiota
The adult gut harbors a large and diverse community of DNA and RNA viruses, collectively known as the virome, comprising thousands of viral genotypes, none of which is dominant. Indeed, the most abundant virus accounts for only about 6% of the community, whereas in infants the most abundant virus accounts for over 40%.[15][16][17]
The majority of DNA viruses are bacteriophages (or phages), namely viruses that infect bacteria. They are the most abundant biological entities on Earth, with an estimated population of approximately 1031 particles, whereas many RNA viruses detected are plant viruses.[18]
Selective pressure and individual variability
The presence of only a small subset of the bacterial world in the colon is the result of strong selective pressures that have acted during evolution on both microbial colonizers, selecting organisms highly adapted to this environment, and the intestinal niche itself.[3][7] Nevertheless, each individual harbors a unique bacterial community in the gut. This individual specificity coexists with recurrent ecological patterns observed across populations.[19]
Despite the high variability observed both among taxa and between individuals, it has been proposed, although not universally accepted, that in most adults the gut microbiota can be classified into variants, or enterotypes, based on the relative abundance of the genera Bacteroides and Prevotella.[20] This suggests the existence of a limited number of well-balanced symbiotic states, which may respond differently to factors such as intestinal environment, diet, age, genetics, health status, and drug intake.[21]
Gut microbiota composition throughout life
The development of the intestinal microbial ecosystem is a complex and crucial process in human life, and is highly variable among individuals.[6][7]
Development and Life-Course Modifications of the Gut Microbiota
In utero, the gut has traditionally been considered sterile; however, it is rapidly colonized by microbes at birth, as the infant is born with an immunological tolerance shaped by the mother.[22]
Recent studies, however, have reported the presence of bacteria in placental tissue, umbilical cord blood, fetal membranes, and amniotic fluid from healthy newborns without signs of infection or inflammation.[23] For example, the meconium of premature infants born to healthy mothers contains a specific microbiota, with Firmicutes as the main phylum and a predominance of staphylococci. In contrast, Proteobacteria, particularly species such as Escherichia coli, Klebsiella pneumoniae, and Serratia marcescens, as well as enterococci, are more abundant in feces.[24]
It appears that both vaginal and gut bacteria may gain access to the fetus, although through different routes of entry: vaginal bacteria via ascending pathways, and gut bacteria via immune system dendritic cells. Therefore, the existence of a fetal microbiota has been proposed.[6]
Mode of delivery
The first major determinant of postnatal microbial colonization is the mode of delivery.[25] Colonization occurs during delivery through a maternal inoculum, generally composed of aerobic and facultative bacteria, as the newborn gut initially contains oxygen. These are later replaced by obligate anaerobes, which are typically found in adulthood and for which a suitable environment is gradually established.[26]
The maternal vaginal and fecal microbiotas are the primary sources of inoculum in vaginally delivered infants. Accordingly, infants harbor microbial communities dominated by species of the genera Lactobacillus, the most abundant genus in the vaginal microbiota and early gut microbiota, Bifidobacterium, Prevotella, and Sneathia.[27] Anaerobic bacteria, such as members of the phyla Firmicutes and Bacteroidetes, which cannot grow outside the host, likely rely on close mother–infant contact for transmission. Moreover, due to the presence of oxygen in the infant gut, the transmission of strict anaerobes may not occur directly at birth but later, possibly via spores.[28]
In infants born by caesarean section, the first bacteria encountered originate from the skin and hospital environment. Their gut microbiota is dominated by species of the genera Corynebacterium, Staphylococcus, and Propionibacterium, with a lower bacterial load and diversity during the first weeks of life compared with vaginally delivered infants.[29][30]
Further evidence supporting vertical transmission comes from the similarity between meconium microbiota and samples obtained from potential maternal sources. These maternal bacteria do not persist indefinitely and are replaced by other microbial populations within the first year of life.[31]
Objects, animals, the mouths and skin of relatives, as well as breast milk, serve as secondary sources of inoculum. Among these, breast milk appears to play a primary role in determining microbial succession in the gut. Inter-individual variation among children reflects the uniqueness of these microbial exposures.[32]
Mode of delivery and immune system
Mode of delivery also appears to influence immune system development during the first year of life, possibly through its effects on gut microbiota.[33]
Infants born by caesarean section show:
a lower bacterial load in stool samples at one month of age, largely due to reduced bifidobacterial abundance;
a higher number of antibody-secreting cells, potentially reflecting excessive antigen exposure due to increased intestinal permeability.
Together, these findings support the concept that early alterations in microbial colonization associated with caesarean delivery may influence immune maturation during a critical developmental window.[30][34][35]
From birth to first month
Within a few days after birth, a thriving microbial community is established. This community is less stable and more variable than that of adults and soon becomes more numerous than the host’s own cells. Its development follows a highly individual temporal pattern.[5]
During the first month of life, a limited number of taxa, mainly belonging to the phyla Actinobacteria and Proteobacteria, remain relatively stable. In subsequent months, however, there is a marked increase in variability and the emergence of new genetic variants.[6] Numerous studies emphasize that early microbial exposure plays a critical role in shaping the “trajectories” leading to the adult ecosystem. These early communities may also act as sources of either protective or pathogenic microorganisms.[17]
Viruses, absent at birth, reach about 108 particles per gram of wet fecal weight by the end of the first week of life, becoming a dynamic and abundant component of the developing gut ecosystem. Although viral diversity is initially low, the virome is dominated by bacteriophages, which likely influence bacterial abundance and diversity. The origin of these viruses remains unclear, although maternal and environmental sources are plausible.[36] Notably, early viruses may arise from prophage induction within the newborn gut microbiota, as suggested by the observation that over 25% of phage sequences closely resemble those infecting Lactococcus, Lactobacillus, Enterococcus, and Streptococcus, genera abundant in breast milk.[37][38]
From first month to first year
By the end of the first month of life, the initial phase of rapid microbial acquisition is thought to be complete. In 1-month-old infants, the most abundant bacteria belong to the genera Bacteroides and Escherichia. Subsequently, Bifidobacterium, together with Ruminococcus, increases and becomes dominant in the gut of breastfed infants between 1 and 11 months of age.[39][40]
Bifidobacteria, such as Bifidobacterium longum subsp. infantis:
are closely associated with breastfeeding;
are among the best-characterized commensal bacteria;
are considered probiotics, capable of conferring health benefits to the host.[41]
Their abundance also provides protection through competitive exclusion, limiting pathogen colonization. In contrast, Escherichia (e.g., E. coli), Clostridium (e.g., C. difficile), Bacteroides (e.g., B. fragilis), and Lactobacillus are present at higher levels in formula-fed infants than in breastfed infants.[42]
Although breastfed infants receive only breast milk until weaning, their microbiota may exhibit considerable inter-individual variability in both taxonomic abundance and temporal dynamics. These differences may arise from disease, antibiotic exposure, lifestyle changes, stochastic colonization events, and variations in immune responses. However, the relative contribution of each factor remains unclear.[5][43]
The virome also changes rapidly after birth: most viral sequences detected during the first week of life are absent after the second week, and diversity expands markedly during the first three months.[17][44] This contrasts with the adult virome, in which approximately 95% of sequences remain stable over time.[15][45]
From first year to 2.5 years
Under normal conditions, by the end of the first year of life, infants have consumed a diversified, family-type diet for a sufficient period and develop a microbial community resembling that of adults, characterized by:[5]
increased stability and phylogenetic complexity, with greater similarity among individuals;[46]
dominance of Firmicutes and Bacteroidetes, followed by Verrucomicrobia and low levels of Proteobacteria;[47]
increased fecal bacterial load and production of short-chain fatty acids, mainly acetate, propionate, and butyrate;[48]
enrichment of genes involved in xenobiotic degradation, vitamin biosynthesis, and carbohydrate metabolism.[49]
Despite the substantial taxonomic turnover from birth to one year of age, overall functional capacity remains remarkably constant.[50] By this stage, early viral colonizers are also replaced by a child-specific virome.[44]
The gut microbiota reaches full maturity at approximately 2.5 years of age, closely resembling that of adults. This maturation results from several factors:
transition to an adult diet;
greater fitness of adult-associated taxa compared with early colonizers;
developmental changes in the intestinal mucosa;
ecological effects exerted by the microbiota itself.
Consequently, the first 2–3 years of life represent a critical window during which targeted interventions may optimize microbiota development and support healthy growth.[7]
Adulthood
From an initially chaotic state, the gut ecosystem evolves into a relatively stable adult configuration, persisting until old age. This ecosystem includes viral, archaeal, and eukaryotic components and, in Western populations, is dominated by Firmicutes (approximately 60%), followed by Bacteroidetes and Actinobacteria, mainly Bifidobacterium, each representing about 10%, with lower proportions of Proteobacteria and Verrucomicrobia. The genera Bacteroides, Clostridium, Faecalibacterium, Ruminococcus, and Eubacterium, together with Methanobrevibacter smithii, constitute the majority of the adult gut microbiota.[51][52]
Representative composition of the Western adult gut microbiota
Different patterns have been observed in rural African populations.[53] Nevertheless, the gut microbiota is sufficiently conserved across individuals to allow identification of a shared core microbiome.[54]
Stability and resilience are influenced by numerous variables, among which diet appears to be one of the most important. Maintaining microbiota stability therefore requires minimizing disruptive factors and preventing disease, including through vaccination. However, stability may be detrimental if the dominant microbial community is pathogenic.[55][56]
Older age
In elderly individuals, the gut microbiota undergoes significant changes.[57] A study conducted in Ireland on 161 healthy subjects aged 65 years and older showed that, in most individuals, the microbiota differs substantially from that of younger adults. It is dominated by Bacteroidetes and Firmicutes, with nearly inverted proportions compared with younger subjects, although considerable inter-individual variability exists. Faecalibacterium accounts for approximately 6% of dominant genera, followed by Ruminococcus, Roseburia, and Bifidobacterium, the latter representing about 0.4%.[58]
Microbiota variability is also greater in the elderly, possibly due to increased comorbidities, higher medication use, and age-related dietary changes.[51][59]
Gut microbiota and intestinal environment
Due to its low pH, the stomach represents a hostile environment for bacteria, which are present in relatively low numbers, approximately 102–103 bacterial cells per gram of tissue. In addition to Helicobacter pylori, which can cause gastritis and gastric ulcers, microorganisms belonging to the genus Lactobacillus are also detected.[8][60]
Upon reaching the duodenum, bacterial numbers increase to approximately 104−105 cells per gram of tissue, with similar concentrations in the jejunum and proximal ileum.[61] The relatively low microbial load of the small intestine is due to its inhospitable environment, resulting from the opening of the ampulla of Vater in the descending portion of the duodenum, which releases pancreatic juice and bile. Pancreatic enzymes and bile salts exert antimicrobial effects that limit bacterial growth.[10]
In the terminal ileum, where the activity of pancreatic enzymes and bile salts is reduced, bacterial numbers rise to approximately 107 cells per gram of tissue, reaching up to 1012−1014 cells per gram in the colon. As a consequence, bacteria account for a large proportion, about 40%, of fecal mass.[62]
Bacterial distribution along the intestine
The intestinal environment, defined by pH gradients, bile salts, digestive enzymes, oxygen availability, and nutrient distribution, exerts a major selective pressure on the gut microbiota.[63]
The distribution of bacteria along the intestine is strategic. In the duodenum and jejunum, nutrient availability is high, whereas in the terminal ileum and colon only water, fiber, and electrolytes remain. Therefore, high bacterial densities in the distal gut are not problematic.[64] Conversely, elevated bacterial concentrations in the duodenum, jejunum, and proximal ileum are pathological and characterize a condition known as small intestinal bacterial overgrowth (SIBO), in which bacterial numbers increase by one or more orders of magnitude compared with physiological levels. This results in competition with the host for nutrients and leads to gastrointestinal symptoms such as diarrhea.[65]
Gut microbiota and diet
Diet is widely recognized as the most influential factor shaping the composition and metabolic activity of the gut microbiota.[66] Both the quality and the temporal pattern of nutrient intake exert strong selective pressures, affecting microbial diversity from early life through adulthood. Dietary effects can be observed at multiple levels, ranging from initial colonization to long-term enterotype configuration and modulation of the gut virome.[15][55][67]
Role of breast milk
Traditionally considered sterile, human milk harbors a rich microbiota consisting of more than 700 species, dominated by staphylococci, streptococci, bifidobacteria, and lactic acid bacteria.[68] It therefore represents a major source for the colonization of the breastfed infant gut.[32] This mode of colonization has been suggested to be closely correlated with infant health status, as it may protect against infections and contribute to immune system maturation.[69] Breast milk also affects the intestinal microbiota indirectly through the presence of oligosaccharides with prebiotic activity, which stimulate the growth of specific bacterial groups, including bifidobacteria.[70]
Dietary patterns in different populations
A study compared the intestinal microbiota of European and African children, aged between 1 and 6 years, from Florence and a rural village in Burkina Faso, respectively. The study highlighted the dominant role of diet over variables such as climate, geography, hygiene, and health services.[53]
A relative functional convergence has been reported, with no major differences in key immune-related pathways between the two groups. Indeed, as widely reported in the literature, infants, as long as they are breastfed, display a very similar gut microbiota, rich in Actinobacteria, mainly Bifidobacterium.[71]
The subsequent introduction of solid foods, namely, a Western diet rich in animal fats and proteins in European children, and a diet low in animal proteins but rich in complex carbohydrates in African children, leads to a differentiation in the Firmicutes/Bacteroidetes ratio between the two groups. Gram-positive bacteria, mainly Firmicutes, were more abundant in European children, whereas Gram-negative bacteria, mainly Bacteroidetes, prevailed in African children.[72]
Long-term and short-term dietary effects
Long-term dietary patterns are strongly associated with enterotype partitioning. Specifically:
a diet high in animal fats and proteins (a Western-type diet) leads to a gut microbiota dominated by the Bacteroides enterotype;
a diet high in complex carbohydrates, typical of agrarian societies, leads to the prevalence of the Prevotella enterotype.[67]
Similar results emerged from the aforementioned study in children. In European subjects, the gut microbiota was enriched in taxa typical of the Bacteroides enterotype, whereas in children from Burkina Faso the Prevotella enterotype prevails.[72]
Short-term dietary changes (approximately 10 days), particularly macronutrient shifts and fiber-driven interventions, result in rapid alterations of gut microbiota composition, detectable within 24 hours. However, these changes do not lead to stable modifications in enterotype partitioning, indicating that long-term dietary patterns are required to induce sustained enterotype transitions.[73]
Diet and virome
Dietary interventions can also induce changes in the gut virome, leading to a new equilibrium state. These changes involve shifts in the relative proportions of pre-existing viral populations, toward which individuals consuming the same diet tend to converge.[15][16]
Gut microbiota, health status, and disease
The health status of both the infant and the mother represents a major determinant of gut microbiota composition.[50] For example, in mothers affected by inflammatory bowel disease (IBD), a condition characterized by chronic intestinal inflammation, the gut microbiota shows a marked depletion of Faecalibacterium prausnitzii, a butyric acid–producing bacterium with well-established anti-inflammatory properties. This reduction is accompanied by an increased abundance of adherent Escherichia coli, a microbial signature commonly associated with intestinal dysbiosis.[74][75]
Gut microbiota, bacteriocins, and bacteriophages
Bacteriocins are proteins with antibacterial activity, whereas bacteriophages play a key role in controlling the abundance and composition of the gut microbiota. In particular, bacteriophages may influence newborn colonization by infecting dominant bacterial populations, thereby allowing other bacterial strains to become prevalent.[76]
This predator–prey dynamic, known as the kill-the-winner model, suggests that blooms of a specific bacterial species are followed by blooms of their corresponding bacteriophages, leading to a subsequent decline in bacterial abundance. Consequently, the most abundant bacteriophage genotype changes over time. Although some gene sequences in the infant gut virome remain stable during the first three months of life, dramatic shifts in the overall viral community composition occur between the first and second week of life. During this period, the bacterial community is also extremely dynamic.[17][37][77]
Gut microbiota and geographical location
Geographical location has been shown to influence gut microbiota composition from early life. In European infants, for example, Northern infants tend to harbor higher levels of Bifidobacterium species and some Clostridium, whereas Southern infants exhibit higher levels of Bacteroides, Lactobacillus, and Eubacterium.[6][78]
More broadly, cross-population studies indicate that geographical location, together with lifestyle factors such as diet, subsistence patterns, and environmental exposures, contributes substantially to variation in gut microbiota composition and diversity across human populations.[79] These findings suggest that both regional environmental influences and culturally driven dietary habits play a key role in shaping the early-life microbiome.
References
^ Afzaal M., Saeed F., Shah Y.A., et al. Human gut microbiota in health and disease: unveiling the relationship. Front Microbiol 2022;13:999001. doi:10.3389/fmicb.2022.999001
^ Dekaboruah E., Suryavanshi M.V., Chettri D., Verma A.K. Human microbiome: an academic update on human body site specific surveillance and its possible role. Arch Microbiol 2020;202(8):2147-2167. doi:10.1007/s00203-020-01931-x
^ ab Ley R.E., Peterson D.A., and Gordon J.I. Ecological and evolutionary forces shaping microbial diversity in the human intestine. Cell 2006;124(4):837-848. doi:10.1016/j.cell.2006.02.017
^ Hitch T.C.A., Hall L.J., Walsh S.K., Leventhal G.E., Slack E., de Wouters T., Walter J., Clavel T. Microbiome-based interventions to modulate gut ecology and the immune system. Mucosal Immunol 2022;15(6):1095-1113. doi:10.1038/s41385-022-00564-1
^ abcd Palmer C., Bik E.M., DiGiulio D.B., Relman D.A., and Brown P.O. Development of the human infant intestinal microbiota. PLoS Biol 2007;5(7):e177. doi:10.1371/journal.pbio.0050177
^ abcde Rodríguez J.M., Murphy K., Stanton C., et al. The composition of the gut microbiota throughout life, with an emphasis on early life. Microb Ecol Health Dis 2015;26:26050. doi:10.3402/mehd.v26.26050
^ abcd Schoultz I., Claesson M.J., Dominguez-Bello M.G., et al. Gut microbiota development across the lifespan: disease links and health-promoting interventions. J Intern Med 2025;297(6):560-583. doi:10.1111/joim.20089
^ ab Maurer J.M., Schellekens R.C., van Rieke H.M., et al. Gastrointestinal pH and transit time profiling in healthy volunteers using the IntelliCap system confirms ileo-colonic release of ColoPulse tablets. PLoS One 2015;10(7):e0129076. doi:10.1371/journal.pone.0129076
^ Zhang J., Huang Y.J., Yoon J.Y., et al. Primary human colonic mucosal barrier crosstalk with super oxygen-sensitive Faecalibacterium prausnitzii in continuous culture. Med 2021;2(1):74-98.e9. doi:10.1016/j.medj.2020.07.001
^ ab Ma H., Wang K., Jiang C. Microbiota-derived bile acid metabolic enzymes and their impacts on host health. Cell Insight 2025;4(5):100265. doi:10.1016/j.cellin.2025.100265
^ Zeng Q., Feng X., Hu Y., Su S. The human gut microbiota is associated with host lifestyle: a comprehensive narrative review. Front Microbiol 2025;16:1549160. doi:10.3389/fmicb.2025.1549160
^ Qin J., Li R., Raes J., et al. A human gut microbial gene catalogue established by metagenomic sequencing. Nature 2010;464(7285):59-65. doi:10.1038/nature08821
^ Thursby E., Juge N. Introduction to the human gut microbiota. Biochem J 2017;474(11):1823-1836. doi:10.1042/BCJ20160510
^ Almeida A., Nayfach S., Boland M., et al. A unified catalog of 204,938 reference genomes from the human gut microbiome. Nat Biotechnol 2021;39(1):105-114. doi:10.1038/s41587-020-0603-3
^ abcd Minot S., Sinha R., Chen J., Li H., Keilbaugh S.A., Wu G.D., Lewis J.D., and Bushman F.D. The human gut virome: inter-individual variation and dynamic response to diet. Genome Res 2011;21:1616-1625. doi:10.1101/gr.122705.111
^ ab Cao Z., Sugimura N., Burgermeister E., Ebert M.P., Zuo T., Lan P. The gut virome: a new microbiome component in health and disease. EBioMedicine 2022;81:104113. doi:10.1016/j.ebiom.2022.104113
^ abcd Lim E.S., Zhou Y., Zhao G., Bauer I.K., et al. Early life dynamics of the human gut virome and bacterial microbiome in infants. Nat Med 2015;21(10):1228-34. doi:10.1038/nm.3950
^ Batinovic S., Wassef F., Knowler S.A., et al. Bacteriophages in natural and artificial environments. Pathogens 2019;8(3):100. doi:10.3390/pathogens8030100
^ Morgan X.C., Segata N., Huttenhower C. Biodiversity and functional genomics in the human microbiome. Trends Genet 2013;29(1):51-8. doi:10.1016/j.tig.2012.09.005
^ Arumugam M., Raes J., Pelletier E., et al. Enterotypes of the human gut microbiome. Nature 2011;473(7346):174-80. doi:10.1038/nature09944
^ Costea P.I., Hildebrand F., Arumugam M., et al. Enterotypes in the landscape of gut microbial community composition. Nat Microbiol 2018;3(1):8-16. doi:10.1038/s41564-017-0072-8
^ Francino M.P. Early development of the gut microbiota and immune health. Pathogens 2014;3(3):769-90. doi:10.3390/pathogens3030769
^ Gil A., Rueda R., Ozanne S.E., et al. Is there evidence for bacterial transfer via the placenta and any role in the colonization of the infant gut? – a systematic review. Crit Rev Microbiol 2020;46(5):493-507. doi:10.1080/1040841X.2020.1800587
^ Moles L., Gómez M., Heilig H., et al. Bacterial diversity in meconium of preterm neonates and evolution of their fecal microbiota during the first month of life. PLoS One 2013;8(6):e66986. doi:10.1371/journal.pone.0066986
^ Dominguez-Bello M.G., Costello E.K., Contreras M., Magris M., Hidalgo G., Fierer N., and Knight R. Delivery mode shapes the acquisition and structure of the initial microbiota across multiple body habitats in newborns. Proc Natl Acad Sci 2010;107:11971-11975. doi:10.1073/pnas.1002601107
^ Browne H.P., Neville B.A., Forster S.C., Lawley T.D. Transmission of the gut microbiota: spreading of health. Nat Rev Microbiol. 2017;15(9):531-543. doi:10.1038/nrmicro.2017.50
^ Liu T., Kress A.M., Debelius J., et al. Maternal vaginal and fecal microbiota in later pregnancy contribute to child fecal microbiota development in the ECHO cohort. iScience 2025;28(4):112211. doi:10.1016/j.isci.2025.112211
^ Rosenberg E., Zilber-Rosenberg I. Reconstitution and transmission of gut microbiomes and their genes between generations. Microorganisms 2021;10(1):70. doi:10.3390/microorganisms10010070
^ Goedert J.J. Intestinal microbiota and health of adults who were born by cesarean delivery. JAMA Pediatr 2016;170(10):1027. doi:10.1001/jamapediatrics.2016.2310
^ ab Zhang C., Li L., Jin B., Xu X., Zuo X., Li Y., Li Z. The effects of delivery mode on the gut microbiota and health: state of art. Front Microbiol 2021;12:724449. doi:10.3389/fmicb.2021.724449
^ Asnicar F., Manara S., Zolfo M., et al. Studying vertical microbiome transmission from mothers to infants by strain-level metagenomic profiling. mSystems 2017;2(1):e00164-16. doi:10.1128/mSystems.00164-16
^ ab Pannaraj P.S., Li F., Cerini C., et al. Association between breast milk bacterial communities and establishment and development of the infant gut microbiome. JAMA Pediatr 2017;171(7):647-654. doi:10.1001/jamapediatrics.2017.0378
^ Donald K., Finlay B.B. Early-life interactions between the microbiota and immune system: impact on immune system development and atopic disease. Nat Rev Immunol 2023;23(11):735-748. doi:10.1038/s41577-023-00874-w
^ Huurre A., Kalliomäki M., Rautava S., Rinne M., Salminen S., Isolauri E. Mode of delivery-effects on gut microbiota and humoral immunity. Neonatology 2008;93:236-240. doi:10.1159/000111102
^ Lai C., Huang L., Wang Y., Huang C., Luo Y., Qin X., Zeng J. Effect of different delivery modes on intestinal microbiota and immune function of neonates. Sci Rep 2024;14(1):17452. doi:10.1038/s41598-024-68599-x
^ Breitbart M., Haynes M., Kelley S., et al. Viral diversity and dynamics in an infant gut. Res Microbiol 2008;159:367-373. doi:10.1016/j.resmic.2008.04.006
^ ab Mills S., Shanahan F., Stanton C., Hill C., Coffey A., Ross R.P. Movers and shakers: influence of bacteriophages in shaping the mammalian gut microbiota. Gut Microbes 2013;4(1):4-16. doi:10.4161/gmic.22371
^ Redgwell T.A., Thorsen J., Petit M.A., et al. Prophages in the infant gut are pervasively induced and may modulate the functionality of their hosts. NPJ Biofilms Microbiomes 2025;11(1):46. doi:10.1038/s41522-025-00674-1
^ Koenig J.E., Spor A., Scalfone N., Fricker A.D., Stombaugh J., Knight R., Angenent L.T., and Ley R.E. Succession of microbial consortia in the developing infant gut microbiome. Proc Natl Acad Sci 2011;108(1):4578-4585. doi:10.1073/pnas.1000081107
^ Tarracchini C., Milani C., Lugli G.A., Mancabelli L., Turroni F., van Sinderen D., Ventura M. The infant gut microbiota as the cornerstone for future gastrointestinal health. Adv Appl Microbiol 2024;126:93-119. doi:10.1016/bs.aambs.2024.02.001
^ Saturio S., Nogacka A.M., Alvarado-Jasso G.M., Salazar N., de Los Reyes-Gavilán C.G., Gueimonde M., Arboleya S. Role of Bifidobacteria on infant health. Microorganisms 2021;9(12):2415. doi:10.3390/microorganisms9122415
^ Dargenio V.N., Cristofori F., Brindicci V.F., Schettini F., Dargenio C., Castellaneta S.P., Iannone A., Francavilla R. Impact of Bifidobacterium longum Subspecies infantis on pediatric gut health and nutrition: current evidence and future directions. Nutrients 2024;16(20):3510. doi:10.3390/nu16203510
^ Stinson L.F., Norrish I., Mhembere F., Cheema A.S., Mullally C.A., Payne M.S., Geddes D.T. Seeding and feeding: nutrition and birth-associated exposures shape gut microbiome assembly in breastfed infants. Gut Microbes 2025;17(1):2557981. doi:10.1080/19490976.2025.2557981
^ ab Kennedy E.A., Holtz L.R. Gut virome in early life: origins and implications. Curr Opin Virol 2022;55:101233. doi:10.1016/j.coviro.2022.101233
^ Shkoporov A.N., Clooney A.G., Sutton T.D.S., et al. The human gut virome is highly diverse, stable, and individual specific. Cell Host Microbe 2019;26(4):527-541.e5. doi:10.1016/j.chom.2019.09.009
^ Sekirov I., Russell S.L., Antunes L.C., Finlay B.B. Gut microbiota in health and disease. Physiol Rev 2010;90(3):859-904. doi:10.1152/physrev.00045.2009
^ Vallès Y., Artacho A., Pascual-García A., Ferrús M.L., Gosalbes M.J., Abellán J.J., Francino M.P. Microbial succession in the gut: directional trends of taxonomic and functional change in a birth cohort of Spanish infants. PLoS Genet 2014;10(6):e1004406. doi:10.1371/journal.pgen.1004406
^ Fusco W., Lorenzo M.B., Cintoni M., et al. Short-chain fatty-acid-producing bacteria: key components of the human gut microbiota. Nutrients 2023;15(9):2211. doi:10.3390/nu15092211
^ Derrien M., Alvarez A.S., de Vos W.M. The gut microbiota in the first decade of life. Trends Microbiol 2019;27(12):997-1010. doi:10.1016/j.tim.2019.08.001
^ ab Yao Y., Cai X., Ye Y., Wang F., Chen F., Zheng C. The role of microbiota in infant health: from early life to adulthood. Front Immunol 2021;12:708472. doi:10.3389/fimmu.2021.708472
^ ab Hou K., Wu Z.X., Chen X.Y., et al. Microbiota in health and diseases. Signal Transduct Target Ther 2022;7(1):135. doi:10.1038/s41392-022-00974-4
^ Augustynowicz G., Lasocka M., Szyller H.P., Dziedziak M., Mytych A., Braksator J., Pytrus T. The role of gut microbiota in the development and treatment of obesity and overweight: a literature review. J Clin Med 2025;14(14):4933. doi:10.3390/jcm14144933
^ ab De Filippo C., Cavalieri D., Di Paola M., et al. Impact of diet in shaping gut microbiota revealed by a comparative study in children from Europe and rural Africa. Proc Natl Acad Sci 2010;107(33):14691-14696. doi:10.1073/pnas.1005963107
^ Sharon I., Quijada N.M., Pasolli E., et al. The core human microbiome: does it exist and how can we find it? A critical review of the concept. Nutrients 2022;14(14):2872. doi:10.3390/nu14142872
^ ab David L.A., Maurice C.F., Carmody R.N., et al. Diet rapidly and reproducibly alters the human gut microbiome. Nature 2014;505(7484):559-63. doi:10.1038/nature12820
^ Sommer F., Anderson J.M., Bharti R., Raes J., Rosenstiel P. The resilience of the intestinal microbiota influences health and disease. Nat Rev Microbiol 2017;15(10):630-638. doi:10.1038/nrmicro.2017.58
^ Mangiola F., Nicoletti A., Gasbarrini A., Ponziani F.R. Gut microbiota and aging. Eur Rev Med Pharmacol Sci 2018;22(21):7404-7413. doi:10.26355/eurrev_201811_16280
^ Claesson M.J., Cusack S., O’Sullivan O., et al. Composition, variability, and temporal stability of the intestinal microbiota of the elderly. Proc Natl Acad Sci USA 2011;108(Suppl 1);4586-4591. doi:10.1073/pnas.1000097107
^ Salazar N., Valdés-Varela L., González S., Gueimonde M., de Los Reyes-Gavilán C.G. Nutrition and the gut microbiome in the elderly. Gut Microbes. 2017;8(2):82-97. doi:10.1080/19490976.2016.1256525
^ Santacroce L., Topi S., Bottalico L., Charitos I.A., Jirillo E. Current knowledge about gastric microbiota with special emphasis on Helicobacter pylori-related gastric conditions. Curr Issues Mol Biol 2024;46(5):4991-5009. doi:10.3390/cimb46050299
^ Yang K., Li G., Li Q., et al. Distribution of gut microbiota across intestinal segments and their impact on human physiological and pathological processes. Cell Biosci 2025;15(1):47. doi:10.1186/s13578-025-01385-y
^ Portincasa P., Bonfrate L., Khalil M., Angelis M., Calabrese F.M., D’Amato M., Wang D.Q., Di Ciaula A. Intestinal barrier and permeability in health, obesity and NAFLD. Biomedicines 2021;10(1):83. doi:10.3390/biomedicines10010083
^ Kastl A.J. Jr, Terry N.A., Wu G.D., Albenberg L.G. The structure and function of the human small intestinal microbiota: current understanding and future directions. Cell Mol Gastroenterol Hepatol 2020;9(1):33-45. doi:10.1016/j.jcmgh.2019.07.006
^ Donaldson G.P., Lee S.M., Mazmanian S.K. Gut biogeography of the bacterial microbiota. Nat Rev Microbiol 2016;14(1):20-32. doi:10.1038/nrmicro3552
^ Leite G., Morales W., Weitsman S., Celly S, et al. The duodenal microbiome is altered in small intestinal bacterial overgrowth. PLoS One 2020;15(7):e0234906. doi:10.1371/journal.pone.0234906
^ Zhang L., Tuoliken H., Li J., Gao H. Diet, gut microbiota, and health: a review. Food Sci Biotechnol 2024;34(10):2087-2099. doi:10.1007/s10068-024-01759-x
^ ab Wu G.D., Chen J., Hoffmann C., et al. Linking long-term dietary patterns with gut microbial enterotypes. Science 2011;334:105-108. doi:10.1126/science.1208344
^ Consales A., Cerasani J., Sorrentino G., Morniroli D., Colombo L., Mosca F., Giannì M.L. The hidden universe of human milk microbiome: origin, composition, determinants, role, and future perspectives. Eur J Pediatr 2022;181(5):1811-1820. doi:10.1007/s00431-022-04383-1
^ Fernández L., Langa S., Martín V., Maldonado A., Jiménez E., Martín R., Rodríguez J.M. The human milk microbiota: origin and potential roles in health and disease. Pharmacol Res 2013;69(1):1-10. doi:10.1016/j.phrs.2012.09.001
^ Newburg D.S., Morelli L. Human milk and infant intestinal mucosal glycans guide succession of the neonatal intestinal microbiota. Pediatr Res 2015;77:115-120. doi:10.1038/pr.2014.178
^ Donald K., Finlay B.B. Early-life interactions between the microbiota and immune system: impact on immune system development and atopic disease. Nat Rev Immunol 2023;23(11):735-748. doi:10.1038/s41577-023-00874-w
^ ab De Filippo C., Di Paola M., Ramazzotti M., et al. Diet, environments, and gut microbiota. A preliminary investigation in children living in rural and urban Burkina Faso and Italy. Front Microbiol 2017;8:1979. doi:10.3389/fmicb.2017.01979
^ Rodriguez C.I., Isobe K., Martiny J.B.H. Short-term dietary fiber interventions produce consistent gut microbiome responses across studies. mSystems 2024;9(6):e0013324. doi:10.1128/msystems.00133-24
^ Cao Y., Shen J., Ran Z.H. Association between Faecalibacterium prausnitzii reduction and inflammatory bowel disease: a meta-analysis and systematic review of the literature. Gastroenterol Res Pract 2014;2014:872725. doi:10.1155/2014/872725
^ Lavelle A., Sokol H. Gut microbiota-derived metabolites as key actors in inflammatory bowel disease. Nat Rev Gastroenterol Hepatol 2020;17(4):223-237. doi:10.1038/s41575-019-0258-z
^ Emencheta S.C., Olovo C.V., Eze O.C., et al. The role of bacteriophages in the gut microbiota: implications for human health. Pharmaceutics 2023;15(10):2416. doi:10.3390/pharmaceutics15102416
^ Mills S., Ross R.P., Hill C. Bacteriocins and bacteriophage; a narrow-minded approach to food and gut microbiology. FEMS Microbiol Rev 2017;41(1):S129-S153. doi:10.1093/femsre/fux022
^ Fallani M., Young D., Scott J., et al. Intestinal microbiota of 6-week-old infants across Europe: geographic influence beyond delivery mode, breast-feeding, and antibiotics. J Pediatr Gastroenterol Nutr 2010;51(1):77-84. doi:10.1097/MPG.0b013e3181d1b11e
^ Gupta V.K., Paul S., Dutta C. Geography, ethnicity or subsistence-specific variations in human microbiome composition and diversity. Front Microbiol 2017;8:1162. doi:10.3389/fmicb.2017.01162
It has been known for almost a century that humans harbor a microbial ecosystem, known as human microbiota, remarkably dense and diverse, made up of a number of viruses and cells much higher than those of the human body, and that accounts for one to three percent of body weight.
All the genes encoded by the human body’s microbial ecosystem, which are about 1,000 times more numerous than those of our genome, make up the human microbiome.
Microorganisms colonize all the surfaces of the body that are exposed to the environment. Indeed, distinct microbial communities are found on the skin, in the vagina, in the respiratory tract, and along the whole intestinal tract, from the mouth up to rectum, the last part of the intestine.
The human microbiota consists of organisms from all taxa, namely, bacteria, viruses, archaea, and eukaryotes.
Bacteria
Bacteria are at least 100 trillion (1014) cells, a number ten times greater than that of the human body.
They are found in very high concentration in the intestinal tract, up to 1012-1014/gram of tissue, where they form one of the most densely populated microbial habitats on Earth. In the gut, bacteria mainly belong to the Firmicutes, Bacteroidetes and Actinobacteria phyla. Fusobacteria (oropharynx), Tenericutes, Proteobacteria, and Verrucomicrobia are other phyla present in our body.
Note: Bacterial communities in a given body region resemble themselves much more across individuals than those from different body regions of the same individual; for example, bacterial communities of the upper respiratory tract are much more similar across individuals than those of the skin or intestine of the same individual.
Viruses
They are by far the most numerous organisms, being present with quadrillion units. The genomes of all the viruses harbored in the human body make up the human virome.
In the past, viruses and eukaryotes have been studied focusing on pathogenic microorganisms, but in recent years the attention has also shifted on many non-pathogenic members of these groups. And many of the viral gene sequences found are new, which suggests that there is still much to learn about the human virome.
Finally, just like for bacteria, there is considerable interpersonal variability.
Archaebacteria
Archaebacteria or Archaea are mainly those belonging to the order Methanobacteriales. Among the latter, Methanobrevibacter smithii is predominant in the human gut, representing up to 10 percent of all anaerobes.
Eukaryotes
Eukaryotes are also present, and the parasites of the genera Giardia and Entamoeba have probably been among the first to be identified. But there is also a great abundance and diversity of fungal species, belonging to genera such as Candida, Penicillium, Aspergillus, Hemispora, Fusarium, Geotrichum, Hormodendrum, Cryptococcus, Saccharomyces, and Blastocystis.
Candida albicans
Function of the human microbiota
Sometimes referred to as “the forgotten organ”, human microbiota, mainly with its intestinal bacterial members, plays many important functions that can lead to nutritional, immunological, and developmental benefits, but can also cause diseases. Here are some examples.
It is involved in the development of the gastrointestinal system of the newborn, as shown by experiments carried out on germ-free animals in which, for example, the thickness of the intestinal mucosa is thinner than that of colonized animals, therefore more easily subject to rupture.
It contributes to energy harvest from nutrients, due to its ability to ferment indigestible carbohydrates, promote the absorption of monosaccharides and the storage of the derived energy. This has probably been a very strong evolutionary force that has played a major role in favor of the fact that these bacteria became our symbionts.
It contributes to the maintenance of the acidic pH of the skin and in the colon.
It is involved in the metabolism of xenobiotics and several polyphenols.
It improves water and mineral absorption in the colon.
It increases the speed of intestinal transit, slower in germ-free animals.
It has an important role in resistance to colonization by pathogens, primarily in the vagina and gut.
It is involved in the biosynthesis of isoprenoids and vitamins through the methylerythritol phosphate pathway.
It stimulates angiogenesis.
In the intestinal tract, it interacts with the immune system, providing signals for promoting the maturation of immune cells and the normal development of immune functions. And this is perhaps the most important effect of the symbiosis between the human host and microorganisms. Experiments carried out on germ-free animals have shown, for example, that:
macrophages, the cells that engulf pathogens and then present their antigens to the immune system, are found in much smaller amounts than those present in the colonized intestine, and if placed in the presence of bacteria they fail to find and therefore engulf them, unlike macrophages extracted from a colonized intestine;
there is not the chronic non-specific inflammation, present in the normal intestine as a result of the presence of bacteria (and of what we eat).
Changes in its composition can contribute to the development of obesity and metabolic syndrome.
It protects against the development of type I diabetes.
Many diseases, both in children and adults, such as stomach cancer, lymphoma of mucosa-associated lymphoid tissue, necrotizing enterocolitis, an important cause of morbidity and mortality in premature babies, or chronic intestinal diseases, are, and others seem to be, related to the gut microbiota.
In conclusion, it seems very likely that the human body represents a superorganism, result of years of evolution and made up of human cells, and the resulting metabolic and physiological capacities, as well as an additional organ, the microbiota.
Commensals and pathogens
Based on the relationships with the human host, microorganisms may be classified as commensals or pathogens.
Commensals cause no harm to the host, with which they establish a symbiotic relationship that generally brings benefits to both.
On the contrary, pathogens are able to cause diseases, but fortunately represent a small percentage of the human microbiota.
These microorganisms establish a symbiosis with the human host and benefit from it at the expense of the host. They can cause disease:
if they move from their niche, such as the intestine, into another one where they do not usually reside, such as the vagina or bladder, as in the case of Candida albicans, normally present in the intestine, but in very small quantities;
in patients with impaired immunological defenses, such as after an immunosuppressive therapy.
Human Microbiome Project
The bacterial component of the human microbiota is the subject of most studies including a large-scale project started in 2008 called “Human Microbiome Project”, whose aim is to characterize the microbiome associated with multiple body sites, such as the skin, mouth, nose, vagina and intestine, in 242 healthy adults.
These studies have shown a great variability in the composition of the human microbiota. For example, twins share less than 50 percent of their bacterial taxa at the species level, and an even smaller percentage of viruses.
The factors that shape the composition of bacterial communities begin to be understood: for example, the genetic characteristics of the host play an important, although this is not true for the viral community. And metagenomic studies have shown that, despite the great interpersonal variability in microbial community composition, there is a core of shared genes encoding signaling and metabolic pathways. It appears namely that the assembly and the structure of the microbial community does not occur according to the species but the more functional set of genes.
Therefore, disease states of these communities might be better identified by atypical distribution of functional classes of genes.
Effect of antibiotics
The microbiota in healthy adult humans is generally stable over time. However, its composition can be altered by factors such as dietary changes, urbanization, travel, and especially the use of broad-spectrum antibiotics. Here are some examples of the effect of antibiotic treatments.
There is a long-term reduction in microbial diversity.
The taxa affected vary from individual to individual, even up to a third of the taxa.
Several taxa do not recover even after 6 months from treatment.
Once the bacterial communities have reshaped, a reduced resistance to colonization occurs. This allows foreign and/or pathogen bacteria, able to grow more than the commensals, to cause permanent changes in human microbiota structure, as well as acute diseases, such as the dangerous pseudomembranous colitis, and chronic diseases, as it is suspected for asthma following the use and abuse of antibiotics in childhood. Moreover, their repeated use has been suggested to increase the pool of antibiotic-resistance genes in our microbiome. In support of this hypothesis, a decrease in the number of antibiotic-resistant pathogens has been observed in some European countries following the reduction in the number of antibiotics prescribed.
Finally, you must not underestimate the fact that the intestinal microflora is involved in many chemical transformations, and its alteration could be implicated in the development of cancer and obesity. However, regarding use of antibiotics, you should be underlined that if western population has a life expectancy higher than in the past is also because you do not die of infectious diseases!
References
Burke C., Steinberg P., Rusch D., Kjelleberg S., and Thomas T. Bacterial community assembly based on functional genes rather than species. Proc Natl Acad Sci USA 2011;108:14288-14293. doi:10.1073/pnas.1101591108
Clemente J.C., Ursell L.K., Wegener Parfrey L., and Knight R. The impact of the gut microbiota on human health: an integrative view. Cell 2012;148:1258-1270. doi:10.1016/j.cell.2012.01.035
Gill S.R., Pop M., Deboy R.T., Eckburg P.B., Turnbaugh P.J., Samuel B.S., Gordon J.I., Relman D.A., Fraser-Liggett C.M., and Nelson K.E. Metagenomic analysis of the human distal gut microbiome. Science 2006;312:1355-1359. doi:10.1126/science.1124234
Palmer C., Bik E.M., DiGiulio D.B., Relman D.A., and Brown P.O. Development of the human infant intestinal microbiota. PLoS Biol 2007;5(7):e177. doi:10.1371/journal.pbio.0050177
Turnbaugh P.J., Gordon J.I. The core gut microbiome, energy balance and obesity. J Physiol 2009;587:4153-4158. doi:10.1113/jphysiol.2009.174136
Zhang, T., Breitbart, M., Lee, W., Run, J.-Q., Wei, C., Soh, S., Hibberd, M., Liu, E., Rohwer, F., Ruan, Y. Prevalence of plant viruses in the RNA viral community of human feces. PLoS Biol 2006;4(1):e3. doi:10.1371/journal.pbio.0040003
Olive oil is a liquid fat obtained by pressing whole olives, the fruit of the olive tree (Olea europaea).[1][2]
It is a staple ingredient in Mediterranean diet and is widely used for cooking, salad dressings, and other culinary purposes. Olive oil is also known for its health benefits, as it is rich in monounsaturated fats and antioxidants.[3]
From a chemical point of view, two fractions can be identified in olive oil, depending on their behavior in the presence of heat and strong alkaline solutions:
the saponifiable fraction, which represents 98−99% of the total weight, is composed of lipids that form soaps under the above conditions;
the unsaponifiable fraction, which represents the remaining 1−2% of the total weight, composed of substances that do not form soaps under the above conditions.[4][5]
It is composed of saturated and unsaturated fatty acids, esterified almost entirely to glycerol to form triglycerides or triacylglycerols. To a much lesser extent, diglycerides (or diacylglycerols), monoglycerides (or monoacylglycerols), and free fatty acids are also present.[4]
IOOC Requirements: Allowable fatty acid ranges in olive oil
Fatty acid
Number of carbons
Allowable range (%)
Myristic acid
C14:0
<0.03
Palmitic acid
C16:0
7.5−20
Palmitoleic acid
C16:1
0.3−3.5
Heptadecanoic acid
C17:0
≤0.3
Heptadecenoic acid
C17:1
≤0.3
Stearic acid
C18:0
0.5−5.0
Oleic acid
C18:1
55.0−83.0
Linoleic acid
C18:2
2.5−21.0
α-Linolenic acid
C18:3
≤1.0
Arachidic acid
C20:0
≤0.6
Gadoleic acid
C20:1
≤0.4
Behenic acid
C22:0
≤0.2
Lignoceric acid
C24:0
≤0.2
Unsaturated and saturated fatty acids
Oleic acid is the major fatty acid in olive oil.[7] According to the rules laid down by the International Olive Oil Council (IOOC), its concentration must range from 55 to 83% of total fatty acids.
Linoleic acid is the most abundant polyunsaturated fatty acid in olive oil; its concentration must vary between 2.5 and 21% (IOOC). Because of its high degree of unsaturation, it is prone to oxidation; this means that an oil rich in linoleic acid becomes rancid more easily and therefore has a shorter shelf life.[8]
In Mediterranean cuisine, olive oil is the main source of fat; therefore, oleic acid (among monounsaturated fatty acids) and linoleic acid (among polyunsaturated fatty acids) are the most abundant fatty acids.
α-Linolenic acid must be present in very small amounts, according to IOOC standards (≤1 percent). It is an omega-3 polyunsaturated fatty acid that may have health benefits. However, because of its high degree of unsaturation, higher than that of linoleic acid, it is very susceptible to oxidation and therefore promotes rancidity in olive oil containing it.
The presence of fatty acids that should be absent or are found in abnormal amounts is a marker of adulteration with other vegetable oils. In this regard, particular attention is paid to myristic, arachidic, behenic, lignoceric, gadoleic, and α-linolenic acids, whose limits are set by the IOOC.[6]
Factors influencing fatty acid profile
Fatty acid composition is influenced by several factors:
the climate;
the latitude;
the zone of production.
Italian, Spanish, and Greek olive oils are high in oleic acid and low in palmitic and linoleic acids, while Tunisian olive oils are high in palmitic and linoleic acids but lower in oleic acid. Therefore, oils can be divided into two groups:
those rich in oleic acid and low in palmitic and linoleic acids;
those high in palmitic and linoleic acids and low in oleic acid.[9][10]
Other influencing factors include:
the cultivar;
the degree of olive ripeness at the time of oil extraction.[7][11]
It should be noted that oleic acid is formed first in the fruit, and data seem to indicate a competitive relationship between oleic acid and palmitic, palmitoleic, and linoleic acids.[8]
Triglycerides
As previously mentioned, fatty acids in olive oil are almost entirely present as triglycerides.
In small percentages, they are also present as diglycerides, monoglycerides, and in free form.[12]
The sn Positions of Triglycerides
During triglyceride biosynthesis, thanks to the action of specific enzymes, only about 2% of glycerol molecules bind palmitic acid at the sn-2 position. The percentage of stearic acid in the sn-2 position is also very low. For the most part, the sn-2 position is occupied by oleic acid.[4][13]
Conversely, in oils that have undergone nonenzymatic esterification, the percentage of palmitic acid in the sn-2 position increases significantly.[11]
Note: sn = stereospecific numbering
The relative abundance of olive oil triglycerides is well characterized and standardized by the International Olive Oil Council. Among the triglycerides present in significant proportions in olive oil, the following are the most abundant:
OOO: 40−59%;
POO: 12−20%;
OOL: 12.5−20%;
POL: 5.5−7%;
SOO: 3−7%.
POP, POS, OLnL, OLnO, PLL, and PLnO are present in smaller amounts.[6]
Trilinolein (LLL) is a triglyceride that contains three molecules of linoleic acid; its low content is an indicator of good-quality oil.
Triglycerides containing three saturated fatty acids or three molecules of α-linolenic acid have not been reported.[14]
Diglycerides and monoglycerides
Their presence is due to incomplete synthesis and/or partial hydrolysis of triglycerides.
The content of diglycerides in virgin olive oil ranges from 1 to 2.8%. 1,2-Diglycerides prevail in fresh olive oil, representing over 80% of total diglycerides.[15]
During storage, isomerization occurs with a progressive increase in the more stable 1,3-isomers, which after about 10 months become the predominant form. Therefore, the 1,2/1,3-diglyceride ratio may be used as an indicator of the age of the oil.
Monoglycerides are present in amounts lower than diglycerides (<0.25%), with 1-monoglycerides being far more abundant than 2-monoglycerides.[16]
Unsaponifiable fractions
This fraction is composed of a large number of different molecules, which play a key nutritional role, as they contribute significantly to the health benefits of olive oil. Furthermore, they are responsible for the stability and taste of olive oil and are also used to detect adulteration with other vegetable oils.[4]
It includes tocopherols, sterols, polyphenols, pigments, hydrocarbons, aromatic and aliphatic alcohols, triterpene acids, waxes, and other minor constituents.[17]
Their content is influenced by factors similar to those affecting fatty acid composition, such as:
It should be noted that many of these compounds are not present in refined olive oils, as they are removed during the refining process.[11]
Polyphenols
Polyphenols make up 18 to 37% of the unsaponifiable fraction.
They are a very heterogeneous group of molecules with nutritional and organoleptic properties; for example, oleuropein and hydroxytyrosol give olive oil its bitter and pungent taste.[5][18]
For a more detailed discussion, see the article Polyphenols in olive oil.
Hydrocarbons
Hydrocarbons make up 30 to 50% of the unsaponifiable fraction.
Squalene and β-carotene are the main compounds.[19]
Squalene, first isolated from shark liver, is the major constituent of the unsaponifiable fraction, accounting for more than 90% of the hydrocarbons. Its concentration ranges from 200 to 7,500 mg/kg of olive oil.[20]
It is an intermediate in the biosynthesis of the four-ring structure of steroids and appears to be responsible for several of the health benefits attributed to olive oil.[21]
In the hydrocarbon fraction of virgin olive oil, n-paraffins, diterpene and triterpene hydrocarbons, and isoprenoid polyolefins are also found.[22]
Sterols
Sterols are important lipids of olive oil. They are:
linked to many health benefits for consumers;
important for the quality of the oil;
widely used to verify its authenticity.
In this regard, it should be emphasized that sterols are species-specific molecules. For example, the presence of high concentrations of brassicasterol, a sterol typically found in the Brassicaceae (Cruciferae) family, such as rapeseed, indicates adulteration of olive oil with canola oil.[11]
Four classes of sterols are present in olive oil: common sterols, 4-methylsterols, triterpene alcohols, and triterpene dialcohols.[22]
Their total content ranges from 1,000 mg/kg (the minimum value required by IOOC standards) to 2,000 mg/kg. The lowest values are found in refined oils, since the refining process may cause losses of up to 25%.[6][23][24]
Common sterols or 4-α-desmethylsterols
Common sterols are present mainly in free and esterified forms; however, they have also been detected as lipoproteins and steryl glucosides.
The main molecules are β-sitosterol, which makes up 75–90% of the total sterols; Δ5-avenasterol, 5–20%, and campesterol, about 4%.
Other components found in smaller or trace amounts include stigmasterol (≈ 2%), cholesterol, brassicasterol, and ergosterol.[24]
4-Methylsterols
These compounds are intermediates in sterol biosynthesis and are present in both free and esterified forms.[24]
They occur in small amounts, much lower than those of common sterols and triterpene alcohols, ranging from 50 to 360 mg/kg.
The main molecules are obtusifoliol, cycloeucalenol, citrostadienol, and gramisterol.[22]
Triterpene alcohols or 4,4-dimethylsterols
This is a complex class of sterols, present in both free and esterified forms.
They are found in amounts ranging from 350 to 1,500 mg/kg. The main components are β-amyrin, 24-methylenecycloartanol, cycloartenol, and butyrospermol. Other molecules present in lower or trace amounts include cyclosadol, cyclobranol, germanicol, and dammaradienol.[22]
Triterpene dialcohols
The main triterpene dialcohols found in olive oil are erythrodiol and uvaol.
Erythrodiol occurs in both free and esterified forms; in virgin olive oil, its content ranges from 19 to 69 mg/kg, and the free form is generally lower than 50 mg/kg.[22][23]
Tocopherols
Tocopherols make up 2 to 3% of the unsaponifiable fraction and include vitamin E.[4]
Of the eight E-vitamers, α-tocopherol represents about 90% of total tocopherols in virgin olive oil. It is present in the free form and in variable amounts, generally exceeding 100 mg/kg of olive oil.[25]
Thanks to its in vivo antioxidant properties, its presence is a protective factor for health.[26]
The α-tocopherol concentration appears to be related to the high levels of chlorophylls and the concurrent need for singlet oxygen deactivation.[27]
β-Tocopherol, δ-tocopherol, and γ-tocopherol are usually present in small amounts.[22]
Pigments
In this group we find chlorophylls and carotenoids.
In olive oil, chlorophylls are present as pheophytins, mainly pheophytin A, a chlorophyll molecule in which magnesium has been replaced by two hydrogen ions, and they confer the characteristic green color to olive oil.
They act as photosensitizers, contributing to the photooxidation of the oil itself.[28][29]
β-Carotene and lutein are the main carotenoids in olive oil. Several xanthophylls are also present, such as antheraxanthin, β-cryptoxanthin, luteoxanthin, mutatoxanthin, neoxanthin, and violaxanthin.[30]
The color of olive oil results from the presence of chlorophylls and carotenoids and from their combined green and yellow hues.[31]
Triterpene acids
These are important components of olives and are present in trace amounts in the oil. Oleanolic and maslinic acids are the main triterpene acids in virgin olive oil; they are found in the olive husk and are extracted in small quantities during processing.[32]
Aliphatic and aromatic alcohols
The most important are fatty alcohols and diterpene alcohols.
Aliphatic alcohols contain between 20 and 30 carbon atoms and are found mainly inside the olive stones, from which they are partially extracted during milling.[4]
Fatty alcohols
These are linear saturated alcohols containing more than 16 carbon atoms.
They occur in both free and esterified forms and, in virgin olive oil, are generally present at concentrations not exceeding 250 mg/kg.
Docosanol, tetracosanol, hexacosanol, and octacosanol are the main fatty alcohols in olive oil, with tetracosanol and hexacosanol being the most abundant.
Waxes, which are minor constituents of olive oil, are esters of fatty alcohols with fatty acids, mainly palmitic and oleic acids.
They can be used as a criterion to distinguish between different types of oils; for example, according to IOOC standards, they must be present in virgin and extra virgin olive oil at levels below 150 mg/kg.[11]
Diterpene alcohols
Geranylgeraniol and phytol are two acyclic diterpene alcohols, present in both free and esterified forms.
Among the esters present in the wax fraction of extra virgin olive oil, oleate, eicosenoate, eicosanoate, docosanoate, and tetracosanoate have been identified, mainly as phytyl derivatives.[11]
Volatile compounds
More than 280 volatile compounds have been identified in olive oil, including hydrocarbons (the most abundant fraction), alcohols, aldehydes, ketones, esters, acids, ethers, and many others.
However, only about 70 compounds are present at levels above the perception threshold, beyond which they contribute to the aroma of virgin olive oil.[33][34]
Minor components
Among the minor components of olive oil are phospholipids, mainly phosphatidylserine, phosphatidylethanolamine, phosphatidylcholine, and phosphatidylinositol.
In unfiltered oils, trace amounts of proteins may also be found.[4]
^ Mazzocchi A., Leone L., Agostoni C., Pali-Schöll I. The secrets of the Mediterranean diet. Does [only] olive oil matter? Nutrients 2019;11(12):2941. doi:10.3390/nu11122941
^ abcdefg Gunstone F.D. Vegetable oils in food technology: composition, properties and uses. 2nd Edition. Wiley J. & Sons, Inc., Publication, 2011.
^ ab Bulotta S., Celano M., Lepore S.M., Montalcini T., Pujia A., Russo D. Beneficial effects of the olive oil phenolic components oleuropein and hydroxytyrosol: focus on protection against cardiovascular and metabolic diseases. J Transl Med 2014;12:219. doi:10.1186/s12967-014-0219-9
^ ab Tomé-Rodríguez S., Barba-Palomeque F., Ledesma-Escobar C.A., Miho H., Díez C.M., Priego-Capote F. Influence of genetic and interannual factors on the fatty acids profile of virgin olive oil. Food Chem 2023;422:136175. doi:10.1016/j.foodchem.2023.136175
^ ab Hernández M.L., Sicardo M.D., Belaj A., Martínez-Rivas J.M. The oleic/linoleic acid ratio in olive (Olea europaea L.) fruit mesocarp is mainly controlled by OeFAD2-2 and OeFAD2-5 genes together with the different specificity of extraplastidial acyltransferase enzymes. Front Plant Sci 2021;12:653997. doi:10.3389/fpls.2021.653997
^ Cetinkaya H., Kulak M. Soil characteristics influence the fatty acid profile of olive oils. Scientific Papers. Series B, Horticulture. 2016;60:53-57. Available at: https://www.researchgate.net/publication/387363822
^ Ben Hmida R., Gargouri B., Chtourou F., Sevim D., Bouaziz M. Fatty acid and triacyglycerid as markers of virgin olive oil from mediterranean region: traceability and chemometric authentication. Eur Food Res Technol 2022;248:1-16. doi:10.1007/s00217-022-04002-1
^ abcdefg Boskou D. Olive oil: chemistry and technology. 3rd Edition, AOCS Press, 2015.
^ Lukić I., Da Ros A., Guella G., Camin F., Masuero D., Mulinacci N., Vrhovsek U., Mattivi F. Lipid profiling and stable isotopic data analysis for differentiation of extra virgin olive oils based on their origin. Molecules 2019;25(1):4. doi:10.3390/molecules25010004
^ Karupaiah T., Sundram K. Effects of stereospecific positioning of fatty acids in triacylglycerol structures in native and randomized fats: a review of their nutritional implications. Nutr Metab (Lond) 2007;4:16. doi:10.1186/1743-7075-4-16
^ Jawad M.A., Jawhar A., Dakah A., Ejbara M.G. Effect of maturity stages on triglyceride and fatty acid profiles in olive oil from Zaity and Kaissy varieties grown in Syria. Sci Rep 2025;15(1):35935. doi:10.1038/s41598-025-20162-y
^ Caponio F., Bilancia M.T., Pasqualone A., Sikorska E., Gomes T. Influence of the exposure to light on extra virgin olive oil quality during storage. Eur Food Res Technol 2005;221:92-98. doi:10.1007/s00217-004-1126-8
^ Talarico I.R., Bartella L., Rocio-Bautista P., Di Donna L., Molina-Diaz A., Garcia-Reyes J.F. Paper spray mass spectrometry profiling of olive oil unsaponifiable fraction for commercial categories classification. Talanta 2024;267:125152. doi:10.1016/j.talanta.2023.125152
^ Servili M., Sordini B., Esposto S., Urbani S., Veneziani G., Di Maio I., Selvaggini R. and Taticchi A. Biological activities of phenolic compounds of extra virgin olive oil. Antioxidants 2014;3:1-23. doi:10.3390/antiox3010001
^ Barp L., Miklavčič Višnjevec A., Moret S. Analytical determination of Squalene in extra virgin olive oil and olive processing by-products, and its valorization as an ingredient in functional food – A critical review. Molecules 2024;29(21):5201. doi:10.3390/molecules29215201
^ Hernández M.L., Muñoz-Ocaña C., Posada P., et al. Functional characterization of four olive squalene synthases with respect to the squalene content of the virgin olive oil. J Agric Food Chem 2023;71(42):15701-15712. doi:10.1021/acs.jafc.3c05322
^ Ibrahim N., Fairus S., Zulfarina M.S., Naina Mohamed I. The efficacy of squalene in cardiovascular disease risk – A systematic review. Nutrients 2020;12(2):414. doi:10.3390/nu12020414
^ abcdef Jimenez-Lopez C., Carpena M., Lourenço-Lopes C., Gallardo-Gomez M., Lorenzo J.M., Barba F.J., Prieto M.A., Simal-Gandara J. Bioactive compounds and quality of extra virgin olive oil. Foods 2020;9(8):1014. doi:10.3390/foods9081014
^ abc Lukić M., Lukić I., Krapac M., Sladonja B., Piližota V. Sterols and triterpene diols in olive oil as indicators of variety and degree of ripening. Food Chem 2013;136(1):251-8. doi:10.1016/j.foodchem.2012.08.005
^ Beltrán G., Jiménez A., del Rio C., Sánchez S., Martínez L. Variability of vitamin E in virgin olive oil by agronomical and genetic factors. J Food Compos Anal 2010;23(6):633-639. doi:10.1016/j.jfca.2010.03.003
^ Sánchez-Villegas A., Sánchez-Tainta A. Virgin olive oil. In the prevention of cardiovascular disease through the
Mediterranean diet. Academic Press. Cambridge, MA, USA, 2018;59-87.
^ Grams G.W., Eskins K. Dye-sensitized photooxidation of tocopherols. Correlation between singlet oxygen reactivity and vitamin E activity. Biochemistry 1972;11(4):606-8. doi:10.1021/bi00754a020
^ Giuliani A., Cerretani L., Cichelli A. Chlorophylls in olive and in olive oil: chemistry and occurrences. Crit Rev Food Sci Nutr 2011;51(7):678-90. doi:10.1080/10408391003768199
^ Díez-Betriu A., Bustamante J., Romero A., Ninot A., Tres A., Vichi S., Guardiola F. Effect of the storage conditions and freezing speed on the color and chlorophyll profile of premium extra virgin olive oils. Foods 2023;12(1):222. doi:10.3390/foods12010222
^ Gandul-Rojas B., Roca M., Gallardo-Guerrero L. Chlorophylls and carotenoids in food products from olive tree. In: Boskou D., Clodoveo M.L. Products from Olive Tree. IntechOpen, London, 2016. doi:10.5772/64688
^ Borello E., Roncucci D., Domenici V. Study of the evolution of pigments from freshly pressed to ‘on-the-shelf’ extra-virgin olive oils by means of near-UV visible spectroscopy. Foods 2021;10(8):1891. doi:10.3390/foods10081891
^ Sánchez-Quesada C., López-Biedma A., Warleta F., Campos M., Beltrán G., Gaforio J.J. Bioactive properties of the main triterpenes found in olives, virgin olive oil, and leaves of Olea europaea. J Agric Food Chem 2013;61(50):12173-82. doi:10.1021/jf403154e
^ Nardella M., Moscetti R., Bedini G., Bandiera A., Chakravartula S.S.N., Massantini R. Impact of traditional and innovative malaxation techniques and technologies on nutritional and sensory quality of virgin olive oil – A review. Food Chem Adv
Volume 2023;2:100163. doi:10.1016/j.focha.2022.100163
^ Angerosa F., Servili M., Selvaggini R., Taticchi A., Esposto S., Montedoro G. Volatile compounds in virgin olive oil: occurrence and their relationship with the quality. J Chromatogr A 2004;1054(1-2):17-31. doi:10.1016/j.chroma.2004.07.093
Gluten is not a single protein but a mixture of cereal proteins, about 80 percent of its dry weight, for example gliadins and glutenins in wheat grains, lipids, 5-7 percent, starch, 5-10 percent, water, 5-8 percent, and mineral substances, <2 percent.
It forms when components naturally present in the grain of cereals, the caryopsis, and in their flours, are joined together by means of mechanical stress in aqueous environment, i.e. during the formation of the dough.
The term is also related to the family of proteins that cause problems for celiac patients.
Isolated for the first time in 1745 from wheat flour by the Italian chemist Jacopo Bartolomeo Beccari, it can be extracted from the dough by washing it gently under running water: starch, albumins and globulins, that are water-soluble, are washed out, and a sticky and elastic mass remains, precisely the gluten, which means glue in Latin.
durum wheat (Triticum durum); groats and semolina for dry pasta making are obtained from it;
common wheat or bread wheat (Triticum aestivum), so called because it is used in bread and fresh pasta making, and in bakery products;
khorasan wheat (Triticum turanicum); a variety of it is Kamut®;
triticale (× Triticosecale Wittmack), which is a hybrid of rye and common wheat;
bulgur, which is whole durum wheat, sprouted and then processed;
seitan, which is not a cereal, but a wheat derivative, also defined by some as “gluten steak”.
Given that most of the dietary intake of gluten comes from wheat flour, of which about 700 million tons per year are harvested, representing about 30 percent of the global cereal production, the following discussion will focus on wheat gluten, and mainly on its proteins.
Note: The term gluten is also used to indicate the protein fraction that remains after removal of starch and soluble proteins from the dough obtained with corn flour: however, this “corn gluten” is “functionally” different from that obtained from wheat flour.
Cereal grain proteins
The study of cereal grain proteins, as seen, began with the work of Beccari. 150 years later, in 1924, the English chemist Osborne T.B., which can rightly be considered the father of plant protein chemistry, developed a classification based on their solubility in various solvents.
The classification, still in use today, divides plant proteins into 4 families.
Albumins, soluble in water.
Globulins, soluble in saline solutions; for example avenalin of oat.
Prolamins, soluble in 70 percent alcohol solution, but not in water or absolute alcohol.
They include:
gliadins of wheat;
zein of corn;
avenin of oats;
hordein of barley;
secalin of rye.
They are the toxic fraction of gluten for celiac patients.
Glutelins, insoluble in water and neutral salt solutions, but soluble in acidic and basic solutions.
They include glutenins of wheat.
Approximate percentage composition of protein fractions in common cereals
Cereals
Albumins
Globulins
Prolamins*
Glutelins**
Wheat
9
5
40
46
Corn
4
2
55
39
Barley
13
12
52
23
Oats
11
56
9
23
Rice
5
10
5
80
* Gliadins in wheat ** Glutenins in wheat
Albumins and globulins are cytoplasmic proteins, often enzymes, rich in essential amino acids, such as lysine, tryptophan and methionine. They are found in the aleurone layer and embryo of the caryopsis.
Prolamins and glutelins are the storage proteins of cereal grains. They are rich in glutamine and proline, but very low in lysine, tryptophan and methionine. They are found in the endosperm, and are the vast majority of the proteins in the grains of wheat, corn, barley, oat, and rye.
Although Osborne classification is still widely used, it would be more appropriate to divide cereal grain proteins into three groups: structural and metabolic proteins, storage proteins, and defense proteins.
Wheat gluten proteins
Proteins represent 10-14 percent of the weight of the wheat caryopsis, whereas about 80 percent of its weight consists of carbohydrates.
According to the Osborne classification, albumins and globulins represent 15-20 percent of the proteins, while prolamins and glutelins are the remaining 80-85 percent, composed respectively of gliadins, 30-40 percent, and glutenins, 40-50 percent. Therefore, and unlike prolamins and glutelins in the grains of other cereals, gliadins and glutenins are present in similar amounts, about 40 percent.
Wheat Grain Proteins
Technologically, gliadins and glutenins are very important. Why?
These proteins are insoluble in water, and in the dough, that contains water, they bind to each other through a combination of intermolecular bonds, such as:
covalent bonds, i.e. disulfide bridges;
noncovalent bonds, such as hydrophobic interactions, van der Waals forces, hydrogen bonds, and ionic bonds.
Thanks to the formation of these intermolecular bonds, a three-dimensional lattice is formed. This structure entraps starch granules and carbon dioxide bubbles produced during leavening, and gives strength and elasticity to the dough, two properties of gluten widely exploited industrially.
In the usual diet of the European adult population, and in particular in Italian diet that is very rich in derivatives of wheat flour, gliadin and glutenin are the most abundant proteins, about 15 g per day. What does this mean? It means that gluten-free diet engages celiac patients both from a psychological and social point of view.
Note: The lipids of the gluten are strongly associated with the hydrophobic regions of gliadins and glutenins and, unlike what you can do with the flour, they are extracted with more difficulty. The lipid content of the gluten depends on the lipid content of the flour from which it was obtained.
Gliadins: extensibility and viscosity
Gliadins are hydrophobic monomeric prolamins, of globular nature and with low molecular weight. On the basis of electrophoretic mobility in low pH conditions, they are separated into the following types:
alpha/beta, and gamma, rich in sulfur, containing cysteines, that are involved in the formation of intramolecular disulfide bonds, and methionines;
omega, low in sulfur, given the almost total absence of cysteine and methionine.
They have a low nutritional value and are toxic to celiac patients because of the presence of particular amino acid sequences in the primary structure, such as proline-serine-glutamine-glutamine and glutamine-glutamine-glutamine-proline.
Gliadins are associated with each other and with glutenins through noncovalent interactions; thanks to that, they act as “plasticizers” in dough making. Indeed, they are responsible for viscosity and extensibility of gluten, whose three-dimensional lattice can deform, allowing the increase in volume of the dough as a result of gas production during leavening. This property is important in bread-making.
Their excess leads to the formation of a very extensible dough.
Glutenins: elasticity and toughness
Glutenins are polymeric proteins, that is, formed of multiple subunits, of fibrous nature, linked together by intermolecular disulfide bonds. The reduction of these bonds allows to divide them, by SDS-PAGE, into two groups.
High molecular weight (HMW) subunits, low in sulfur, that account for about 12 percent of total gluten proteins. The noncovalent bonds between them are responsible for the elasticity and tenacity of the gluten protein network, that is, of the viscoelastic properties of gluten, and so of the dough.
Low molecular weight (LMW) subunits, rich in sulfur, namely, cysteine residues.
These proteins form intermolecular disulfide bridges to each other and with HMW subunits, leading to the formation of a glutenin macropolymer.
Glutenins allow dough to hold its shape during mechanical (kneading) and not mechanical stresses (increase in volume due to both the leavening and the heat of cooking that increases the volume occupied by gases present) which is submitted. This property is important in pasta making.
If in excess, glutenins lead to the formation of a strong and rigid dough.
Properties of wheat gluten
From the nutritional point of view, gluten proteins do not have a high biological value, being low in lysine, an essential amino acid. Therefore, a gluten-free diet does not cause any important nutritional deficiencies.
On the other hand, it is of great importance in food industry. The combination, in aqueous solution, of gliadins and glutenins to form a three-dimensional lattice, provides viscoelastic properties, that is, extensibility-viscosity and elasticity-tenacity, to the dough, and then, a good structure to bread, pasta, and in general, to all foods made with wheat flour.
It has a high degree of palatability and a high fermenting power in the small intestine.
It is an exorphin: some peptides produced from intestinal digestion of gluten proteins may have an effect in central nervous system.
Gluten-free cereals
The following is a list of gluten-free cereals, minor cereals, and pseudocereals used as foods.
Cereals
corn or maize (Zea mays)
rice (Oryza sativa)
Minor cereals
They are defined “minor” not because they have a low nutritional value, but because they are grown in small areas and in lower quantities than wheat, rice and maize.
Fonio (Digitaria exilis)
Millet (Panicum miliaceum)
Panic (Panicum italicum)
Sorghum (Sorghum vulgare)
Teff (Eragrostis tef)
Teosinte; it is a group of four species of the genus Zea. They are plants that grow in Mexico (Sierra Madre), Guatemala and Venezuela.
Pseudocereals.
They are so called because they combine in their botany and nutritional properties characteristics of cereals and legumes, therefore of another plant family.
Buckwheat (Fagopyrum esculentum)
Quinoa (Chenopodium quinoa), a pseudocereal with excellent nutritional properties, containing fibers, iron, zinc and magnesium. It belongs to Chenopodiaceae family, such as beets.
Cassava, also known as tapioca, manioc, or yuca (Manihot useful). It is grown mainly in the south of the Sahara and South America. It is an edible root tuber from which tapioca starch is extracted.
It should be noted that naturally gluten-free foods may not be truly gluten-free after processing. Indeed, the use of derivatives of gliadins in processed foods, or contamination in the production chain may occur, and this is obviously important because even traces of gluten are harmful for celiac patients.
Oats and gluten
Oats (Avena sativa) is among the cereals that celiac patients can eat. Recent studies have shown that it is tolerated by celiac patients, adult and child, even in subjects with dermatitis herpetiformis. Obviously, oats must be certified as gluten-free from contamination.
References
Beccari J.B. De Frumento. De bononiensi scientiarum et artium instituto atque Academia Commentarii, II. 1745:Part I.,122-127
Bender D.A. “Benders’ dictionary of nutrition and food technology”. 8th Edition. Woodhead Publishing. Oxford, 2006
Berdanier C.D., Dwyer J., Feldman E.B. Handbook of nutrition and food. 2th Edition. CRC Press. Taylor & Francis Group, 2007
Phillips G.O., Williams P.A. Handbook of food proteins. 1th Edition. Woodhead Publishing, 2011
Shewry P.R. and Halford N.G. Cereal seed storage proteins: structures, properties and role in grain utilization. J Exp Bot 2002:53(370);947-958. doi:10.1093/jexbot/53.370.947
Yildiz F. Advances in food biochemistry. CRC Press, 2009
During running, athletes burn calorie, and lose water and salts in amounts depending on various factors such as the technique, training level, environmental conditions, and physiological characteristics of each runner. The knowledge of these factors allows to plan an adequate diet both during workout and recovery, with the aim of optimizing performance. Below we will analyze the energy expenditure of runners engaged in workouts on various distances, the amounts of carbohydrates, lipids, and proteins oxidized to meet the energy requirements, and which minerals are lost in sweat.
During running energy expenditure is equal to 0.85-1.05 kcal per kilogram per kilometer.
This range is due to the fact that athletes with a good technique spend less than those with a poor technique.
A 70 kilogram (154 pound) athlete has an energy expenditure per kilometer between:
70 x 0.85 x 1 = 59.5 kcal
and
70 x 1.05 x 1 = 73.5 kcal
The table shows the calculations to determine the energy expenditure of the athlete to run 10, 20, 30, and 40 kilometers.
Estimated energy expenditure (kcal) during running , based on a 70 kg body weight and average calories burned per kg over different distances (km)
Distance
Energy expenditure
10
0.85 x 70 x 10 = 595
1.05 x 70 x 10 = 735
20
0.85 x 70 x 20 = 1190
1.05 x 70 x 20 = 1470
30
0.85 x 70 x 30 = 1785
1.05 x 70 x 30 = 2205
40
0.85 x 70 x 40 = 2380
1.05 x 70 x 40 = 2940
Note: who has started running for a short time ago has an energy expenditure even higher than 1.05 kcal per kilogram per kilometer.
During running, the energy for muscle work derives from the oxidation of carbohydrates, lipids, and proteins. Carbohydrates and lipids are the main energy source, and their oxidation rate depends on the intensity of exercise: as it increases, the percentage of lipid oxidation decreases whereas that of carbohydrates increases, as summarized below.
Energy source utilization during running as a function of exercise intensity (% VO2max)
Intensity
Fuel
30% VO2max
Mainly fats
40-60% VO2max
Fats and carbohydrates
75% VO2max
Mainly carbohydrates
80% VO2max
Almost exclusively carbohydrates
Note: The failure to use the suitable fuel can promote fatigue and lead to overtraining.
Then, when running above the anaerobic threshold, the oxidation of carbohydrates can provide the entire energy requirement. At marathon pace, carbohydrates provide 60-70 percent of the energy requirement, whereas at lower pace they provide less than 50 percent of energy requirement.
Below, the amounts of carbohydrates, lipids, and proteins oxidized during workout are analyzed. During workout ,the energy expenditure is covered for about 60 percent by carbohydrates, for about 40 percent by lipids, whereas the residual percentage, between 3 and 5 percent, by proteins.
Carbohydrate oxidation during workout
For a 70 kilogram runner the amount of carbohydrates oxidized per kilometer is between:
(0.6 x 59.5) /4 = 8.9 g/km
and
(0.6 x 73.5) /4 = 11 g/km
Note: carbohydrates provide, on average, 4 kcal per gram.
The table shows the calculations to determine the amount of carbohydrates oxidized when the athlete runs 10, 20, 30, and 40 kilometers.
Estimated carbohydrate expenditure (g) during running, based on energy expenditure (60% supported by carbohydrates ) and a body weight of 70 kg over various distances (km)
Distance
Carbohydrate expenditure
10
[(0.85 x 70 x 10) x 0.6 ] / 4 = 89
[(1.05 x 70 x 10) x 0.6 ] / 4 = 110
20
[(0.85 x 70 x 20) x 0.6] / 4 = 179
[(1.05 x 70 x 20) x 0.6] / 4 = 221
30
[(0.85 x 70 x 30) x 0.6] / 4 = 268
[(1.05 x 70 x 30) x 0.6] / 4 = 331
40
[(0.85 x 70 x 40) x 0.6] / 4 = 357
[(1.05 x 70 x 40) x 0.6] / 4 = 441
Lipid oxidation during workout
By calculations similar to those for carbohydrates, we determine the amount of lipids oxidized per kilometer, which is between:
(0.4 x 59.5) / 9 = 2.6 g/km
and
(0.4 x 73.5) / 9 = 3.3 g/km
Note: lipids provide, on average, 9 kcal per gram.
The table shows the calculations to determine the amount of lipids oxidized when the athlete runs 10, 20, 30, and 40 kilometers.
Estimated lipid expenditure (g) during running, based on energy expenditure (40% supported by lipids) and a body weight of 70 kg over various distances (km)
Distance
Lipid expenditure
10
[(0.85 x 70 x 10) x 0.4] / 9 = 26
[(1.05 x 70 x 10) x 0.4] / 9 = 33
20
[(0.85 x 70 x 20) x 0.4] / 9 = 53
[(1.05 x 70 x 20) x 0.4] / 9 = 65
30
[(0.85 x 70 x 30) x 0.4] / 9 = 79
[(1.05 x 70 x 30) x 0.4] / 9 = 98
40
[(0.85 x 70 x 40) x 0.4] / 9 = 106
[(1.05 x 70 x 40) x 0.4] / 9 = 131
Protein oxidation during workout
Protein requirements of adults are equal to 0.9 grams per kilogram of body weight, and, for a 70 kilogram athlete is:
70 x 0.9 = 63 g
During workout the energy expenditure is covered for about 3-5 percent by protein oxidation.
The table shows the calculations to determine the amount of proteins oxidized when the athlete runs 10, 20, 30, and 40 kilometers, and proteins provide 3 percent of the energy requirement.
Estimated protein expenditure (g) during running , based on energy expenditure (3% supported by proteins) and a body weight of 70 kg over various distances (km)
Distance
Protein expenditure
10
[(0.85 x 70 x 10) x 0.03)] / 4 = 4.5
[(1.05 x 70 x 10) x 0.03)] / 4 = 5.5
20
[(0.85 x 70 x 20) x 0.03)] / 4 = 8.9
[(1.05 x 70 x 20) x 0.03)] / 4 = 11
30
[(0.85 x 70 x 30) x 0.03)] / 4 = 13.4
[(1.05 x 70 x 30) x 0.03)] / 4 = 16.5
40
[(0.85 x 70 x 40) x 0.03)] / 4 = 17.9
[(1.05 x 70 x 40) x 0.03)] / 4 = 22.1
Note: proteins provide, on average, 4 kcal per gram.
For energy expenditure of 0.85 and 1.05 kcal per kilogram per kilometer, the average additional protein oxidation per kilogram to run 10, 20, 30, and 40 kilometers, rounded to the second decimal place, is:
10 km: [(4.5 + 5.5) / 2] / 70 = 0.07 g
20 km: [(4.5 + 5.5) / 2] / 70 = 0.14 g
30 km: [(4.5 + 5.5) / 2] / 70 = 0.21 g
40 km: [(4.5 + 5.5) / 2] / 70 = 0.29 g
Finally, adding the daily protein requirement of adults, the total protein requirement of a 70 kilogram runner, for the four distances, is:
10 km: 0.07 + 0.9 = 0.97 g
20 km: 0.14 + 0.9 = 1.04 g
30 km: 0.21 + 0.9 = 1.11 g
40 km: 0.29 + 0.9 = 1.19 g
By calculations similar to the previous ones, we determine the overall protein requirement when proteins provide 5 percent of the energy requirement.
10 km: 0.12 + 0.9 = 1.02 g
20 km: 0.24 + 0.9 = 1.14 g
30 km: 0.36 + 0.9 = 1.26 g
40 km: 0.48 + 0.9 = 1.38 g
Excluding athletes who run 30 kilometers or more every day, the values are slightly higher than 0.9 grams per kilogram of body weight.
In reality, the daily protein requirement is just slightly higher because a certain amount of nitrogen, hence proteins, is lost, as well as in the urine, also through sweating.
Water and minerals loss during running
Water losses depend on the amount of sweat produced, that depends on:
air temperature and humidity;
solar radiation.
The loss will be greater the higher these values are.
Finally, the amount of sweat produced is different from person to person.
Minerals lost in sweat are mostly:
sodium and chlorine, about 1 gram per liter of sweat in heat acclimatized athletes;
potassium, in an amount equal to about 15 percent of the sodium lost;
magnesium, in an amount equal to about 1 percent of the sodium lost.
The amount of minerals lost depends on how much sweat is produced, and it increases in non-heat acclimatized athletes.
The table shows the values, in grams per liter, of the minerals lost in sweat for non-heat and heat-acclimated athletes.
Values (grams per liter) of minerals lost in sweat in non-heat-acclimated and heat-acclimated athletes
Mineral
Non-heat acclimated athletes
Heat acclimated athletes
Sodium
1.38
0.92
Chlorine
1.5
1.00
Potassium
0.20
0.15
Magnesium
0.01
0.01
Total
3.09
2.08
Therefore, during physical activity, sodium is the mineral we need most of all.
After physical activity, runner, or who sweats heavily, tends to eat saltier food. This effect, known as selective hunger, was discovered, for sodium, in studies conducted on foundry workers. Probably, the selective hunger doesn’t not exist for potassium and magnesium.
References
Sawka M.N., Burke L.M., Eichner E.R., Maughan, R.J., Montain S.J., Stachenfeld N.S. American College of Sports Medicine position stand: exercise and fluid replacement. Med Sci Sport Exercise 2007;39(2):377-390. doi:10.1249/mss.0b013e31802ca597
Shirreffs S., Sawka M.N. Fluid and electrolyte needs for training, competition and recovery. J Sport Sci 2011;29:sup1, S39-S46. doi:10.1080/02640414.2011.614269
gamma-Linolenic acid (GLA), one of the omega-6 polyunsaturated fatty acids, like its precursor linoleic acid (the most abundant polyunsaturated fatty acid in human skin epidermis, where it’s involved in the maintenance of the epidermal water barrier), plays important roles in the physiology and pathophysiology of the skin.
Studies conducted on humans revealed that gamma-linolenic acid:
improves skin moisture, firmness, roughness;
decreases transepidermal water loss (one of the abnormalities of the skin in essential fatty acid deficiency animals).
Prostaglandin E1
Using guinea pig skin epidermis as a model of human epidermis (they are functionally similar), it was demonstrated that supplementation of animals with gamma-linolenic acid-rich foods results in a major production of PGE1 and 15-HETrE in the skin (as previously demonstrated in in vitro experiments).
Because these molecules have both anti-inflammatory/anti-proliferative properties supplementation of diet with gamma-linolenic acid acid-rich foods may be an adjuncts to standard therapy for inflammatory/proliferative skin disorders.
Supplemental sources of GLA
The main supplemental sources of gamma-linolenic acid are oils of the seeds of:
black currant (from 15% to 19% of the total fatty acids);
evening primrose (from 7% to 14% of the total fatty acids), and
Role of gamma-linolenic acid in lowering blood pressure
The relationship between dietary fatty acid intake and blood pressure mainly comes from studies conducted on genetically modified rats that spontaneously develops hypertension (a commonly used animal model for human hypertension).
In these studies many membrane abnormalities were seen so hypertension in rat model may be related to change in polyunsaturated fatty acid metabolism at cell membrane level.
About polyunsaturated fatty acids, several research teams have reported that gamma-linolenic acid reduces blood pressure in normal and genetically modified rats (greater effect) and it was purported by interfering with Renin-Angiotensin System (that promote vascular resistance and renal retention) altering the properties of the vascular smooth muscle cell membrane and so interfering with the action of angiotensin II.
Another possible mechanism of action of gamma-linolenic acid to lower blood pressure could be by its metabolite dihomo-gamma-linolenic acid: it may be incorporated in vascular smooth muscle cell membrane phospholipids, then released by the action of phospholipase A2 and transformed by COX-1 in PGE1 that induces vascular smooth muscle relaxation.
Role gamma-linolenic acid in treatment of rheumatoid arthritis
In a study conducted by Leventhal et al. on 1993 it was demonstrated the dietary intake of higher concentration of borage oil (about 1400 mg of gamma-linolenic acid/day) for 24 weeks resulted in clinically significant reductions in signs and symptoms of rheumatoid arthritis activity.
In a subsequent study by Zurier et al. on 1996 the dietary intake of an higher dose (about 2.8 g/day gamma-linolenic acid) for 6 months reduced, in a clinically relevant manner, signs and symptoms of the disease activity; patients who remained for 1 year on the 2.8 g/day dietary gamma-linolenic acid exhibited continued improvement in symptoms (the use of gamma-linolenic acid also at the above higher dose is well tolerated, with minimal deleterious effects). These data underscore that the daily amount and the duration of gamma-linolenic acid dietary intake do correlate with the clinical efficacy.
References
Akoh C.C. and Min D.B. “Food lipids: chemistry, nutrition, and biotechnology” 3th ed. 2008
Chow Ching K. “Fatty acids in foods and their health implication” 3th ed. 2008
Fan Y.Y. and Chapkin R.S. Importance of dietary γ-linolenic acid in human health and nutrition. J Nutr 1998;128:1411-1414. doi:10.1093/jn/128.9.1411
Leventhal L.J., Boyce E.G. and Zurier R.B. Treatment of rheumatoid arthritis with gammalinolenic acid. Ann Intern Med 1993;119:867-873. doi:10.7326/0003-4819-119-9-199311010-00001
Miller C.C. and Ziboh V.A. Gammalinolenic acid-enriched diet alters cutaneous eicosanoids. Biochem Biophys Res Commun 1988;154:967-974. doi:10.1016/0006-291X(88)90234-3
Zurier R.B., Rossetti R.G., Jacobson E.W., DeMarco D.M., Liu N.Y., Temming J.E., White B.M. and Laposata M. Gamma-linolenic acid treatment of rheumatoid arthritis. A randomized, placebocontrolled trial. Arthritis Rheum 1996;39:1808-1817. doi:10.1002/art.1780391106
Many studies have shown a direct, dose-dependent relationship between alcohol intake and blood pressure, particularly for intake above two drinks per day.
This relationship is independent of:
age;
salt intake;
obesity;
finally, it persists regardless of beverage type.
Furthermore, heavy consumption of alcoholic beverages for long periods of time is one of the factors predisposing to hypertension: from 5 to 7% of hypertension cases is due to an excessive alcohol consumption.
A meta-analysis of 15 randomized controlled trials has shown that decreasing alcoholic beverage intake intake has therapeutic benefit to hypertensive and normotensive with similar systolic and diastolic blood pressure reductions (in hypertensive reduction occurs within weeks).
Guidelines on the primary prevention of hypertension recommend that alcohol (ethanol) consumption in most men, in absence of other contra, should be less than 28 g/day, the limit in which it may reduce coronary heart disease risk. The consumption limited to these quantities must be obtained by intake of drinks with low ethanol content, preferably at meals (drinking even lightly to moderately outside of meals increases the probability to have hypertension). This means no more than 680 ml or 24 oz of regular beer or 280 ml or 10 oz of wine (12% ethanol), especially in hypertension; for women and thinner subjects consumption should be halved1.
To avoid intake of drinks with high ethanol content even though the total ethanol content not exceeding 28 g/day.
Relationship between ethanol intake and blood pressure
Anyway, uncertainty remains regarding benefits or risks attributable to light-to-moderate alcoholic beverage intake on the risk of hypertension.
In a study published on April 2008, the authors examined the association between ethanol intake and the risk of developing hypertension in 28848 women from “The Women’s Health Study” and 13455 men from the “Physicians’ Health Study”, (the follow-up lasted respectively for 10.9 and 21.8 years).
The study confirms that heavy ethanol intake (exceeding 2 drinks/day) increases hypertension risk in both men and women but, surprisingly, found that the association between light-to-moderate alcohol intake (up to 2 drinks/day) and the risk of developing hypertension is different in women and men. Women have a potential reduced risk of hypertension from a light-to-moderate ethanol consumption with a J-shaped association2; men have no benefits of light-to-moderate ethanol consumption but an increased risk of hypertension.
However, guidelines for the primary prevention of hypertension limit alcohol consumption to less 2 drinks/day in men and less 1 drink/day in thinner subjects and women.
1. A standard drink contains approximately 14 g of ethanol i.e. a 340 ml or 12 oz of regular beer, 140 ml or 5 oz wine (12% alcohol), or 42 ml or 1,5 oz of distilled spirits (inadvisable).
2. Many studies have shown a J-shaped relationship between ethanol intake and blood pressure. Light drinker (no more than 28 g of ethanol/day) have lower blood pressure than teetotalers; instead, who consumes more than 28 g ethanol/day have higher blood pressure than non drinker. So alcohol is a vasodilator at low doses but a vasoconstrictor at higher doses.
Sesso H.D., Cook N.R., Buring J.E., Manson J.E. and Gaziano J.M. Alcohol consumption and the risk of hypertension in women and men. Hypertension 2008;51:1080-1087. doi:10.1161/HYPERTENSIONAHA.107.104968
Writing Group of the PREMIER Collaborative Research Group. Effects of comprehensive lifestyle modification on blood pressure control: main results of the PREMIER Clinical Trial. JAMA 2003;289:2083-2093. doi:10.1001/jama.289.16.2083
World Health Organization, International Society of Hypertension Writing Group. 2003 World Health Organization (WHO)/International Society of Hypertension (ISH) statement on management of hypertension. Guidelines and recommendations. J Hyperten 2003;21:1983-1992.
Trans fatty acids or TFA or trans-unsaturated fatty acids or trans fats are unsaturated fatty acids, a subclass of lipids, with at least one a double bond in the trans configuration.
Carbon-carbon double bonds show planar conformation, and so they can be considered as planes from whose opposite sides carbon chain attaches and continues. “The entry” and “the exit” of the carbon chain from the plain may occur on the same side of the plain, and in this case double bond is in cis configuration, or on opposite side, and in that case it is in trans configuration. This is an example of geometric isomerism, also called cis-trans isomerism.
C18:1 cis/trans Isomers
Unsaturated fatty acids most commonly have their double bonds in cis configuration; the other, less common configuration is trans.
Cis bond causes a bend in the fatty acid chain, whereas the geometry of trans bond straightens the fatty acid chain, imparting a structure more similar to that of saturated fatty acids.
Below, some distinctive characteristics of the fats rich in trans fats, that make them particularly suited for the production of margarines and vegetable shortening used in home and commercial cooking, and manufacturing processes.
Bent molecules can’t pack together easily, but linear ones can do it.
This means that trans fatty acids contribute, together with the geometrically similar saturated fatty acids, to the hardness of the fats in which they are, giving them a higher melting point.
Heightening the melting point of fats means that it is possible to convert them from liquid form to semi-solids and solids at room temperature.
Note: trans fats tend to be less solid than saturated fatty acids.
They have a melting point, consistency and “mouth feel” similar to those of butter, a long shelf life at room temperature, and a flavor stability.
They are stable during frying.
Types of trans fatty acids
Dietary TFA come from different sources briefly reviewed below.
In industrialized countries, greater part of the consumed trans fatty acids, in USA about 80 percent of the total, are produced industrially, in varying amounts, during partial hydrogenation of edible oils containing unsaturated fatty acids.
They are produced at home during frying with vegetable oils containing unsaturated fatty acids.
They come from bacterial transformation of unsaturated fatty acids ingested by ruminants in their rumen.
Another natural source is represented by some plant species, such as leeks, peas, lettuce and spinach, that contain trans-3-hexadecenoic acid, and rapeseed oil, that contains brassidic acid (22:1∆13t) and gondoic acid (20:1∆11t). In these sources trans fatty acids are present in small amounts.
Very small amounts, less than 2 percent, are formed during deodorization of vegetable oils, a process necessary in the refining of edible oils. During this process trans fatty acids with more than one double bond are formed in small amounts. These isomers are also present in fried foods and in considerable amounts in some partially hydrogenated vegetable oils.
Industrial trans fatty acids
Hydrogenation is a chemical reaction in which hydrogen atoms react, in the presence of a catalyst, with a molecule.
The hydrogenation of unsaturated fatty acids involves the addition of hydrogen atoms to double bonds on the carbon chains of fatty acids. The reaction occurs in presence of metal catalyst and hydrogen, and is favored by heating vegetable oils containing unsaturated fatty acids.
Partial hydrogenation of vegetable oils
The process of hydrogenation was first discovered in 1897 by French Nobel prize in Chemistry, jointly with fellow Frenchman Victor Grignard, Paul Sabatier using a nickel catalyst.
Partially hydrogenated vegetable oils were developed in 1903 by a German chemist, Wilhelm Normann, who files British patent on “Process for converting unsaturated fatty acids or their glycerides into saturated compounds”. The term trans fatty acids or trans fats appeared for the first time in the Remark column of the 5th edition of the “Standard Tables of Food Composition” in Japan.
During partial hydrogenation, an incomplete saturation of the unsaturated sites on the carbon chains of unsaturated fatty acids occurs. For example, with regard to fish oil, trans fatty acid content in non-hydrogenated oils and in highly hydrogenated oils is 0.5 and 3.6 percent, respectively, whereas in partially hydrogenated oils is 30 percent.
From Oleic Acid to Vaccenic Acid
But, most importantly, some of the remaining cis double bonds may be moved in their positions on the carbon chain, producing geometrical and positional isomers, that is, double bonds can be modified in both conformation and position.
Below, other changes that occur during partial hydrogenation are listed.
Cyclic monomers, as well as intramolecular linear dimmers, are also formed.
Partially hydrogenated vegetable oils were developed for the production of vegetable fats, a cheaper alternative to animal fats. In fact, through hydrogenation, oils such as soybean, safflower and cottonseed oils, which are rich in unsaturated fatty acids, are converted into semi-solid fats.
The first hydrogenated oil was cottonseed oil in USA in 1911 to produce vegetable shortening.
In the 1930’s, partial hydrogenation became popular with the development of margarine.
Currently, per year in USA, 6-8 billion tons of hydrogenated vegetable oil are produced.
Ruminant trans fatty acids
Ruminant trans fats are produced by bacteria in the rumen of the animals, for example cows, sheep and goats, using as a substrate a proportion of the relatively small amounts of unsaturated fatty acids present in their feedstuffs, that is, feed, plants and herbs.
And, considering an animal that lives at least a year, and has the opportunity to graze and/or eat hay, there is a season variability in unsaturated fatty acids intake, and trans fats produced. In fact, in summer and spring, pasture plants and herbs may contain more unsaturated fatty acids than the winter feed supply.
Then, TFA are present at low levels in meat and full fat dairy products, typically <5 percent of total fatty acids, and are located in the sn-1 and sn-3 positions of the triacylglycerols, whereas in margarines and other industrially hydrogenated products they appear to be concentrated in the sn-2 position of the triacylglycerols.
Ruminant trans fatty acids are mainly monounsaturated fatty acids, with 16 to 18 carbon atoms, and constitute a small percentage of the trans fatty acids in the diet.
Isomers
The most important cluster of trans fatty acids is trans-C18:1 isomers, that is, fatty acids containing 18 carbon atoms plus one double bond, whose position varies between Δ6 and Δ16 carbon atoms. In both sources, the most common isomers are those with double bonds between positions Δ9 and Δ11.
However, even if these molecules are present both in industrial and ruminant TFA, there is a considerable quantitative difference. For example, vaccenic acid (C18:1 Δ11t) represents over 60 percent of the trans-C18:1 isomers in ruminant trans fatty acids, whereas in industrial ones elaidic acid (C18:1Δ9t) comprises 15-20 percent and C18:1 Δ10t and vaccenic acid over 20 percent each others.
trans-C18:1 Isomers
Effects on human health
Ruminant trans fatty acids, in amounts actually consumed in diets, are not harmful for human health.
Conversely, consumption of industrial trans fats has neither apparent benefit nor intrinsic value, above their caloric contribution, and, from human health standpoint they are only harmful, having adverse effects on:
serum lipid levels;
endothelial cells;
systemic inflammation;
other risk factors for cardiovascular disease.
Moreover, they are positively associated with the risk of coronary heart disease (CHD), and sudden death from cardiac causes and diabetes.
Note: further in the text, we will refer to industrial trans fatty acids as trans fats or trans fatty acids.
Effects at plasmatic level
Low-density lipoprotein cholesterol (LDL-C) and high-density lipoprotein cholesterol (HDL-C) plasma levels are well-documented risk markers for the development of coronary heart disease or CHD.
High LDL-C levels are associated with an increased incidence of ischemic heart disease.
High HDL-C levels are associated with a reduced incidence of the risk.
For this reason, the ratio between total cholesterol level and HDL-C is often used as a combined risk marker for these two components in relation to the development of heart disease: the higher the ratio, the higher the risk.
TFA have adverse effects on serum lipids.
These effects have been evaluated in numerous controlled dietary trials by isocaloric replacement of saturated fatty acids or cis-unsaturated fatty acids with trans fats. It was demonstrated that such replacement:
raises LDL-C levels;
lowers HDL-C levels, in contrast to saturated fatty acids that increase HDL-C levels when used as replacement in similar study;
increases the ratio of total cholesterol to HDL-C, approximately twice that for saturated fatty acids, and, on the basis of this effect alone, trans fatty acids has been estimated to cause about 6% of coronary events in the USA.
Furthermore, trans fats:
produce a deleterious increase in small, dense LDL-C subfractions, that is associated with a marked increased in the risk of CHD, even in the presence of relatively normal LDL-C;
increase the blood levels of triglycerides, and this is an independent risk factor for CHD;
increase levels of Lp(a)lipoprotein, another important coronary risk factor.
But on 2004 prospective studies have shown that the relation between the intake of trans fatty acids and the incidence of CHD is greater than that predicted by changes in serum lipid levels alone. This suggests that trans fats influence other risk factors for CHD, such as inflammation and endothelial-cell dysfunction.
Inflammation and endothelial-cell dysfunction
The role of inflammation in atherosclerosis, and consequently in CHD, is burgeoned in the last decade.
Interleukin-6, C-reactive protein (CRP), and an increased activity of tumor necrosis factor (TNF) system are markers of inflammation.
In women greater intake of trans fatty acids is associated with increased activity of TNF system, and in those with a higher body mass index with increased levels of interleukin-6 and CRP. For example, the difference in CRP seen with an average intake of trans fats of 2.1 percent of the total daily energy intake, as compared with 0.9 percent, correspond to an increased risk of cardiovascular disease of 30 percent. Similar results have been reported in patients with established heart disease, in randomized, controlled trials, in in vitro studies, and in studies in which it has been analyzed membrane levels of trans fatty acids, a biomarker of their dietary intake.
So, trans fats promote inflammation, and their inflammatory effects may account at least in part for their effects on CHD that, as seen above, are greater than would be predicted by effects on serum lipoproteins alone.
Attention: the presence of inflammation is an independent risk factor not only for CHD but also for insulin resistance, diabetes, dyslipidemia, and heart failure.
Another site of action of TFA may be endothelial function.
Several studies have suggested the association between greater intake of trans fats and increased levels of circulating biomarkers of endothelial dysfunction, such as E-selectin, sICAM-1, and sVCAM-1.
Other effects
In vitro studies have demonstrate that trans fats affect lipid metabolism through several pathways.
They alter secretion, lipid composition, and size of apolipoprotein B-100 (apo B-100).
They increase cellular accumulation and secretion of free cholesterol and cholesterol esters by hepatocytes.
They alter expression in adipocytes of genes for peroxisome proliferator-activated receptor-gamma (PPAR-gamma), lipoprotein lipase, and resistin, proteins having a central roles in the metabolism of fatty acids and glucose.
Coronary heart disease
Industrial trans fats are independent cardiovascular risk factor.
Since the early 1990s attention has been focused on the effect of trans fatty acids on plasma lipid and lipoprotein concentrations.
Furthermore, four major prospective studies covering about 140,000 subjects, monitored for 6-14 years, have all found positive epidemiological evidence relating their levels in the diet, assessed with the aid of a detailed questionnaire on the composition of the diet, to the risk of CHD. These four studies are:
The Health Professionals Follow-up study;
The Alpha-Tocopherol Beta-Carotene Cancer Prevention Study;
The Nurses’ Health Study;
The Zutphen Elderly Study.
These studies cover such different populations that the results very probably hold true for the populations as a whole.
A meta-analysis of these studies have shown that a 2 percent increase in energy intake from industrial TFA was associated with a 23 percent increase in the incidence of CHD. The relative risk of heart disease was 1.36 in “The Health Professionals Follow-up Study”, 1.14 in “The Alpha-Tocopherol Beta-Carotene Cancer Prevention Study”; 1.93 (1.43-2.61) in “The Nurses’ Health Study”, and 1.28 (1.01-1.61) in “The Zutphen Elderly Study”.
So, there is a substantially increased risk even at low levels of intake: 2 percent of total energy intake, for a 2,000 Kcal diet is 40 Kcal or about 4-5 g of fat corresponding to a teaspoonful of fat!
Moreover, in three of the studies, the association between the intake of industrial trans fats and the risk of CHD was stronger than a corresponding association between the intake of saturated fatty acids and the risk of heart disease. In “The Zutphen Elderly Study”, this association was not investigated. Because of the adverse effects of industrial trans fatty acids, for the same authors are unethical conducting randomized long-term trials to test their effects on the incidence of CHD.
So, avoidance of industrial trans fats, or a consumption of less 0.5% of total daily energy intake is necessary to avoid their adverse effects, far stronger on average than those of food contaminants or pesticide residues.
Further evidence
A study conducted in an Australia population with a first heart attack and no preceding history of CHD or hyperlipidemia has showed a positive association between levels of trans fatty acids in adipose tissue and the risk of nonfatal myocardial infarction.
It was shown that adipose tissue C18:1Δ7t, found in both animal and vegetable fats, was an independent predictor of a first myocardial infarction, that is, its adipose tissue level is still a predictor for heart disease after adjustment for total cholesterol. Again, it appears that only a minor part of the negative effects of trans fats occurs via plasma lipoproteins.
During the course of this study, mid-1996, TFA were eliminated from margarines sold in Australia. This was a unique opportunity to investigate the temporal relationship between trans fat intake and their adipose tissue levels. It was demonstrated that trans fats disappear from adipose tissue of both case-patients and controls with a rate about 15 percent of total trans fats/y.
Another study conduct in Costa Rica have found a positive association between myocardial infarction and trans fatty acids.
Interestingly, in a larger, community-based case-control study, levels of trans fats in red blood cell membranes were associated, after adjustment for other risk factors, with an increase in the risk of sudden cardiac death. Moreover, the increased risk appeared to be related to trans-C18:2 levels, that were associated with a tripling of the risk, but not with cell membrane levels of trans-C18:1, the major trans fatty acids in foods (see above).
Diabetes
In a prospective study covering 84,204 female nurses, from “The Nurses’ Health Study”, aged 34–59 y, analyzed from the 1980 to 1996, with no cancer, diabetes, or cardiovascular disease at base line, the intake of trans fatty acids was significantly related to the risk of developing type 2 diabetes. And, after adjustment for other risk factors trans fat intake was positively associated with the incidence of diabetes with a risk up to 39 percent greater.
Data from controlled intervention studies showed that TFA could impair insulin sensitivity in subjects with insulin resistance and type 2 diabetes (saturated fatty acids do the analogous response, with no significant difference between TFA and them) more than unsaturated fatty acids, in particular the isomer of conjugated linoleic acid (CLA) trans-10, cis-12-CLA.
Be careful because some dietary supplements contain CLA isomers and may be diabetogenic and proatherogenic in insulin-resistant subjects.
No significant effect was seen in insulin sensitivity of lean, healthy subjects.
Ruminant trans fatty acids and the risk of CHD
Four prospective studies have evaluated the relation between the intake of ruminant trans fatty acids and the risk of CHD: no significant association was identified.
In another study published on 2008 was analyzed data from four Danish cohort studies that cover 3,686 adults enrolled between 1974 and 1993, and followed for a median of 18 years. In Denmark, consumption of dairy products is relatively high and the range of ruminant trans fat intake is relatively broad, up to 1.1 percent of energy. Conversely, in the other countries, ruminant trans fatty acid consumption for most people is substantially lower than 1 percent of energy, in USA about 0.5 percent of energy.
After adjustment for other risk factors, no significant associations between ruminant TFA consumption and incidence of CHD were found, confirming, in a population with relatively high intake of ruminant trans fatty acids, conclusions of four previous prospective studies.
So ruminant trans fats, in amounts actually consumed in diets, do not raise CHD risk.
The absence of risk of CHD with trans fats from ruminants as compared with industrial trans fatty acids may be due to a lower intake. In the USA, greater part of trans fats have industrial origin; moreover trans fat levels in milk and meats are relatively low, 1 to 8 percent of total fats.
The absence of a higher risk of CHD may be due also to the presence of different isomers. Ruminant and industrial sources share many common isomers, but there are some quantitative difference:
vaccenic acid level is higher in ruminant fats, 30-50 percent of trans isomers;
trans-C18:2 isomers, present in deodorized and fried vegetable oils, as well as in some partially hydrogenated vegetable oils, are not present in appreciable amounts in ruminants fats.
Finally other, still unknown, potentially protective factors could outweigh harmful effects of ruminant trans fats.
Trans fatty acids: legislation regulating their content
USA
Until 1985 no adverse effects of trans fatty acids on human health was demonstrated, and in 1975 a Procter & Gamble study showed no effect of trans fats on cholesterol.
Their use in fast food preparation grew up from 1980’s, when the role of dietary saturated fats in increasing cardiac risk began clear. Then, it was led a successful campaign to get McDonald’s to switch from beef tallow to vegetable oil for frying its French fries. Meanwhile, studies began to raise concerns about their effects on health.
On 1985 Food and Drug Administration (FDA) concluded that TFA and oleic acid affected serum cholesterol level similarly, but from the second half of 1985 their harmful began clear, and the final proof came from both controlled feeding trials and prospective epidemiologic studies.
On 2003 FDA ruled that food labels, for conventional foods and supplements, show their content beginning January 1, 2006. Notably, this ruling was the first substantive change to food labeling since the requirement for per-serving food labels information was added in 1990.
On 2005 The US Department of Agriculture made a minimized intake of trans fatty acids a key recommendation of the new food-pyramid guidelines.
The American Heart Association, on 2006, recommended to limit their intake to 1% of daily calorie consumption, and suggested food manufacturers and restaurants switch to other fats.
On 2006 New York City Board of Health announced trans fat ban in its 40,000 restaurants within July 1, 2008, followed by the state of California in 2010-2011.
Australia
After June 1996 they were eliminated from margarine sold in Australia, that before contributed about 50% of their dietary intake.
Europe
On March 11, 2003 the Danish government, after a debate started in 1994 and two new reports in 2001 and 2003, decided to phase out the use of industrial trans fats in food before the end of 2003.
Two years later, however, the European Commission (EC) asked Denmark to withdraw this law, which was not accepted on the European Community level, unfortunately.
However, in 2007, EC decided to closes its infringement procedure against Denmark because of increasing scientific evidence of the danger of this type of fatty acids.
The Danish example was followed by Austria and Switzerland in 2009, Iceland, Norway, and Hungary in 2011, and most recently, Estonia and Georgia in 2014. So, about 10 percent of the European Union population, about 500 million people, lives in countries where it is illegal to sell food high in industrial trans fats.
Governments of other European Union countries instead rely on the willingness of food producers to reduce trans fatty acid content in their products. This strategy has proved effective only for Western European countries.
Canada
Canada is considering legislation to eliminate them from food supplies, and, in 2005, ruled that pre-packaged food labels show their content.
Therefore, with the exception of the countries where the use of trans fats in the food industry was banned, the only way to reduce their intake in the other countries is consumer’s decision to choose foods free in such fatty acids, avoiding those known containing them, and always reading nutrition facts and ingredients because they may come from margarine, vegetable oil and frying. Indeed, for example in the USA, the producers of foods that contain less than 0.5 g of industrial trans fatty acids per serving can list their content as 0 on the packaging. This content is low but if a consumer eats multiple servings, he consumes substantial amount of them.
Be careful: food labels are not obligatory in restaurants, bakeries, and many other retail food outlets.
Food reformulation
Public health organizations, including the World Health Organization in September 2006, have recommended reducing the consumption of industrial trans fatty acids; only in USA the near elimination of these fatty acids might avoid between 72,000 and 280,000 of the 1.2 million of CHD events every year.
Food manufacturers and restaurants may reduce industrial TFA use choosing alternatives to partially hydrogenated oils.
In Denmark, their elimination from vegetable oils did not increase consumption of saturated fatty acids because they were mostly replaced with cis-unsaturated fatty acids. Moreover, there were no noticeable effects for the consumer: neither increase in the cost nor reduction in availability and quality of foods.
In 2009, Stender et al. have shown that industrial trans fatty acids in food such as French fries, cookies, cakes, and microwave-oven popcorn purchased in USA, South Africa, and many European Country can be replaced, at similar prices, with a mixture of saturated, monounsaturated, and polyunsaturated fatty acids. Such substitution has even greater nutritional benefit than one-to-one substitution of industrial trans fats with saturated fatty acids alone.
However, be careful because only in French fries with low industrial trans fats the percentage of saturate fatty acids remains constant, whereas in cookies and cakes is in average +33 percentage points and microwave-oven popcorn +24 percentage points: saturated fatty acids are less dangerous than industrial trans fats but more than mono- and polyunsaturated fatty acids.
The same research group, analyzing some popular foods in Europe, purchased in supermarkets, even of the same supermarket chain, and fast food, namely, McDonald’s and Kentucky Fried Chicken (KFC), from 2005 to 2014, showed that their TFA content was reduced or even absent in several Western European countries while remaining high in Eastern and Southeastern Europe.
In 2010 Mozaffarian et al. evaluated the levels of industrial trans fats and saturated fatty acids in major brand-name U.S. supermarket and restaurant foods after reformulation to reduce industrial trans fatty acid content, in two time: from 1993 through 2006 and from 2008 through 2009. They found a generally reduction in industrial trans fat content without any substantial or equivalent increase in saturated fatty acid content.
Foods sources
Many foods high in trans fats are popularly consumed worldwide.
In USA greater part of these fatty acids comes from partially hydrogenated vegetable oils, with an average consumption from this source that has been constant since the 1960′s.
It should be noted that the following trans fatty acid values must be interpreted with caution because, as previously said, many fast food establishments, restaurants and industries may have changed, or had to change the type of fat used for frying and cooking since the analysis were done.
The reported values, unless otherwise specified, refer to percentage in trans fatty acids/ 100 g of fatty acids.
Margarine
Among foods with trans fats, stick or hard margarine had the highest percentage of them, but levels of these fatty acids have declined as improved technology allowed the production of softer margarines which have become popular. But there are difference in trans fatty acid content of margarine from different countries. Below some examples.
The highest content, 13-16.5 percent, is found in soft margarine from Iceland, Norway, and the UK.
Less content is found in Italy, Germany, Finland, and Greece, 5.1 percent, 4.8 percent, 3.2 percent, and 2.9 percent respectively).
In Portugal, The Netherlands, Belgium, Denmark, France, Spain, and Sweden margarine trans fat content is less than 2 percent.
USA and Canada lag behind Europe, but in the USA, with the advent of trans fat labeling of foods and the greater knowledge of the risk associated with their consumption by the buyers, change is occurring. For this reason, at now, in the USA margarine is considered to be a minor contributor to the intake of TFA, whereas the major sources are commercially baked and fast food products like cake, cookies, wafer, snack crackers, chicken nuggets, French fries or microwave-oven popcorn (see below).
Vegetable shortenings
Trans fatty acid content of vegetable shortenings ranges from 6% to 50 percent, and varies in different country: in Germany, Austria and New Zealand it is less than France or USA.
However, like margarines, their trans fat content is decreasing. In Germany it decreased from 12% in 1994 to 6 percent in 1999, in Denmark is 7 percent (1996) while in New Zealand is about 6 percent (1997).
Vegetable oils
At now, non-hydrogenated vegetable oils for salad and cooking contain no or only small amounts of trans fats.
Processing of these oils can produce minimal level of them, ranged from 0.05g/100 food for extra virgin olive oil to 2.42 g/100 g food for canola oil. So, their contribution to trans fat content of the current food supply is very little.
One exception is represented by Pakistani hydrogenated vegetable oils whose TFA content ranges from 14% to 34%.
Prepared soups
Among foods with trans fats, prepared soups contain significant amount of them, ranging from 10 percent of beef bouillon to 35 percent of onion cream. So, they contribute great amount of such fatty acids to the diet if frequently consumed.
Processed foods
Thanks to their properties, trans fatty acids are used in many processed foods as cookies, cakes, croissants, pastries and other baked goods. And, baked goods are the greatest source of these fats in the North American diet. Of course, their trans fat content depends on the type of fat used in processing.
Sauces
Mayonnaise, salad dressings and other sauces contain only small or no-amounts of trans fats.
Human milk and infant foods
Trans fat content of human milk reflects the trans fat content of maternal diet in the previous day, is comprised between 1 and 7%, and is decreasing from 7.1 percent in 1998 to 4.6 percent in 2005/2006.
Infant formulas have trans fat values on average 0.1-4.5 percent, with a brand up to 15.7 percent.
Baby foods contain greater than 5 percent of trans fats.
Fast foods and restaurant’s foods
Vegetable shortenings high in trans fats are used as frying fats, so fast foods and many restaurant’s foods may contain relatively large amounts of them. Foods are fried pies, French fries, chicken nuggets, hamburgers, fried fish as well as fried chicken.
In articles published by Stender et al. from 2006 to 2009, it is showed that for French fries and chicken nuggets their content varies largely from nation to nation, but also within the same fast food chain in the same country, and even in the same city, because of the cooking oil used. For example, oil used in USA and Peru outlets of a famous fast food chain contained 23-24% of trans fats, whereas oil used in many European countries of the same fast food chain contained about 10 percent, with some countries, such as Denmark, as low as 5 percent and 1 percent.
And, considering a meal of French fries and chicken nuggets, in serving size of 171 and 160 g respectively, purchased at McDonald‘s in New York City, it contained over 10 g of TFA, while if purchased at KFC in Hungary they were almost 25 g.
Below, again from the work of Stender et al. it can see a cross-country comparison of trans fat contents of chicken nuggets and French fries purchased at McDonald ‘s or KFC.
Chicken nuggets and French fries from McDonald’s:
less than 1 g only if the meals were purchased in Denmark;
1-5 g in Portugal, the Netherlands, Russia, Czech Republic, or Spain;
5-10 g in the United States, Peru, UK, South Africa, Poland, Finland, France, Italy, Norway, Spain, Sweden, Germany, or Hungary.
Chicken and French fries from KFC:
less than 2 g if the meals were purchased UK (Aberdeen), Denmark, Russia, or Germany (Wiesbaden);
2-5 in Germany (Hamburg), France, UK (London or Glasgow), Spain, or Portugal;
5-10 in the Bahamas, South Africa, or USA;
10-25 g in Hungary, Poland, Peru, or Czech Republic.
References
Akoh C.C. and Min D.B. Food lipids: chemistry, nutrition, and biotechnology. 3rd Edition. CRC Press Taylor & Francis Group, 2008
Ascherio A., Katan M.B., Zock P.L., Stampfer M.J., Willett W.C. Trans fatty acids and coronary heart disease. N Engl J Med 1999;340:1994-1998. doi:10.1056/NEJM199906243402511
Ascherio A., Rimm E.B., Giovannucci E.L., Spiegelman D., Stampfer M., Willett W.C. Dietary fat and risk of coronary heart disease in men: cohort follow up study in the United States. BMJ 1996; 313:84-90. doi:10.1080/17482970601069094
Asp N-G. Fatty acids in focus – the good and the bad ones. Scand J Food Nutr 2006;50:155-160. doi:10.1080/17482970601069094
Baylin A., Kabagambe E.K., Ascherio A., Spiegelman D., Campos H. High 18:2 trans-fatty acids in adipose tissue are associated with increased risk of nonfatal acute myocardial infarction in Costa Rican adults. J Nutr 2003;133:1186-1191. doi:10.1093/jn/133.4.1186
Chow C.K. Fatty acids in foods and their health implication. 3rd Edition. CRC Press Taylor & Francis Group, 2008.
Clifton P.M., Keogh J.B., Noakes M. Trans fatty acids in adipose tissue and the food supply are associated with myocardial infarction. J Nutr 2004;134:874-879. doi:10.1093/jn/134.4.874
Costa N., Cruz R., Graça P., Breda J., and Casal S. Trans fatty acids in the Portuguese food market. Food Control 2016;64:128-134. doi:10.1016/j.foodcont.2015.12.010
Eckel R.H., Borra S., Lichtenstein A.H., Yin-Piazza D.Y. Understanding the Complexity of Trans fatty acid reduction in the American diet. American Heart Association trans fat conference 2006 report of the trans fat conference planning group. Circulation 2007;115:2231-2246. doi:10.1161/CIRCULATIONAHA.106.181947
Hu F.B., Manson J.E., Stampfer M.J., Colditz G., Liu S., Solomon C.G., and Willett W.C. Diet, lifestyle, and the risk of type 2 diabetes mellitus in women. N Engl J Med 2001;345:790-797. doi:10.1056/NEJMoa010492
Hu F.B., Willett W.C. Optimal diet for prevention of coronary heart disease JAMA 2002;288:2569-2578. doi:10.1001/jama.288.20.2569
Lemaitre R.N., King I.B., Raghunathan T.E., Pearce R.M., Weinmann S., Knopp R.H., Copass M.K., Cobb L.A., Siscovick D.S. Cell membrane trans-fatty acids and the risk of primary cardiac arrest. Circulation 2002;105:697-701. doi:10.1161/hc0602.103583
Lemaitre R.N, King I.B, Mozaffarian D., Sootodehnia N., Siscovick D.S. Trans-fatty acids and sudden cardiac death. Atheroscler Suppl 2006; 7(2):13-5. doi:10.1016/j.atherosclerosissup.2006.04.003
Lichtenstein A.H. Dietary fat, carbohydrate, and protein: effects on plasma lipoprotein patterns J. Lipid Res. 2006;47:1661-1667. doi:10.1194/jlr.R600019-JLR200
Lichtenstein A.H., Ausman L., Jalbert S.M., Schaefer E.J. Effect of different forms of dietary hydrogenated fats on serum lipoprotein cholesterol levels. N Engl J Med 1999;340:1933-1940. doi:10.1056/NEJM199906243402501
Lopez-Garcia E., Schulze M.B., Meigs J.B., Manson J.E, Rifai N., Stampfer M.J., Willett W.C. and Hu F.B. Consumption of trans fatty acids is related to plasma biomarkers of inflammation and endothelial dysfunction. J Nutr 2005;135:562-566. doi:10.1093/jn/135.3.562
Masanori S. Trans Fatty Acids: Properties, Benefits and Risks J Health Sci 2002;48(1):7-13.
Mensink R.P., Katan M.B. Effect of dietary trans fatty acids on high-density and low-density lipoprotein cholesterol levels in healthy subjects. N Engl J Med 1990;323:439-445. doi:10.1056/NEJM199008163230703
Mozaffarian D. Commentary: Ruminant trans fatty acids and coronary heart disease-cause for concern? Int J Epidemiol 2008;37(1):182-184. doi:10.1093/ije/dym263
Mozaffarian D., Jacobson M.F., Greenstein J.S. Food Reformulations to reduce trans fatty acids. N Eng J Med 2010;362:2037-2039. doi:https://doi.org/10.1056/NEJMc1001841
Mozaffarian D., Katan M.B., Ascherio A., Stampfer M.J., Willett W.C. Trans fatty acids and cardiovascular disease. N Engl J Med 2006;354:1601-1613. doi:10.1056/NEJMra054035
Mozaffarian D., Pischon T., Hankinson S.E., Joshipura K., Willett W.C., and Rimm E.B. Dietary intake of trans fatty acids and systemic inflammation in women. Am J Clin Nutr 2004;79:606-612. doi:https://doi.org/10.1093/ajcn/79.4.606
Oh K., Hu F.B., Manson J.E., Stampfer M.J., Willett W.C. Dietary fat intake and risk of coronary heart disease in women: 20 years of follow-up of the Nurses’ Health Study. Am J Epidemiol 2005;161(7):672-679. doi:10.1093/aje/kwi085
Okie S. New York to Trans Fats: You’re Out! N Engl J Med 2007;356:2017-2021. doi:10.1056/NEJMp078058
Oomen C.M., Ocke M.C., Feskens E.J., van Erp-Baart M.A., Kok F.J., Kromhout D. Association between trans fatty acid intake and 10-year risk of coronary heart disease in the Zutphen Elderly Study: a prospective population-based study. Lancet 2001; 357(9258):746-751. doi:10.1016/S0140-6736(00)04166-0
Pietinen P., Ascherio A., Korhonen P., Hartman A.M., Willett W.C., Albanes D., VirtamO J.. Intake of fatty acids and risk of coronary heart disease in a cohort of Finnish men: the Alpha-Tocopherol, Beta-Carotene Cancer Prevention Study. Am J Epidemiol 1997;145(10):876-887. doi:10.1093/oxfordjournals.aje.a009047
Risérus U. Trans fatty acids, insulin sensitivity and type 2 diabetes. Scand J Food Nutr 2006;50(4):161-165. doi:10.1080/17482970601133114
Salmerón J., Hu F.B., Manson J.E., Stampfer M.J., Colditz G.A., Rimm E.B., and Willett W.C. Dietary fat intake and risk of type 2 diabetes in women. Am J Clin Nutr 2001;73:1019-1026 doi:10.1093/ajcn/73.6.1019
Stender S., Astrup A., and Dyerberg J. A trans European Union difference in the decline in trans fatty acids in popular foods: a market basket investigation. BMJ Open 2012;2(5):e000859. doi:10.1136/bmjopen-2012-000859
Stender S., Astrup A., and Dyerberg J. Artificial trans fat in popular foods in 2012 and in 2014: a market basket investigation in six European countries. BMJ Open 2016;6(3):e010673. doi:10.1136/bmjopen-2015-010673
Stender S., Astrup A.,and Dyerberg J. Tracing artificial trans fat in popular foods in Europe: a market basket investigation. BMJ Open 2014;4(5):e005218. doi:10.1136/bmjopen-2014-005218
Stender S., Astrup A., Dyerberg J. What went in when trans went out?. N Engl J Med 2009;361:314-316. doi:10.1056/NEJMc0903380
Stender S., Dyerberg J. The influence of trans fatty acids on health. Fourth edition. The Danish Nutrition Council; publ. no. 34, 2003.
Stender S., Dyerberg J., Astrup A. Consumer protection through a legislative ban on industrially produced trans fatty acids in Denmark. Scand J Food Nutr 2006;50(4):155-160. doi:10.1080/17482970601069458
Stender S., Dyerberg J., Astrup A. High levels of trans fat in popular fast foods. N Engl J Med 2006;354:1650-1652. doi:10.1056/NEJMc052959
Willett W., Mozaffarian D. Ruminant or industrial sources of trans fatty acids: public health issue or food label skirmish? Am J Clin Nutr 2008;87(3): 515-516. doi:10.1093/ajcn/87.3.515
Carbohydrate ingestion can improve endurance capacity and performance.
The ingestion of different types of carbohydrates, which use different intestinal transporters, can:
increase total carbohydrate absorption;
increase exogenous carbohydrate oxidation;
and therefore improve performance.
Glucose and fructose
When a mixture of glucose and fructose is ingested, in the analyzed literature, respectively 1.2 and 0.6 g/min, ratio 2:1, for total carbohydrate intake rate to 1.8 g/min, there is less competition for intestinal absorption compared with the ingestion of an iso-energetic amount of glucose or fructose, two different intestinal transporters being involved. Furthermore, fructose absorption is stimulated by the presence of glucose.
increase the availability of exogenous carbohydrates in the bloodstream;
cause the higher exogenous carbohydrate oxidation rates in fructose plus glucose combination compared to high glucose intake alone.
The combined ingestion of glucose and fructose allows to obtain exogenous carbohydrate oxidation rate around 1,26 g/min, therefore, higher than the rate reported with glucose alone (1g/min), also in high concentration.
The observed difference, namely, +0,26 g/min, can be fully attributed to the oxidation of ingested fructose.
Sucrose and glucose
The ingestion of sucrose and glucose, in the same conditions of the ingestion of glucose and fructose, therefore, respectively 1.2 and 0.6 g/min, ratio 2:1, for total carbohydrate intake rate to 1.8 g/min, gives similar results.
Glucose, sucrose and fructose
Very high oxidation rates are found with a mixture of glucose, sucrose, and fructose, in the analyzed literature, respectively 1.2, 0.6 and 0.6 g/min, ratio 2:1:1, for total carbohydrate intake rate to 2.4 g/min; however, note the higher amounts of ingested carbohydrates.
Maltodextrin and fructose
High oxidation rates are also observed with combinations of maltodextrin and fructose, in the same conditions of the ingestion of glucose plus fructose, therefore, respectively 1.2 and 0.6 g/min, ratio 2:1, for total carbohydrate intake rate to 1.8 g/min.
Such high oxidation rates can be achieved with carbohydrates ingested in a beverage, in a gel or in a low-fat, low protein, low-fiber energy bar.
The best combination of carbohydrates ingested during exercise seems to be the mixture of maltodextrin and fructose in a 2:1 ratio, in a 5 percent solution, and in a dose around 80-90 g/h.
Oxidation of Ingested Carbohydrates
Why?
This mixture has the best ratio between amount of ingested carbohydrates and their oxidation rate and it means that smaller amounts of carbohydrates remain in the stomach or gut reducing the risk of gastrointestinal complication/discomfort during prolonged exercise.
A solution containing a combination of multiple transportable carbohydrates and a carbohydrate content not exceeding 5% optimizes gastric emptying rate and improves fluid delivery.
Example of a 5 percent carbohydrate solution containing around 80-90 g of maltodextrin and fructose in a 2:1 rate; ingestion time around 1 h.
1.5 L solution: 80 g of carbohydrates, including around 55 g of maltodextrin and around 25 of fructose.
1.8 L solution: 90 g of carbohydrates, including 60 g of maltodextrin and 30 of fructose.
Conclusion
During prolonged exercise, when high exogenous carbohydrate oxidation rates are needed, the ingestion of multiple transportable carbohydrates is preferred above that of large amounts of a single carbohydrate.
The best mixture seems to be maltodextrin and , in a 2:1 ratio, in a 5 percent concentration solution, and at ingestion rate of around 80-90 g/h.
References
Burke L.M., Hawley J.A., Wong S.H.S., & Jeukendrup A. Carbohydrates for training and competition. J Sport Sci 2011;29:Sup1,S17-S27. doi:10.1080/02640414.2011.585473
Jentjens R.L.P.G., Moseley L., Waring R.H., Harding L.K., and Jeukendrup A.E. Oxidation of combined ingestion of glucose and fructose during exercise. J Appl Physiol 2004:96;1277-1284. doi:10.1152/japplphysiol.00974.2003
Jentjens R.L.P.G., Venables M.C., and Jeukendrup A.E. Oxidation of exogenous glucose, sucrose, and maltose during prolonged cycling exercise. J Appl Physiol 2004:96;1285-1291. doi:10.1152/japplphysiol.01023.2003
Jeukendrup A.E. Carbohydrate feeding during exercise. Eur J Sport Sci 2008:2;77-86. doi:10.1080/17461390801918971
Jeukendrup A.E. Nutrition for endurance sports: marathon, triathlon, and road cycling. J Sport Sci 2011:29;sup1, S91-S99. doi:10.1080/02640414.2011.610348
Carotenoids are a class of fat-soluble pigments widely distributed in nature. They are yellow, orange, and red organic compounds composed of eight isoprene units and characterized by many conjugated double bonds. Their hydrocarbon chain can undergo several modifications that significantly influence their biological properties.[1]
Discovered in the first half of the 1800s, carotenoids are synthesized by all photosynthetic organisms, including plants, macroalgae, and microalgae, as well as by some non-photosynthetic organisms such as certain fungi, bacteria, and insects, for example pea aphids, some species of gall midges, and spider mites. In plants and microalgae, they are synthesized and accumulated in plastids.[2][3]
Together with polyphenols and glucosinolates, they form one of the major groups of phytochemicals.[4]
Over the course of evolution, thanks to their chemical and physical properties, carotenoids have proved extremely versatile, as they perform many functions in both plants and animals, among which their antioxidant activity is particularly important. In humans, some carotenoids also serve as vitamin A precursors.[5][6]
More than 750 different carotenoids have been identified. Over 100 have been found in fruits and vegetables, and about 40 are consumed in significant amounts by humans.[7][8]
Because of their colour, carotenoids are used as food additives.[9][10]
Summary: Key Points
Chemical nature: fat-soluble pigments (tetraterpenes) consisting of eight isoprene units with numerous conjugated double bonds.
Classification: divided into carotenes and xanthophylls.
Biological functions: essential for photosynthesis and cellular protection through antioxidant activity.
Human health: act as precursors of vitamin A, support visual function, and help prevent chronic diseases.
Sources and absorption: found in yellow-orange or dark green fruits and vegetables; transported in plasma by lipoproteins, with bioavailability dependent on dietary fat.
Carotenoids were discovered in the first half of the nineteenth century.
The first carotenoid to be isolated was β-carotene, in 1831, thanks to the work of the German pharmacist Heinrich Wilhelm Ferdinand Wackenroder, who named “carotene” the yellow pigment crystallized from carrot roots.[2]
Jöns Jacob Berzelius, considered one of the fathers of modern chemistry, named the yellow pigments extracted from autumn leaves “xanthophylls”, from the Greek xanthos (yellow) and phyllon (leaf).[11][12]
Mikhail Semyonovich Tsvet, a Russian botanist who invented chromatography in 1906, succeeded in separating leaf pigments, chlorophylls, carotenes, and xanthophylls, using column chromatography, and called the yellow-to-orange pigments carotenoids.[1]
Chemical structure
Carotenoids are a class of lipids characterized by a backbone composed of eight isoprene units arranged linearly. Therefore, they are terpenes, specifically tetraterpenes, and consist of 40 carbon atoms.[8]
The isoprene units are joined in a 1,5 positional relationship (i.e., head to tail), except in the middle of the hydrocarbon chain, where the relationship is 1,6 (i.e., tail to tail). This inversion results in a symmetrical molecule.[5]
Carotenoids are characterized by the presence of an extended double-bond system, 3 to 13 of which may be conjugated.[13]
Skeletal Formulas of Some Carotenoids
The hydrocarbon chain of carotenoids can undergo hydrogenation, dehydrogenation, introduction of oxygen atoms, cyclization of one or both ends to form an ionone ring, and esterification with fatty acids.[14] These modifications allow for the formation of many different structures, most of which can be described by the chemical formula C40H56On, with 0 ≤ n ≤ 6.[7]
Traditionally, carotenoids have common names related to the biological source from which they were originally extracted, such as β-carotene (from carrot) or astaxanthin (from lobster), although they can also be named using IUPAC nomenclature.[6][15]
Isomerism
Carotenoids contain many double bonds that can exhibit cis–transisomerism, also known as geometric isomerism. Although, in theory, their double bonds may adopt either a cis or a trans configuration, in nature the trans configuration prevails, as it is thermodynamically more stable due to lower steric hindrance between substituents.[5]
Rotation around single (σ) bonds also allows the formation of conformational isomers. When the double bonds are on the same side with respect to the sigma bond, namely cis relative to the single bond, the conformation is called the s-cis conformation. Conversely, when the double bonds lie on opposite sides, namely trans relative to the single bond, the conformation is called the s-trans conformation.[16]
In nature, acyclic carotenoids occur mainly in the s-trans conformation, as it has the least steric hindrance.[17] When the polyene chain ends with cyclic structures, rotation around the C6–C7 σ bond may lead to the formation of a 6-s-cis isomer, which is sterically less hindered and therefore energetically favored.[18]
It should also be noted that steric hindrance and the size of carotenoid molecules influence their ability to interact with enzymes and to form supramolecular structures.[19]
Most carotenoids possess either a chiral center or a chirality axis, which gives rise to optical isomers. In such cases, to provide an unambiguous name for the molecule, the RS system is used instead of the Fischer−Rosanoff convention, which applies only to carbohydrates and amino acids.[20]
Classification
Carotenoids can be classified according to the presence or absence of oxygen atoms or cyclic structures.[14]
Based on oxygen content, they are divided into xanthophylls and carotenes.
Carotenes, which are oxygen-free molecules, are composed only of carbon and hydrogen atoms and have the chemical formula C40H56. Examples include α-carotene, β-carotene, δ-carotene, ζ-carotene, phytoene, and lycopene.
Xanthophylls contain oxygen atoms and have the chemical formula C40H56On, with 1 ≤ n ≤6. They can be further subdivided into:
hydroxycarotenoids, which contain at least one hydroxyl group, such as α-cryptoxanthin, β-cryptoxanthin, zeaxanthin, and lutein;
epoxycarotenoids, which have at least one epoxy group, such as antheraxanthin, auroxanthin, and luteoxanthin;
ketocarotenoids, which contain one or more carbonyl groups, such as astaxanthin and canthaxanthin.[8]
Depending on the presence or absence of cyclic structures, carotenoids can be classified as cyclic or acyclic.
Cyclic carotenoids contain one or two cyclic structures and are shorter than acyclic carotenoids but exhibit greater steric hindrance. Examples include α-carotene, β-carotene, γ-carotene, and δ-carotene.
Acyclic carotenoids consist of a linear carbon chain. Examples include lycopene, ζ-carotene, phytoene, and phytofluene.
Finally, there are also uncommon or species-specific carotenoids, such as bixin, capsanthin, and capsorubin.[12]
Solubility
Carotenoids are hydrophobic molecules and therefore soluble in organic solvents, with their solubility varying according to the substituents present.[21] Owing to their hydrophobic nature, they are located within cell membranes. In most cases, xanthophylls have polar groups at the ends of the polyene chain, and when incorporated into lipid bilayers they orient themselves so that their polar groups interact with the polar regions of the membrane, thereby minimizing the system’s energy.[22]
Carotenoids can also access the aqueous environment when associated with proteins to which they bind non-covalently. In plasma, they are transported by lipoproteins.[23]
Colour
The conjugated double-bond system, acting as a chromophore, is responsible for the colour of carotenoids.[14] However, only carotenoids with at least seven conjugated double bonds are coloured; thus, phytofluene, which has five conjugated double bonds, and phytoene, which has three, are colourless.[24]
As the number of conjugated double bonds increases, the colour shifts from yellow to orange to red. For example, lutein, α-cryptoxanthin, and violaxanthin are yellow, α-carotene, β-carotene, and γ-carotene are orange, and lycopene is red.[1]
Role in plants
Carotenoids perform a variety of roles in plants.
They contribute to cell protection against oxidative damage, enhance light absorption, serve as precursors of phytohormones such as abscisic acid, and participate in signaling pathways.[5]
Together with chlorophylls and anthocyanins, a class of flavonoids, they also contribute to the colour of leaves, fruits, vegetables, and grains, a colour that attracts animals and promotes pollination and seed dispersal.[25][26]
Finally, carotenoids can act as repellent agents against phytophagous organisms and pathogens.[27]
Quenching of singlet oxygen
In organisms that carry out oxygenic photosynthesis, carotenoids contribute to protection against damage caused by excessive solar radiation.[28]
When the sunlight arriving at the photosystem II antenna complex exceeds the conversion capacity of the reaction centers, the excess energy may cause chlorophyll to remain in its excited state, which can lead to the formation of its triplet state. The excess energy can then be transferred from chlorophyll to molecular oxygen, resulting in the formation of singlet oxygen, a reactive oxygen species capable of damaging the photosynthetic apparatus and, more generally, nucleic acids, proteins, membrane unsaturated fatty acids, and enzyme cofactors.[29]
Carotenoids can prevent oxidative damage caused by singlet oxygen in two ways.
They can directly quench singlet oxygen. In this mechanism, the energy is transferred from singlet oxygen to the carotenoid; the oxygen returns to the triplet ground state, while the carotenoid reaches its triplet state and then releases the excess energy as heat. The capacity to quench singlet oxygen increases with the number of conjugated double bonds, reaching its maximum at nine or more. In vitro studies suggest that monocyclic carotenoids can quench singlet oxygen more efficiently than acyclic ones, and that the presence of carbonyl groups, as in astaxanthin, enhances antioxidant potential compared to carotenoids with hydroxyl groups, likely due to an extended system of conjugated double bonds. It appears that each carotenoid molecule can quench approximately 1,000 singlet oxygen molecules before undergoing degradation.[30]
Carotenoids can prevent the formation of singlet oxygen by absorbing the energy of excited chlorophyll and entering a triplet state themselves. Because the triplet state of carotenoids has a lower energy level than that required to form singlet oxygen, it decays spontaneously to the ground state.[31]
Free radical scavenging activity
Carotenoids are able to scavenge free radicals, such as hydroxyl, peroxyl, superoxide, and nitric oxide radicals. Their action can occur through four different mechanisms.[8][32]
Electron transfer
Carotenoids can donate an electron to a radical cation, forming a carotenoid radical cation while the radical becomes a stable molecule. The carotenoid radical cation can be regenerated to the parent carotenoid by other cellular antioxidants, such as vitamin E, vitamin C, and glutathione.[33]
Proton transfer
A proton may be transferred from the carotenoid to the radical species, which becomes a neutral molecule, while the carotenoid forms a radical anion.[34]
Addition reactions
Neutralization of free radicals can also occur via addition reactions, as in the case of hydroxyl and peroxyl radicals.[13]
Hydrogen atom transfer
A hydrogen atom can be transferred from the carotenoid to the reactive oxygen species, forming a resonance-stabilized neutral carotenoid radical.[19]
Light-harvesting role
Carotenoids are present in antenna complexes as accessory light-harvesting pigments, mainly associated with antenna proteins.[35]
Thanks to their system of conjugated double bonds, they are able to absorb sunlight in the 400–500 nm range, after which the absorbed energy is transferred to the reaction centers. The absorption spectra of individual carotenoids depend on the length of the conjugated system and the functional groups present.[17]
The main carotene involved in light harvesting is β-carotene, located in the core of photosystems I and II in all organisms that carry out oxygenic photosynthesis. Lutein, violaxanthin, neoxanthin, and zeaxanthin, the main xanthophylls in plants, are bound to the light-harvesting complexes.[36]
Food sources
Humans are not able to synthesize carotenoids. They obtain them from food and store them mainly in the liver and adipose tissue, but also in the lungs, kidneys, brain, and bones, where they perform several functions.[13]
Among all the carotenoids identified, about one hundred have been found in foods consumed by humans. However, within a single food item, there are usually one to six major carotenoids, together with others present only in trace or small amounts.[37]
Fruits and vegetables are the major sources of carotenoids in the human diet. Among vegetables, leafy greens are rich in β-carotene, the most abundant carotenoid in the human diet and in human tissues, and in lutein, followed by violaxanthin and neoxanthin. The carrot root is rich in β-carotene, pumpkin in α-carotene, tomato in lycopene, and peppers in capsanthin and capsorubin. Carotenoids in fruits are highly variable, and their composition often differs between unripe and ripe fruits. Moreover, most carotenoids present in ripe fruits are esterified with fatty acids, whereas fruits that remain green when ripe, such as kiwifruit, show limited or no esterification.[21]
Chicken eggs are also good sources of carotenoids, particularly lutein and zeaxanthin, because laying hens generally consume corn. These carotenoids are responsible for the yellow–orange colour of egg yolk.[38]
Finally, mollusks and crustaceans, together with fish, are major dietary sources of carotenoids produced by microalgae and rarely found in plants, such as astaxanthin, which accumulates in shrimp and contributes to the coloration of salmon.[39]
Food additives
Carotenoids used in the food industry as additives, unlike naturally occurring carotenoids, are relatively unstable. They are susceptible to oxygen and sunlight, auto-oxidation, and dispersion into food ingredients, which facilitates their degradation.[21] Furthermore, at body temperature and food-storage temperatures, added carotenoids are in crystalline form because of their high melting point; to overcome this issue, they are incorporated as oil-in-water emulsions.[40]
Thanks to their colouring power, they are used as colours in foods that lose part of their natural colour due to processing or storage, to standardize product appearance, as in beverages, fruit juices, or sausages, or to intensify colour and improve visual appeal.[41]
Carotenoids are also precursors of compounds responsible for the flavor and aroma of certain foods; therefore, they can be used as flavour enhancers.[42]
In addition, some carotenoids are vitamin A precursors and are used to fortify foods.[43]
It should also be noted that carotenoids, when added to foods, are not powerful antioxidants.[44]
Their most important role is to act as precursors of vitamin A, which regulates the expression of nearly 700 genes. Not all carotenoids have provitamin A activity; only those with an unsubstituted β-ionone ring do. The most significant is β-carotene which, having two unsubstituted β-ionone rings, can be converted into two molecules of vitamin A. α-Carotene and β-cryptoxanthin, each containing a single unsubstituted β-ionone ring, yield one molecule of vitamin A, and therefore have 50% of the provitamin A activity of β-carotene.[13]
The importance of provitamin A carotenoids is highlighted by the fact that vitamin A deficiency can lead to night blindness and xerophthalmia, delay the growth and regeneration of mucous membranes, increase mortality due to immunological dysfunctions during infectious diseases, and represents the leading cause of childhood blindness in developing countries.[46]
Carotenoids also contribute to human health through mechanisms unrelated to provitamin A activity, such as antioxidant and anti-inflammatory actions and photoprotection. Examples include the following.
Supplementation with lutein and zeaxanthin, two xanthophylls that accumulate in the macula lutea, has been associated with improved visual function and a reduced risk of progression of age-related macular degeneration. Lutein and zeaxanthin also appear to reduce the risk of cataracts and retinopathies, and lutein may have beneficial effects on cognitive functions.[47]
Among carotenes, the consumption of lycopene-rich foods has been associated with a reduced incidence of several types of cancer, such as prostate and stomach cancer, as well as a lower cardiovascular risk.[48]
Plasma carotenoids
α-Carotene, β-carotene, lycopene, lutein, β-cryptoxanthin, and zeaxanthin account for more than 90% of the carotenoids present in plasma.[49]
Plasma carotenoid concentrations depend on several factors, including cooking methods, dietary fat intake, and individual differences in lipid digestion and lipid absorption, processes in which bile salts play an essential role. Vitamin A status also influences plasma levels: individuals with low vitamin A stores may have higher conversion rates of provitamin A carotenoids, which can result in lower circulating concentrations.[50][51]
References
^ abc Maoka T. Carotenoids as natural functional pigments. J Nat Med 2020;74(1):1-16. doi:10.1007/s11418-019-01364-x
^ ab Sourkes T.L. The discovery and early history of carotene. Bull Hist Chem 2009;34(1):32-37.
^ Aizpuru A., González-Sánchez A. Traditional and new trend strategies to enhance pigment contents in microalgae. World J Microbiol Biotechnol 2024;40(9):272. doi:10.1007/s11274-024-04070-3
^ de la Rosa L.A., Alvarez-Parrilla E., Gonzàlez-Aguilar G.A. Fruit and vegetable phytochemicals: chemistry, nutritional value, and stability. 1st Edition. Wiley J. & Sons, 2010.
^ abcd Swapnil P., Meena M., Kumar Singh S., Praveen Dhuldhaj U., Harish, Marwal A. Vital roles of carotenoids in plants and humans to deteriorate stress with its structure, biosynthesis, metabolic engineering and functional aspects. Curr Plant Biol 2021;26: 100203. doi:10.1016/j.cpb.2021.100203
^ ab Crupi P., Faienza M.F., Naeem M.Y., Corbo F., Clodoveo M.L., Muraglia M. Overview of the potential beneficial effects of carotenoids on consumer health and well-being. Antioxidants (Basel) 2023;12(5):1069. doi:10.3390/antiox12051069
^ ab Desmarchelier C., Borel P. Overview of carotenoid bioavailability determinants: from dietary factors to host genetic variations. Trends Food Sci Technol 2017;69(Part B):270-280. doi:10.1016/j.tifs.2017.03.002
^ Gebhardt B., Sperl R., Carle R., Müller-Maatsch J. Assessing the sustainability of natural and artificial food colorants. J Clean Prod 2020;260;120884. doi:10.1016/j.jclepro.2020.120884
^ EFSA Food colours. Last reviewed date: 14 November 2025.
^ Olson J.A., Krinsky N.I. Introduction: the colorful, fascinating world of the carotenoids: important physiologic modulators. FASEB J 1995;9(15):1547-50. doi:10.1096/fasebj.9.15.8529833
^ ab Britton G., Liaaen-Jensen S., Pfander H. Carotenoids: Handbook. Basel: Birkhäuser; 2004. doi:10.1007/978-3-0348-7836-4
^ abcd Saini R.K., Prasad P., Lokesh V., Shang X., Shin J., Keum Y.S., Lee J.H. Carotenoids: dietary sources, extraction, encapsulation, bioavailability, and health benefits – A review of recent advancements. Antioxidants 2022;11(4):795. doi:10.3390/antiox11040795
^ abc Zia-Ul-Haq M., Dewanjee S., Riaz M. Carotenoids: structure and function in the human body. Springer; 2021. doi:10.1007/978-3-030-46459-2_1
^ Yabuzaki J. Carotenoids database: structures, chemical fingerprints and distribution among organisms. Database (Oxford) 2017;2017(1):bax004. doi:10.1093/database/bax004
^ Solomons T.W.G., Fryhle C.B., Snyder S.A. Solomons’ organic chemistry. 12th Edition. John Wiley & Sons Incorporated, 2017.
^ ab Telegina T.A., Vechtomova Y.L., Aybush A.V., Buglak A.A., Kritsky M.S. Isomerization of carotenoids in photosynthesis and metabolic adaptation. Biophys Rev 2023;15(5):887-906. doi:10.1007/s12551-023-01156-4
^ Britton G. Structure and properties of carotenoids in relation to function. FASEB J 1995;9(15):1551-8. doi:10.1096/fasebj.9.15.8529834
^ ab Polyakov N.E., Focsan A.L., Gao Y., Kispert L.D. The endless world of carotenoids-Structural, chemical and biological aspects of some rare carotenoids. Int J Mol Sci 2023;24(12):9885. doi:10.3390/ijms24129885
^ Prelog V., Helmchen G. Basic principles of the CIP‐system and proposals for a revision. Angew Chem 1982:21(8);567-583. doi:10.1002/anie.198205671
^ abc González-Peña M.A., Ortega-Regules A.E., Anaya de Parrodi C., Lozada-Ramírez J.D. Chemistry, occurrence, properties, applications, and encapsulation of carotenoids-A review. Plants (Basel) 2023;12(2):313. doi:10.3390/plants12020313
^ Gruszecki W.I., Strzałka K. Carotenoids as modulators of lipid membrane physical properties. Biochim Biophys Acta 2005;1740(2):108-15. doi:10.1016/j.bbadis.2004.11.015
^ Tyssandier V., Choubert G., Grolier P., Borel P. Carotenoids, mostly the xanthophylls, exchange between plasma lipoproteins. Int J Vitam Nutr Res 2002;72(5):300-8. doi:10.1024/0300-9831.72.5.300
^ Rodriguez-Amaya D.B., Esquivel P., Meléndez-Martínez A.J. Comprehensive update on carotenoid colorants from plants and microalgae: challenges and advances from research laboratories to industry. Foods 2023;12(22):4080. doi:10.3390/foods12224080
^ Archetti, M., Döring T.F., Hagen S.B., Hughes N.M., Leather S.R., Lee D.W., Lev-Yadun S., Manetas Y., Ougham H.J. Unravelling the evolution of autumn colours: an interdisciplinary approach. Trends Ecol Evol 2009;24(3):166-73. doi:10.1016/j.tree.2008.10.006
^ Cazzonelli C.I. Carotenoids in nature: insights from plants and beyond. Funct Plant Biol 2011;38(11):833-847.
^ Gómez-Sagasti M.T., López-Pozo M., Artetxe U., Becerril J.M., Hernández A., García-Plazaola J.I., Esteban R. Carotenoids and their derivatives: a “swiss army knife-like” multifunctional tool for fine-tuning plant-environment interactions. Environ Exp Bot 2023;207:105229. doi:10.1016/j.envexpbot.2023.105229
^ Havaux M. Carotenoids as membrane stabilizers in chloroplasts. Trends Plant Sci 1998;3(4):147-151. doi:10.1016/S1360-1385(98)01200-X
^ Triantaphylidès C., Havaux M. Singlet oxygen in plants: production, detoxification and signaling. Trends Plant Sci 2009;14(4):219-28. doi:10.1016/j.tplants.2009.01.008
^ Ramel F., Birtic S., Cuiné S., Triantaphylidès C., Ravanat J.L., Havaux M. Chemical quenching of singlet oxygen by carotenoids in plants. Plant Physiol 2012;158(3):1267-78. doi:10.1104/pp.111.182394
^ Pérez-Gálvez A., Viera I., Roca M. Carotenoids and chlorophylls as antioxidants. Antioxidants (Basel) 2020;9(6):505. doi:10.3390/antiox9060505
^ Krinsky N.I. Antioxidant functions of carotenoids. Free Radic Biol Med 1989;7(6):617-35. doi:10.1016/0891-5849(89)90143-3
^ Ribeiro D., Freitas M., Silva A.M.S., Carvalho F., Fernandes E. Antioxidant and pro-oxidant activities of carotenoids and their oxidation products. Food Chem Toxicol 2018;120:681-699. doi:10.1016/j.fct.2018.07.060
^ Focsan A.L., Kispert L.D. Radicals formed from proton loss of carotenoid radical cations: a special form of carotenoid neutral radical occurring in photoprotection. J Photochem Photobiol B 2017;166:148-157. doi:10.1016/j.jphotobiol.2016.11.015
^ Cogdell R.J., Gillbro T., Andersson P.O., Liu R.S.H., Asato A.E. Carotenoids as accessory light-harvesting pigments. Pure Appl Chem 1994:66(5):1041-1046. doi:10.1351/pac199466051041
^ Xu P., Chukhutsina V.U., Nawrocki W.J., Schansker G., Bielczynski L.W., Lu Y., Karcher D., Bock R., Croce R. Photosynthesis without β-carotene. eLife 2020;9:e58984. doi:10.7554/eLife.58984
^ Meléndez-Martínez A.J., Mandić A.I., Bantis F., et al. A comprehensive review on carotenoids in foods and feeds: status quo, applications, patents, and research needs. Crit Rev Food Sci Nutr 2022;62(8):1999-2049. doi:10.1080/10408398.2020.1867959
^ Ko E.Y., Saini R.K., Keum Y.S., An B.K. Age of laying hens significantly influences the content of nutritionally vital lipophilic compounds in eggs. Foods 2020;10(1):22. doi:10.3390/foods10010022
^ Galasso C., Corinaldesi C., Sansone C. Carotenoids from marine organisms: biological functions and industrial applications. Antioxidants (Basel) 2017;6(4):96. doi:10.3390/antiox6040096
^ Kirkhus B., Afseth N.K., Borge G.I.A., Grimsby S., Steppeler C., Krona A., Langton M. Increased release of carotenoids and delayed in vitro lipid digestion of high pressure homogenized tomato and pepper emulsions. Food Chem 2019;285:282-289. doi:10.1016/j.foodchem.2019.01.124
^ Mezzomo N., Ferreira S.R.S. Carotenoids functionality, sources, and processing by supercritical technology: a review. J Chem 2016;1:Article ID 3164312. doi:10.1155/2016/3164312
^ Meléndez-Martínez A.J., Esquivel P., Rodriguez-Amaya D.B. Comprehensive review on carotenoid composition: transformations during processing and storage of foods. Food Res Int 2023;169:112773. doi:10.1016/j.foodres.2023.112773
^ Hombali A.S., Solon J.A., Venkatesh B.T., Nair N.S., Peña-Rosas J.P. Fortification of staple foods with vitamin A for vitamin A deficiency. Cochrane Database Syst Rev 2019;5(5):CD010068. doi:10.1002/14651858.CD010068.pub2
^ Terao J. Revisiting carotenoids as dietary antioxidants for human health and disease prevention. Food Funct 2023;14:7799-7824. doi:10.1039/d3fo02330c
^ Eggersdorfer M., Wyss A. Carotenoids in human nutrition and health. Arch Biochem Biophys 2018;652:18-26. doi:10.1016/j.abb.2018.06.001
^ Hodge C., Taylor C. Vitamin A deficiency. [Updated 2023 Jan 2]. In: StatPearls [Internet]. Treasure Island (FL): StatPearls Publishing; 2025 Jan-. Available from: https://www.ncbi.nlm.nih.gov/books/NBK567744/
^ Mrowicka M., Mrowicki J., Kucharska E., Majsterek I. Lutein and zeaxanthin and their roles in age-related macular degeneration-neurodegenerative disease. Nutrients 2022;14(4):827. doi:10.3390/nu14040827
^ Khan U.M., Sevindik M., Zarrabi A., et al. Lycopene: food sources, biological activities, and human health benefits. Oxid Med Cell Longev 2021;2021:2713511. doi:10.1155/2021/2713511
^ Deming D.M., Erdman Jr J.W. Mammalian carotenoid absorption and metabolism. Pure Appl Chem 1999;71(12):2213-2223.
^ Burrows T.L., Williams R., Rollo M., Wood L., Garg M.L., Jensen M., Clare Collins C.E. Plasma carotenoid levels as biomarkers of dietary carotenoid consumption: a systematic review of the validation studies. J Nutr Intermed Metab 2015;2(1-2):15-64. doi:10.1016/j.jnim.2015.05.001
^ Böhm V., Lietz G., Olmedilla-Alonso B., et al. From carotenoid intake to carotenoid blood and tissue concentrations – implications for dietary intake recommendations. Nutr Rev 2021;79(5):544-573. doi:10.1093/nutrit/nuaa008
Carbohydrate loading is a good strategy to increase fuel stores in muscles before the start of the competition.
What does the muscle “eat” during endurance exercise?
Muscle “eats” carbohydrates, in the form of liver and muscle glycogen, carbohydrates ingested during the exercise or just before that, and fat.
During endurance exercise, the most likely contributors to fatigue are dehydration and carbohydrate depletion, especially of muscle and liver glycogen.
To prevent the “crisis” due to the depletion of muscle and liver carbohydrates, it is essential having high glycogen stores before the start of the activity.
What does affect glycogen stores?
The diet in the days before the competition.
The level of training (well-trained athletes synthesize more glycogen and have potentially higher stores, because they have more efficient enzymes).
The activity in the day of the competition and the days before (if muscle doesn’t work it doesn’t lose glycogen). Therefore, it is better to do light trainings in the days before the competition, not to deplete glycogen stores, and to take care of nutrition.
The “Swedish origin” of carbohydrate loading
Very high muscle glycogen levels, the so-called glycogen supercompensation, can improve performance, i.e. time to complete a predetermined distance, by 2-3% in the events lasting more than 90 minutes, compared with low to normal glycogen, while benefits seem to be little or absent when the duration of the event is less than 90 min.
Well-trained athletes can achieve glycogen supercompensation without the depletion phase prior to carbohydrate loading, the old technique discovered by two Swedish researchers, Saltin and Hermansen, in 1960s.
The researchers discovered that muscle glycogen concentration could be doubled in the six days before the competition following this diet:
three days of low carb menu (a nutritional plan very poor in carbohydrates, i.e. without pasta, rice, bread, potatoes, legumes, fruits etc.);
three days of high carbohydrate diet, the so-called carbohydrate loading (a nutritional plan very rich in carbohydrates).
This diet causes a lot of problems: the first three days are very hard and there may be symptoms similar to depression due to low glucose delivery to brain, and the benefits are few.
Moreover, with the current training techniques, the type and amount of work done, we can indeed obtain high levels of glycogen: above 2.5 g/kg of body weight.
The “corrent” carbohydrate loading
If we compete on Sunday, a possible training/nutritional plan to obtain supercompensation of glycogen stores can be the following:
Wednesday, namely four days before the competition, moderate training and then dinner without carbohydrates;
from Thursday on, namely the three days before the competition, hyperglucidic diet and light trainings.
Example of Carbohydrate Loading
The amount of dietary carbohydrates needed to recover glycogen stores or to promote glycogen loading depends on the duration and intensity of the training programme, and they span from 5 to 12 g/kg of body weight/d, depending on the athlete and his activity. With higher carbohydrate intake you can achieve higher glycogen stores but this does not always results in better performance. Moreover, it should be noted that glycogen storage is associated with weight gain due to water retention (approximately 3 g per gram of glycogen), and this may not be desirable in some sports.
References
Burke L.M., Hawley J.A., Wong S.H.S., & Jeukendrup A. Carbohydrates for training and competition. J Sport Sci 2011;29:Sup1,S17-S27. doi:10.1080/02640414.2011.585473
Hargreaves M., Hawley J.A., & Jeukendrup A.E. Pre-exercise carbohydrate and fat ingestion: effects on metabolism and performance. J Sport Sci 2004;22:31-38. doi10.1080/0264041031000140536
Jeukendrup A.E., C. Killer S.C. The myths surrounding pre-exercise carbohydrate feeding. Ann Nutr Metab 2010;57(suppl 2):18-25. doi:10.1159/000322698
Moseley L., Lancaster G.I, Jeukendrup A.E. Effects of timing of pre-exercise ingestion of carbohydrate on subsequent metabolism and cycling performance. Eur J Appl Physiol 2003;88:453-458. doi:10.1007/s00421-002-0728-8
“The acid-ash hypothesis posits that protein and grain foods, with a low potassium intake, produce a diet acid load, net acid excretion, increased urine calcium, and release of calcium from the skeleton, leading to osteoporosis.” (Fenton et al., 2009, see References).
Is it true?
Calcium, present in bones in form of carbonates and phosphates, represents a large reservoir of base in the body. In response to an acid load such as the high protein diets these salts are released into the circulation to bring about pH homeostasis. This calcium is lost in the urine and it has been estimated that the quantity lost with the such diet over time could be as high as almost 480 g over 20 years or almost half the skeletal mass of calcium!
Even these losses of calcium may be buffered by ingestion of foods that are alkali rich as fruit and vegetables, and on-line information promotes an alkaline diet for bone health as well as a number of books, a recent meta-analysis has shown that the causal association between osteoporotic bone disease and dietary acid load is not supported by evidence and there is no evidence that the alkaline diet is protective of bone health, but it is protective against the risk for kidney stones.
Note: it is possible that fruit and vegetables are beneficial to bone health through mechanisms other than via the acid-ash hypothesis.
What is the role of proteins?
Excess dietary proteins with high acid renal load may decrease bone density, if not buffered by ingestion of foods that are alkali rich, that is fruit and vegetables. However, an adequate protein intake is needed for the maintenance of bone integrity. Therefore, increasing the amount of fruit and vegetables may be necessary rather than reducing protein too much.
Therefore it is advisable to consume a normo-proteic diet rich in fruits and vegetables and poor in sodium, such as medieterranean diet, eating foods with a negative acid load together with foods with a positive acid load. Example: pasta plus vegetables or meats plus vegetables and fruits .
Food and Acid Load
Alkaline diet and muscle mass
As we age, there is a loss of muscle mass, which predispose to falls and fractures. A diet rich in potassium, obtained from fruits and vegetables, as well as a reduced acid load, results in preservation of muscle mass in older men and women.
Alkaline diet and growth hormone
In children, severe forms of metabolic acidosis are associated with low levels of growth hormone with resultant short stature. Its correction with potassium or bicarbonate citrate increases growth hormone significantly and improves growth.
In postmenopausal women, the use of enough potassium bicarbonate in the diet to neutralize the daily net acid load resulted in a significant increase in growth hormone and resultant osteocalcin.
Improving growth hormone levels may reduce cardiovascular risk factors, improve quality of life, body composition, and even memory and cognition.
Conclusion
Alkaline diet may result in a number of health benefits.
Increased fruits and vegetables would improve the potassium/sodium ratio and may benefit bone health, reduce muscle wasting, as well as mitigate other chronic diseases such as hypertension and strokes.
The increase in growth hormone may improve many outcomes from cardiovascular health to memory and cognition.
The increase in intracellular magnesium is another added benefit of the alkaline diet; for example, magnesium, required to activate vitamin D, would result in numerous added benefits in the vitamin D systems.
It should be noted that one of the first considerations in an alkaline diet, which includes more fruits and vegetables, is to know what type of soil they were grown in since this may significantly influence the mineral content and therefore their buffering capacity.
References
Fenton T.R., Lyon A.W., Eliasziw M., Tough S.C., Hanley D.A. Meta-analysis of the effect of the acid-ash hypothesis of osteoporosis on calcium balance. J Bone Miner Res 2009;24(11):1835-1840. doi:10.1359/jbmr.090515
Fenton T.R., Lyon A.W., Eliasziw M., Tough S.C., Hanley D.A. Phosphate decreases urine calcium and increases calcium balance: a meta-analysis of the osteoporosis acid-ash diet hypothesis. Nutr J 2009;8:41. doi:10.1186/1475-2891-8-41
Fenton T.R., Tough S.C., Lyon A.W., Eliasziw M., Hanley D.A. “Causal assessment of dietary acid load and bone disease: a systematic review and meta-analysis applying Hill’s epidemiologic criteria for causality.” Nutr J 2011;10:41. doi:10.1186/1475-2891-10-41
Schwalfenberg G.K. The alkaline diet: is there evidence that an alkaline pH diet benefits health? J Environ Public Health 2012; Article ID 727630. doi:10.1155/2012/727630
Life depends on appropriate pH levels around and in living organisms and cells.
We requires a tightly controlled pH level in our serum of about 7.4 to avoid metabolic acidosis and survive. As a comparison, in the past 100 years the pH of the ocean has dropped from 8.2 to 8.1 because of increasing carbon dioxide deposition with a negative impact on life in the ocean.
The pH Scale
Even the mineral content of the food we eat is considerable influenced by the pH of the soil in which plants are grown. The ideal pH of soil for the best overall availability of essential nutrients is between 6 and 7: an acidic soil below pH of 6 may have reduced magnesium and calcium, and soil above pH 7 may result in chemically unavailable zinc, iron, copper and manganese.
Metabolic acidosis and agricultural and industrial revolutions
In the human diet, there has been considerable change from the hunter gather civilization to the present in the pH and net acid load. With the agricultural revolution, in the last 10,000 years, and even more recently with industrialization, in the last 200 years, it has been seen:
an increase in sodium compared to potassium, as the ratio potassium/sodium has reversed from 10 to 1 to a ratio of 1 to 3 in the modern diet, and in chloride compared to bicarbonate;
This results in a diet that may induce metabolic acidosis which is mismatched to the genetically determined nutritional requirements.
Moreover, with aging, there is a gradual loss of renal acid-base regulatory function and a resultant increase in diet-induced metabolic acidosis.
Finally, a high protein low-carbohydrate diet with its increased acid load results in very little change in blood chemistry, and pH, but results in many changes in urinary chemistry: urinary calcium, undissociated uric acid, and phosphate are increased, while urinary magnesium, urinary citrate and pH are decreased.
All this increases the risk for kidney stones.
pH as a protective barrier
The human body has an amazing ability to maintain a steady pH in the blood, with the main compensatory mechanisms being renal and respiratory.
pH levels in the body vary considerably from one area to another. The highest acidity is found in the stomach (pH of 1.35 to 3.5), aiding digestion and protecting against opportunistic microbial organisms.
Skin is quite acidic (pH 4–6.5), providing an acid mantle as a protective barrier against microbial overgrowth. This is also seen in the vagina, where a pH of less than 4.7 helps prevent microbial overgrowth.
The urine have a variable pH from acid to alkaline depending on the need for balancing the internal environment.
Values and role of pH in some body fluids and tissues
Modified from: Schwalfenberg G.K.; see in References
References
Fenton T.R., Lyon A.W., Eliasziw M., Tough S.C., Hanley D.A. Meta-analysis of the effect of the acid-ash hypothesis of osteoporosis on calcium balance. J Bone Miner Res 2009;24(11):1835-1840. doi:10.1359/jbmr.090515
Fenton T.R., Lyon A.W., Eliasziw M., Tough S.C., Hanley D.A. Phosphate decreases urine calcium and increases calcium balance: a meta-analysis of the osteoporosis acid-ash diet hypothesis. Nutr J 2009;8:41. doi:10.1186/1475-2891-8-41
Fenton T.R., Tough S.C., Lyon A.W., Eliasziw M., Hanley D.A. Causal assessment of dietary acid load and bone disease: a systematic review and meta-analysis applying Hill’s epidemiologic criteria for causality. Nutr J 2011;10:41. doi:10.1186/1475-2891-10-41
Schwalfenberg G.K. The alkaline diet: is there evidence that an alkaline pH diet benefits health? J Environ Public Health 2012; Article ID 727630. doi:10.1155/2012/727630
The international scientific literature is unanimous in setting the lower limit for the daily caloric intake to 1200 kcal for women and 1500 kcal for men (adults).
To make negative the daily caloric intake, and therefore lose body weight, but expecially lose body fat, evaluation of actual caloric needs of the subject will be alongside:
the correct distribution of meals during the day;
an increased physical activity, by which the negative balance can be achieved without major sacrifices during meals.
Daily Caloric Balance
This will make weight loss easier and protect from subsequent weight gains and yo-yo effect.
Ultimately, there must be a change in lifestyle.
So, the best strategy for losing body fat is not a drastic reduction in caloric intake, nor follow constrictive or “strange” diets, such as hcg diet plan, sacred heart diet, paleo diet, etc., that require to eliminate or greatly reduce the intake of certain macronutrients, mostly carbohydrates. Such conducts can be:
very stressful from psychological point of view;
not passable for long periods;
hazardous to health because of inevitable nutrient deficiencies.
Finally, they do not ensure that all the weight lost is only or almost only body fat and are often followed by substantial increases in body weight and/or by yo-yo effect.
Why?
Body fat and reduction of energy intake
An excessive reduction of energy intake means eating very little. This determines the risk, high, not to take adequate amounts of the various essential nutrients, that is, what we can’t synthesize, such as vitamins, certain amino acids, essential fatty acids, a class of lipids, and minerals, including, e.g., calcium and iron. This results in a depression of metabolism and hence a reduction in energy expenditure. Whether the reduction in energy intake is excessive, or even there are periods of fasting, it adds insult to injury because a proportion of free fatty mass will be lost. How?
Reduction in energy intake and role of carbohydrates
Glucose is the only energy source for red blood cells and some brain areas, while other brain areas can also derive energy from ketone bodies, which are a product of the metabolism of fatty acids.
At rest, brain extracts 10 percent of the glucose from the bloodstream, a significant amount, about 75 mg/min., considering that its weight is about 1.5 kg. To maintain a constant glycemia, and thus ensure a constant supply of glucose to tissues, we needs to take carbohydrates or alternatively amino acids..
In the case of a low or absent dietary intake of carbohydrates, whereas after about 18 hours liver glycogen, which releases glucose into circulation, depletes, body synthesizes de novo glucose from certain amino acids through a process called gluconeogenesis (actually this metabolic pathway is active even after a normal meal but increases its importance in fasting).
But what’s the main source of amino acids in the body when their dietary intake is low or absent? Endogenous proteins, and there is a hierarchy in their use that is before we consume the less important and only after the most important ones. For the first digestive enzymes, pepsin, chymotrypsin, elastase, carboxypeptidase and aminopeptidase, around 35-40 g, will be used. Successively, liver and pancreas slow down their synthesis activities for export proteins and unused amino acids are directed to gluconeogenesis. It’s clear that these are quite modest reserves of amino acids and it is the muscle that will undertake to provide the required amounts of amino acids that is proteolysis of muscle proteins begins.
Note: anyway, there is no absolute sequentiality in the degradation of several proteins, there is instead a plot in which, proceeding, some ways lose their importance and others will buy.
Therefore, to maintain constant glycemia the protein component of muscle is reduced, including skeletal muscle that is a tissue that represents a fairly good portion of the value of the basal metabolism and that, with exercise, can significantly increase its energy consumption: thus essential for weight loss and subsequent maintenance. It is as if the engine capacity was reduced.
One thing which we don’t think about is that heart is a muscle that may be subject to the same processes seen for skeletal muscle.
Ultimately make glucose from proteins, also food-borne, is like heat up the fire-place burning the furniture of the eighteenth century, amino acids, having available firewood, dietary carbohydrates.
Therefore, an adequate intake of carbohydrates with diet prevents excessive loss of proteins, namely, there is a saving effect of proteins played by carbohydrates.
Mammals, and therefore humans, can’t synthesize glucose from fats.
What goes in when carbohydrates goes out?
The elimination or substantial reduction in carbohydrate intake in the diet results in an increased intake of proteins, lipids, including cholesterol, because it will increase the intake of animal products, one of the main defects in hyperproteic diet. In the body there are no amino acids reserves, thus they are metabolized and, as a byproduct of their use, ammonia is formed and it’ll be eliminated as toxic.
For this reason high-protein diets imply an extra work for liver and kidneys and also for this they are not without potential health risks.
An increased fat intake often results into an increased intake of saturated fatty acids, trans fatty acids, and cholesterol, with all the consequences this may have on cardiovascular health.
What has been said so far should not induce to take large amounts of carbohydrates; this class of macronutrients should represent 55-60 percent of daily calories, fats 25-30 percent, primarily olive oil, and the remainder proteins: thus a composition in macronutrient that refers to prudent diet or mediterranean diet.
Body fat and the entry in a phase of famine/disease
A excessive reduction in caloric intake is registered by our defense mechanisms as an “entry” in a phase of famine/disease.
The abundance of food is a feature of our time, at least in industrialized countries, while our body evolved over hundreds of thousands of years during which there was no current abundance: so it’s been programmed to try to overcome with minimal damage periods of famine. If caloric intake is drastically reduced it mimics a famine: what body does is to lower consumption, lower the basal metabolism, that is, consumes less and therefore also not eating much we will not get great results. It is as if a machine is lowered the displacement, it’ll consume less (our body burns less body fat).
Yo-yo effect
Yo-yo effect or weight cycling, namely, repeated phases of loss and weight gain, appears related to excess weight and accumulation of fat in the abdomen.
Several studies suggest a link in women with:
Lastly, yo-yo effect is related to a greater easy to gain weight than those who are not subject to it. In this regard there should be emphasized that the weight cycling occurs over years, during which, aging, the rate of metabolism inevitably tends to decrease: this could make more difficult the subsequent losses.
References
Cereda E., Malavazos A.E., Caccialanza R., Rondanelli M., Fatati G. and Barichella M. Weight cycling is associated with body weight excess and abdominal fat accumulation: a cross-sectional study. Clin Nutr 2011;30(6):718-723. doi:10.1016/j.clnu.2011.06.009
Montani J-P., Viecelli A.K., Prévot A. & Dulloo A.G. Weight cycling during growth and beyond as a risk factor for later cardiovascular diseases: the ‘repeated overshoot’ theory. Int J Obes (Lond) 2006;30:S58-S66. doi:10.1038/sj.ijo.0803520
Ravussin E., Lillioja S., Knowler W.C., Christin L., Freymond D., Abbott W.G.H., Boyce V., Howard B.V., and Bogardus C. Reduced rate of energy expenditure as a risk factor for body-weight gain. N Engl J Med 1988;318:467-472. doi:10.1056/NEJM198802253180802
Sachiko T. St. Jeor S.T. St., Howard B.V., Prewitt T.E., Bovee V., Bazzarre T., Eckel T.H., for the AHA Nutrition Committee. Dietary Protein and Weight Reduction. A Statement for Healthcare Professionals From the Nutrition Committee of the Council on Nutrition, Physical Activity, and Metabolism of the American Heart Association. Circulation 2001;104:1869-1874. doi:10.1161/hc4001.096152
Muscle glycogen is an important energy source for prolonged moderate to high intensity exercise, an importance that increases during high-intensity interval exercise, common in training session of swimmers, runners, rowers or in team-sport players, or during resistance exercise. For example, considering marathon, about 80% of energy needed comes from carbohydrate oxidation, for the most part skeletal muscle glycogen.
Fatigue and low muscle glycogen levels are closely correlated, but the underlying molecular mechanisms remain elusive. One hypothesis is that there is a minimum glycogen concentration that is “protected” and is not used during exercise, perhaps to ensure an energy reserve in case of need.
Due to the closely relationship between skeletal muscle glycogen depletion and fatigue, its re-synthesis rate during post-exercise is one of the most important factors in determining necessary recovery time.
Finally, the highly trained athlete has muscle glycogen stores potentially higher and is also able to synthesize it faster due to more efficient enzymes.
Glycogen Molecule: the Branched Structure, the Tiers, and Glycogenin
To synthesize glycogen it is necessary to ingest carbohydrates; but how many, which, when, and how often?
The two phases of muscle glycogen synthesis after exercise
In order to restore as quickly as possible muscle glycogen depots, it is useful to know that, as a result of training sessions that deplete muscle glycogen to values below 75 percent those at rest and not fasting, glycogen synthesis occurs in two phases.
To know and therefore take advantage of the biphasicity is important for those athletes who are engaged in more daily training sessions, or who otherwise have little time for recovery between a high intensity exercise and the subsequent one, less than 8 hours, in order to maximize glycogen synthesis and achieve the optimal performance during a second close exercise session.
The two phases are characterized by:
a different sensitivity to circulating insulin levels;
a different velocity.
The first phase
This phase, immediately following the end of an activity and lasting 30-60 minutes, is insulin-independent, i.e., glucose uptake by muscle cell as glycogen synthesis are independent from hormone action. It is characterized by an elevated rate of synthesis that however decreases rapidly if you do not take in carbohydrates: the maximum rate is in the first 30 minutes, then declines to about one fifth in 60 minutes, and to about one ninth in 120 minutes from the end of exercise.
How is it possible to take advantage of this first phase to replenish muscle glycogen stores as much as possible? By making sure that the greatest possible amount of glucose arrives to muscle in the phase immediately following to the end of exercise, best if done within the first 30 minutes.
What should one eat?
High glycemic index, but easy to digest and absorb, carbohydrates. Therefore, it is advisable to replace foods, even though of high glycemic index, that need some time for digestion and the subsequent absorption, with solutions/gel containing for example glucose and/or sucrose. These solutions ensure the maximal possible absorption rate and resupply of glucose to muscle because of they contain only glucose and are without fiber or anything else that could slow carbohydrate digestion and the following absorption of monosaccharides, that is, they are capable of producing high blood glucose levels in a relatively short time.
It is also possible to play on temperature and concentration of the solution to accelerate the gastric transit.
It should be further underlined that the use of these carbohydrate solutions is recommended only when the recovery time from a training/competition session causing significant depletion of muscle glycogen and the following one is short, less than 8 hours.
How many carbohydrates do you need?
Many studies has been conducted to find the ideal amount of carbohydrates to ingest.
If in post-exercise the athlete does not eat, glycogen synthesis rate is very low, while if he ingests adequate amounts of carbohydrates immediately after cessation of exercise, synthesis rate can reach a value over 20 times higher.
From the analysis of scientific literature, it seems reasonable to state that, as a result of training sessions that deplete muscle glycogen stores as seen above (<75 percent of those at rest and not fasting), the maximum synthesis rate is obtained by carbohydrate intake, with high glycemic index and high digestion and absorption rates, equal to about 1.2 g/kg of body weight/h for the next 4-5 hours from the end of exercise. In this way, the amount of glycogen produced is higher than 150 percent compared to the ingestion of 0.8 g/kg/h.
Because further increases, up to 1.6 g/kg/h, do not lead to further rise in glycogen synthesis rate, the carbohydrate amount equal to 1.2 g/kg/h can be considered optimum to maximize the resynthesis rate of muscle glycogen stores during post-exercise.
What is the optimal frequency of carbohydrate intake?
It was observed that if carbohydrates are ingested frequently, every 15-30 minutes, it seems there is a further stimulation of muscle glucose uptake as of muscle glycogen replenishment compared with ingestion at 2-hours intervals. Particularly, ingestions in the first post-exercise hours seem to optimize glycogen levels.
The second phase
The second phase begins from the end of the first, lasts until the start of the last meal before the next exercise, hence, from several hours to days, and is insulin-dependent i.e. muscle glucose uptake and glycogen synthesis are sensitive to circulating hormone levels.
Moreover, you observe a significant reduction in muscle glycogen synthesis rate: with adequate carbohydrate intake the synthesis rate is at a value of about 10-30 percent lower than that observed during the first phase.
This phase can last for several hours, but tends to be shorter if:
carbohydrate intake is high;
glycogen synthesis is more active;
muscle glycogen levels are increased.
In order to optimize the resynthesis rate of glycogen, experimental data indicate that meals with high glycemic index carbohydrates are more effective than those with low glycemic index carbohydrates; but if between a training/competition session and the subsequent one days and not hours spend, the evidences do not favor high glycemic index carbohydrates as compared to low glycemic index ones as long as an adequate amount is taken in.
Muscle glycogen synthesis rate and ingestion of carbohydrates and proteins
The combined ingestion of carbohydrates and proteins, or free insulinotropic amino acids, allows to obtain post-exercise glycogen synthesis rate that does not significantly differ from that obtained with larger amounts of carbohydrates alone. This could be an advantage for the athlete who may ingest smaller amount of carbohydrates, therefore reducing possible gastrointestinal complications commons during training/competition afterward to their great consumption.
From the analysis of scientific literature it seems reasonable to affirm that, after an exercise that depletes at least 75 percent of muscle glycogen stores, you can obtain a glycogen synthesis rate similar to that reached with 1.2 g/kg/h of carbohydrates alone (the maximum obtainable) with the coingestion of 0.8 g/kg/h of carbohydrates and 0.4 g/kg /h of proteins, maintaining the same frequency of ingestion, therefore every 15-30 minutes during the first 4-5 hours of post-exercise.
The two phases: molecular mechanisms
The biphasicity is consequence, in both phases, of an increase in:
glucose transport rate into cell;
the activity of glycogen synthase, the enzyme that catalyzes glycogen synthesis.
However, the molecular mechanisms underlying these changes are different. In the first phase, the increase in glucose transport rate, independent from insulin presence, is mediated by the translocation, induced by the contraction, of glucose transporters, called GLUT4, on the cytoplasmatic membrane of the muscle cell. In addition, the low glycogen levels also stimulate glucose transport as it is believed that a large portion of transporter-containing vesicles are bound to glycogen, and therefore they may become available when its levels are depleted. Finally, the low muscle glycogen levels stimulate glycogen synthase activity too: it has been demonstrated that these levels are a regulator of enzyme activity far more potent than insulin.
In the second phase, the increase in muscle glycogen synthesis is due to insulin action on glucose transporters and on glycogen synthase activity of muscle cell. This sensibility to the action of circulating insulin, that can persist up to 48 hours, depending on carbohydrate intake and the amount of resynthesized muscle glycogen, has attracted much attention: it is in fact possible, through appropriate nutritional intervention, to increase the secretion in order to improve glycogen synthesis itself, but also protein anabolism, reducing at the same time the protein-breakdown rate.
Glycogen synthesis rate and insulin
The coingestion of carbohydrates and proteins, or free amino acids, increases postprandial insulin secretion compared to carbohydrates alone. In some studies there was an increase in hormone secretion 2-3 times higher compared to carbohydrates alone).
It was speculated that, thanks to the higher circulating insulin concentrations, further increases in post-exercise glycogen synthesis rate could be obtained compared to those observed with carbohydrates alone, but in reality it does not seem so. In fact, if carbohydrate intake is increased to 1.2 g/kg/h plus 0.4 g/kg/h of proteins no further increases in glycogen synthesis rate are observed if compared to those obtained with the ingestion of carbohydrates alone in the same amount, 1,2 g/kg/h, that, as mentioned above, like the coingestion of 0,8 g/kg/h of carbohydrates and 0,4 g/kg/h of proteins, allows to attain the maximum achievable rate in post-exercise, or in isoenergetic quantities, that is, 1.6 g/kg.
Insulin and preferential carbohydrate storage
The greater circulating insulin levels reached with the coingestion of carbohydrates and proteins, or free amino acids, might stimulate the accumulation of ingested carbohydrates in tissues most sensitive to its action, such as liver and previously worked muscle, thus resulting in a more efficient storage, for the purposes of sport activity, of the same carbohydrates.
References
Beelen M., Burke L.M., Gibala M.J., van Loon J.C. Nutritional strategies to promote postexercise recovery. Int J Sport Nutr Exerc Metab 2010:20(6);515-532. doi:10.1123/ijsnem.20.6.515
Berardi J.M., Noreen E.E., Lemon P.W.R. Recovery from a cycling time trial is enhanced with carbohydrate-protein supplementation vs. isoenergetic carbohydrate supplementation. J Intern Soc Sports Nutrition 2008;5:24. doi:10.1186/1550-2783-5-24
Betts J., Williams C., Duffy K., Gunner F. The influence of carbohydrate and protein ingestion during recovery from prolonged exercise on subsequent endurance performance. J Sports Sciences 2007;25(13):1449-1460. doi:10.1080/02640410701213459
Howarth K.R., Moreau N.A., Phillips S.M., and Gibala M.J. Coingestion of protein with carbohydrate during recovery from endurance exercise stimulates skeletal muscle protein synthesis in humans. J Appl Physiol 2009:106;1394–1402. doi:10.1152/japplphysiol.90333.2008
Jentjens R., Jeukendrup A. E. Determinants of post-exercise glycogen synthesis during short-term recovery. Sports Medicine 2003:33(2);117-144. doi:10.2165/00007256-200333020-00004
Millard-Stafford M., Childers W.L., Conger S.A., Kampfer A.J., Rahnert J.A. Recovery nutrition: timing and composition after endurance exercise. Curr Sports Med Rep 2008;7(4):193-201. doi:10.1249/JSR.0b013e31817fc0fd
Price T.B., Rothman D.L., Taylor R., Avison M.J., Shulman G.I., Shulman R.G. Human muscle glycogen resynthesis after exercise: insulin-dependent and –independent phases. J App Physiol 1994:76(1);104–111. doi:10.1152/jappl.1994.76.1.104
Schweitzer G.G., Kearney M.L., Mittendorfer B. Muscle glycogen: where did you come from, where did you go? J Physiol 2017;595(9):2771-2772. doi:10.1113/JP273536
van Loon L.J.C., Saris W.H.M., Kruijshoop M., Wagenmakers A.J.M. Maximizing postexercise muscle glycogen synthesis: carbohydrate supplementation and the application of amino acid or protein hydrolysate mixtures. Am J Clin Nutr 2000;72: 106-111. doi:10.1093/ajcn/72.1.106
Omega-6 polyunsaturated fatty acids are the major polyunsaturated fatty acids or PUFA in the Western diet (about 90% of all of them in the diet), being components of most animal and vegetable fats.
Within the omega-6 family, linoleic acid is one of the most important and widespread fatty acids and the precursor of all omega-6 polyunsaturated fatty acids. It is produced de novo from oleic acid, an omega-9 fatty acid, only by plant in a reaction catalyzed by Δ12-desaturase, i.e. the enzyme that forms the omega-6 polyunsaturated fatty acid family from omega-9 one.
Δ12-desaturase catalyzes the insertion of the double bond between carbon atoms 6 and 7, numbered from the methyl end of the molecule.
Linoleic acid, together with alpha-linolenic acid, is a primary product of plant polyunsaturated fatty acids synthesis.
Omega-6 Polyunsaturated Fatty Acid Metabolism
Animals, lacking Δ12-desaturase, can’t synthesize it, and all the omega-6 polyunsaturated fatty acid family de novo, and they are obliged to obtain it from plant foodstuff and/or from animals that eat them; for this reason omega-6 polyunsaturated fatty acid are considered essential fatty acids, so called EFAs.
The essentiality of omega-6 polyunsaturated fatty acids, in particular just the essentiality of linoleic acid, was first reported in 1929 by Burr and Burr.
Omega-6 PUFA: from linoleic acid to arachidonic acid
Animals are able to elongate and desaturase dietary linoleic acid in a cascade of reactions to form very omega-6 polyunsaturated fatty acids.
Linoleic acid is first desaturated to gamma-linolenic acid, another important omega-6 fatty acid with significant physiologic effects, in the reaction catalyzed by Δ6-desaturase. It is thought that the rate of this reaction is limiting in certain conditions like in the elderly, under certain disease states and in premature infants; for this reason, and because it is found in relatively small amounts in the diet, few oils containing it, such as black currant, evening primrose, and borage oils, have attracted attention.
In turn gamma-linolenic acid may be elongated to dihomo-gamma-linolenic acid by an elongase. The enzyme catalyzes the addition of two carbon atoms from glucose metabolism to lengthen the fatty acid chain that may be further desaturated in a very limited amount to arachidonic acid, in a reaction catalyzed by another rate limiting enzyme, Δ5-desaturase.
Arachidonic acid can be elongated and desaturated to adrenic acid.
It should be noted that polyunsaturated fatty acids in the omega-6 family, and in any other n-families, can be interconverted by enzymatic processes only within the same family, not among families.
C-20 polyunsaturated fatty acids belonging to omega-6 and omega-3 polyunsaturated fatty acids are the precursors of eicosanoids (prostaglandins, prostacyclin, thromboxanes, and leukotrienes), powerful, short-acting, local hormones.
While the deprivation of omega-3 polyunsaturated fatty acids causes dysfunction in a wide range of behavioral and physiological modalities, the omission in the diet of omega-6 polyunsaturated fatty acids results in manifest systemic dysfunction.
In plant seed oils omega-6 fatty acids with chain length longer than 18 carbons are present only in trace while arachidonic acid is found in all animal tissues and animal-based food products.
References
Akoh C.C. and Min D.B. “Food lipids: chemistry, nutrition, and biotechnology” 3th ed. 2008
Aron H. Uber den Nahvert (On the nutritional value). Biochem Z. 1918;92:211–233 (German)
Bender D.A. “Benders’ dictionary of nutrition and food technology”. 2006, 8th Edition. Woodhead Publishing. Oxford
Bergstroem S., Danielsson H., Klenberg D. and Samuelsson B. The enzymatic conversion of essential fatty acids into prostaglandins. J Biol Chem 1964;239:PC4006-PC4008.
Burr G.O. and Burr M.M. A new deficiency disease produced by the rigid exclusion of fat from the diet. Nutr Rev 1973;31(8):148-149. doi:10.1111/j.1753-4887.1973.tb06008.x
Chow Ching K. “Fatty acids in foods and their health implication” 3th ed. 2008
Rosenthal M.D., Glew R.H. Mediacal biochemistry. Human metabolism in health and disease. John Wiley & Sons, Inc. 2009
Stipanuk M.H., Caudill M.A. Biochemical, physiological, and molecular aspects of human nutrition. 3rd Edition. Elsevier health sciences, 2012
Van D., Beerthuis R.K., Nugteren D.H. and Vonkeman H. Enzymatic conversion of all-cis-polyunsaturated fatty acids into prostaglandins. Nature 1964;203:839-841
Omega-3 polyunsaturated fatty acids or omega-3 PUFAs or omega-3 fatty acids are unsaturated fatty acids, hence lipids, that have a double bond three carbons from the methyl end of the carbon chain.[3]
eicosapentaenoic acid (EPA) or 20:5n-3, with 20 carbon atoms and 5 double bonds;
docosahexaenoic acid (DHA) or 22:6n-3, that, with 22 carbon atoms and 6 double bonds, is the most complex.
EPA and DHA are termed long-chain polyunsaturated fatty acids (LC-PUFAs).
Mammals cannot synthesize linoleic acid or LA and alpha-linolenic acid, the precursors to omega-6 polyunsaturated fatty acids and omega-3 PUFAs, respectively, due to the lack of two desaturases: delta-12 desaturase (EC 1.14.19.6) and delta-15 desaturase or omega-3 desaturase or fatty acid desaturase 3 (EC 1-14.19.13).[9] Such desaturases insert double bonds at positions 6 and 3 from the methyl end of the molecule, respectively. Linoleic acid and alpha-linolenic acid are therefore essential fatty acids.[34]
Humans and many other animals can produce, from dietary ALA, all the other omega-3 polyunsaturated fatty acids. Then, such omega-3 PUFAs become essential in the absence of dietary ALA, and for this reason they are termed conditionally essential fatty acids.[9]
EPA and DHA are important structural components of cell membranes, where they are mainly found, especially in muscle and nerve tissues.[35] Conversely, many other fatty acids are stored mainly in adipose tissue triglycerides.
DHA is the main component of cell membrane phospholipids of neural tissues of vertebrates, including photoreceptor of the retina, where it performs important functions.[22][26][29][32] In addition to their structural functions, omega-3 PUFAs are substrates for the production of bioactive lipid mediators with anti-inflammatory action, such as eicosanoids, maresins, resolvins, and protectins.[10][21]
Omega-3 polyunsaturated fatty acids are essential in neurological development of the fetus, and their intake during pregnancy is especially important in the third trimester of pregnancy, when significant brain growth occurs.[8] In the course of life their intake has been associated with a reduction in the risk of developing many chronic diseases, particularly cardiovascular diseases.[1][27][33]
The major dietary sources for humans are fishery products, especially those obtained from cold waters.[3][9][36]
Alpha-linolenic acid is produced from linoleic acid, an omega-6 PUFAs, in the plastids of phytoplankton and vascular terrestrial plants, where delta-15 desaturase inserts a double bond between carbon 3 and 4 from the methyl end of LA.[3][9]
In turn, ALA undergoes desaturation reactions, catalyzed by delta-5 desaturase (EC 1.14.19.44) and delta-6 desaturase (EC 1.14.19.3), elongation reactions, catalyzed by elongase 5 (EC 2.3.1.199) and elongase 5 and/or by elongase 2 (EC 2.3.1.199), and a limited beta-oxidation in peroxisomes, to produce DHA.[6][8]
Note that vascular terrestrial plants do not have the ability to synthesize long chain omega-3 PUFA, such as EPA and DHA.[23]
Omega-3 Fatty Acid Metabolism
The enzymes that catalyze the conversion of ALA to DHA are shared with the synthetic pathways leading to the synthesis of omega-6, omega-7 and omega-9 PUFAs.[9]
Omega-3 PUFAs appear to be the preferred substrates for delta-5 desaturase and delta-6 desaturase. However, because in many Western diets there is a high intake of linoleic acid relative to alpha-linolenic acid intake, the omega-6 pathway would be preferred over the other pathways.[38] This could be one of the explanations for the low conversion rate of alpha-linolenic acid into the other omega-3 PUFAs, although the synthesis of arachidonic acid (ARA) from linoleic acid seems to be very low, too.
Note that both the omega-3 and omega-6 families inhibit the synthesis of omega-9 polyunsaturated fatty acids.
Omega-3 biosynthesis in humans
Humans, like many other animals, can convert alpha-linolenic acid to docosahexaenoic acid, a metabolic pathway found mainly in the liver and cerebral microcirculation of the hematoencephalic barrier, but also in the cerebral endothelium and astrocytes.[18] It is common opinion that humans, like other terrestrial animals, have a limited capacity to synthesize LC-PUFAs, and therefore need an adequate intake of EPA and DHA from food.[7]
It has been shown that the yield of the synthesis decreases along the pathway: the rate of conversion of alpha-linolenic acid to eicosapentaenoic acid is low, and the limiting factor seems to be the activity of delta-6 desaturase, and the rate of conversion to docosahexaenoic acid is extremely low.[7] However recent studies have demonstrated the existence of a marked polymorphism in the fatty acid desaturase (FADS) gene cluster, especially for the contiguous genes FADS1 and FADS2 coding for delta-5 desaturase and delta-6 desaturase, respectively, which are present on chromosome 11q12.2.[6]
By analyzing genome-wide sequencing data from Bronze Age individuals and present-day Europeans, a comprehensive overview was obtained of the changes in allele frequency of FADS genes.[25]
In European populations, the transition from a hunter-gatherer society to an agricultural society would have resulted in an increase in the intake of linoleic acid and alpha-linolenic acid, and a reduction in the intake of EPA and ARA. Natural selection would then have favored the haplotype associated with the increase in the expression of FADS1 and the decrease in the expression of FADS2.[6]
This pattern is opposite to that found in the Greenlander Inuit, where it is hypothesized that natural selection would have favored alleles associated with a decrease in the rate of conversion of linoleic acid and alpha-linolenic acid into LC-PUFAs, in order to compensate for their relatively high dietary intake in such population.[13]
Do other animals need EPA and DHA?
Organisms lacking delta-15 desaturase cannot synthesize alpha-linolenic acid and hence the other omega-3 PUFAs, and, if needed, must obtain it from dietary sources. However, many animals do not need to get EPA and DHA from diet.
Terrestrial herbivorous vertebrates satisfy their need for long chain omega-3 polyunsaturated fatty acids by synthesizing them from alpha-linolenic acid obtained from the green parts of plants.[19]
And there are animals that do not need EPA and DHA, and practically do not have them. These include terrestrial insects, that have very low levels of EPA. In such animals, EPA is synthesized from dietary alpha-linolenic acid and used for eicosanoid production.[16]
Conversely, aquatic insects have high levels of EPA, whereas DHA is practically absent.[31]
Some classes of phytoplankton, such as Cryptophyceae and Dinophyceae, are very rich in EPA and DHA, whereas Bacillariophyceae or diatoms are very rich in EPA. In general, microalgae are the primary producers of EPA and DHA, and then, aquatic ecosystems are the main source of omega-3 LC-PUFAs in the biosphere.[2][28] EPA and DHA are then transferred from these microalgae along the food chain, from invertebrates to fish, and from fish to terrestrial animals, including humans. So, from microalgae to humans.[16]
Benefits for humans
Omega-3 polyunsaturated fatty acids are essential components of a healthy and balanced diet.[36] They are needed throughout development, starting from fetal life, and are associated with health improvements and reduced risk of disease.[8][26]
Indeed, many epidemiological studies have associated high intake of EPA and DHA with a lower cardiovascular mortality, especially for cardiac diseases, than predicted, probably due to the improvements in many risk factors such as plasma levels of triglycerides, HDL-cholesterol, C-reactive protein, blood pressure, both systolic and diastolic, and heart rate.[1][27]
EPA and DHA have also been shown to be useful in the treatment of diseases such as rheumatoid arthritis, and could be useful in the treatment of other inflammatory conditions such as asthma, psoriasis or inflammatory bowel disease, due to their ability to modulate many aspects of the inflammatory processes.[33]
Conversely, LC-PUFAs seem to have little or no effects on measures of glucose metabolism, such as insulin, insulin resistance, fasting glucose, and glycated haemoglobin, or on type 2 diabetes.[5]
Omega-3/omega-6 ratio
Epidemiological studies suggest that the consumption of a diet with a low omega-3/omega-6 ratio has had a negative impact on human health, contributing to the development, together with other risk factors such as sedentary life and smoking, of the main classes of diseases.[8]
Indeed, a lower incidence of cancer, autoimmunity and coronary heart disease has been observed in populations whose diet has a high omega-3/omega-6 ratio, such as Eskimos and Japanese, populations with a high fish consumption.[20][37]
Despite these evidences, Western diet has become rich in saturated fatty acids and omega-6 polyunsaturated fatty acids, and poor in omega-3 polyunsaturated fatty acids, with an omega-3/omega-6 ratio between 1:10 and 1:20, then, far from the recommended ratio of 1:5.[33]
The low value of the omega-3/omega-6 ratio is due to several factors, some of which are listed below.
Although wild plant foods are generally high in omega-3 PUFAs, crops high in omega-6 PUFAs have been much more successful in industrial agriculture than those high in omega-3 PUFAs.[3]
Low consumption of fishery products and fish oils.[33]
The high consumption of animals raised on corn-based feed, such as chickens, cattle, and pigs. Added to this is the fact that the omega-3 PUFA content of some farmed fish species is lower than that of their wild counterparts.[9]
The high consumption of oils rich in omega-6 PUFAs and poor in omega-3 PUFAs, such as safflower, sunflower, soybeans and corn oils.[4]
Note: there is no evidence that the omega-3/omega-6 ratio is important for prevention and treatment of type 2
diabetes mellitus.[5]
Effects at the molecular level of EPA and DHA
In recent years, the molecular mechanisms underlying the functional effects attributed to omega-3 polyunsaturated fatty acids, especially to EPA and DHA, are being clarified, and most of these require their incorporation into membrane phospholipids.[23]
Omega-3 PUFAs are structural components of cell membranes where they play an essential role in regulating fluidity.[35] Due to this effect, omega-3, especially EPA and DHA, can modulate cellular responses that depend upon membrane protein functions. This is particularly important in the eye, where DHA allows for optimal activity of rhodopsin, a photoreceptor protein.[29] The effect on membrane fluidity is essential for animals living in cold water, as EPA and DHA also have an antifreeze function.
EPA and DHA can modify the formation of lipid raft, microdomains with a specific lipid composition that act as platforms for receptor activities and the initiation of intracellular signaling pathways. By modifying lipid raft formation, they affect intracellular signaling pathways in different cell types, such as neurons, immune system cells, and cancer cells. In this way, EPA and DHA can modulate the activation of transcription factors, such as NF-κB, PPARs and SREBPs, and so the corresponding gene expression patterns. This is central to their role in controlling adipocyte differentiation, the metabolism of fatty acids and triacylglycerols, and inflammation.[8]
ARA, EPA, and DHA are substrates for the synthesis of bioactive lipid mediators, such as eicosanoids, that are involved in the regulation of inflammation, immunity, platelet aggregation, renal function, and smooth muscle contraction.[21]
Eicosanoids produced from arachidonic acid, that is the major substrate for their synthesis, have important physiological roles, but an excessive production has been associated with numerous disease processes.[8] The increase in EPA and DHA content in membrane phospholipids is paralleled by a reduction in ARA content and associated with a decreased production of lipid mediators form ARA and an increased production of lipid mediators from the two omega-3. Moreover, among the molecules derived from EPA and DHA, there are eicosanoids analogous to those produced from ARA, but with lower activity, resolvins, and, from DHA, protectins and maresins. These molecules appear to be responsible for many of the immune-modulating and anti-inflammatory actions attributed to the omega-3 polyunsaturated fatty acids EPA and DHA.[10]
EPA and DHA can also play a role in the non-esterified form, acting directly through receptors coupled to G proteins, modulating their activity.[30]
Finally, they can reduce the intestinal absorption of omega-6 PUFAs, and, at the enzymatic level, competitively inhibit cyclooxygenase-1 or COX-1 (EC 1.14.99.1) and lipoxygenases, and compete with omega-6 PUFAs for acyltransferases.[3]
Major sources of EPA and DHA for humans
In general, fish and aquatic invertebrates, such as molluscs and crustaceans, are the major sources of EPA and DHA for humans.[3][9][36] These animals can get EPA and DHA from food, namely, from phytoplankton, or synthesize them from alpha-linolenic acid.[16] Moreover, DHA is present in high concentrations in many fish oils, too, especially those from coldwater fish. However, it should be underscored that such oils are also high in saturated fatty acids.[24]
For those who do not eat fishery products, good sources of omega-3 LC-PUFAs are the liver of terrestrial animals and several birds of the order Passeriformes.[14][15]
Regarding the recommended intake of omega-3 polyunsaturated fatty acids, it is not yet clear what it is. The following table shows the values suggested by Food and Agriculture Organization (FAO) of the United Nations and the European Food Safety Authority (EFSA).[11][12]
Recommended daily intake of omega-3 polyunsaturated fatty acids by population subgroup (FAO and EFSA)
Organization
Subgroup
Recommendation
FAO
Adult males and non-pregnant or non-lactating adult females
Minimum of 250 mg EPA + DHA daily
Pregnant or lactating females
Minimum of 300 mg EPA + DHA daily of which at least 200 mg should be DHA
Children aged 2-4 years
100-150 mg EPA + DHA daily
Children aged 4-6 years
150-200 mg EPA + DHA daily
Children aged 6-10 years
200-250 mg EPA + DHA daily
EFSA
Adult males and non-pregnant adult females
Adequate intake is 250 mg EPA + DHA daily
Pregnant females
An additional 100-200 mg DHA daily
Infants and children aged 6 months to 2 years
100 mg DHA daily
Children aged 2-18 years
‘‘Consistent with adults’’
Omega-3 and culinary treatments
As omega-3 polyunsaturated fatty acids are particularly susceptible to oxidation due to heating, cooking and other culinary treatments could reduce their content.[3] However, this is only partially true. In food, EPA and DHA are not in free form but mainly esterified into membrane phospholipids and, in such form, are much less susceptible to oxidation.[9]
Considering the content of EPA and DHA, to express it as a percentage of the total fatty acids instead of as absolute content, namely, mg/g wet weight, leads to erroneous conclusions. For example, a fatty fish like salmon has a high EPA + DHA content, ~8 mg/g wet weight, and expressed as a percentage of the total fatty acids ~20 percent; conversely Atlantic code has a low EPA + DHA content, ~3 mg/g of wet weight, but, if expressed as a percentage of the total fatty acids ~40 percent. Atlantic code has a high percentage of EPA + DHA because is a lean fish, whereas in fatty fish EPA + DHA content is diluted by the high fatty acid content of the adipose tissue of the animal.[17]
And when EPA + DHA content is expressed in mg/g of product, no decrease in LC-PUFAs content is observed following most common culinary treatments.[16]
References
^ ab AbuMweis S., Jew S., Tayyem R. Agraib L. Eicosapentaenoic acid and docosahexaenoic acid containing supplements modulate risk factors for cardiovascular disease: a meta-analysis of randomised placebo-control human clinical. J Hum Nutr Diet 2018;31(1):67-84. doi:10.1111/jhn.12493
^ Ahlgren G., Lundstedt L., Brett M., Forsberg C. Lipid composition and food quality of some freshwater phytoplankton for cladoceran zooplankters. J Plankton Res 1990;12(4):809-18. doi:10.1093/plankt/12.4.809
^ abcdefg Akoh C.C. and Min D.B. Food lipids: chemistry, nutrition, and biotechnology. 3th ed. 2008
^ Blasbalg T.L., Hibbeln J.R., Ramsden C.E., Majchrzak S..F, Rawlings R.R. Changes in consumption of omega-3 and omega-6 fatty acids in the United States during the 20th century. Am J Clin Nutr 2011;93(5):950-62. doi:10.3945/ajcn.110.006643
^ ab Brown T.J., Brainard J., Song F., Wang X., Abdelhamid A., Hooper L. Omega-3, omega-6, and total dietary polyunsaturated fat for prevention and treatment of type 2 diabetes mellitus: systematic review and meta-analysis of randomised controlled trials. BMJ 2019;366:l4697. doi:10.1136/bmj.l4697
^ abc Buckley M.T., Racimo F., Allentoft M.E., et al. Selection in Europeans on fatty acid desaturases associated with dietary changes. Mol Biol Evol 2017;34(6):1307-1318. doi:10.1093/molbev/msx103
^ ab Burdge G.C., Wootton S.A. Conversion of α-linolenic acid to eicosapentaenoic, docosapentaenoic and docosahexaenoic acids in young women. Br J Nutr 2002;88(4):411-420. doi:10.1079/BJN2002689
^ abcdef Calder P.C. Very long-chain n-3 fatty acids and human health: fact, fiction and the future. Proc Nutr Soc 2018 77(1):52-72. doi:10.1017/S0029665117003950
^ abcdefgh Chow Ching K. Fatty acids in foods and their health implication. 3th ed. 2008
^ ab Duvall M.G., Levy B.D. DHA- and EPA-derived resolvins, protectins, and maresins in airway inflammation. Eur J Pharmacol 2016;785:144-155. doi:10.1016/j.ejphar.2015.11.001
^ EFSA Panel on Dietetic Products, Nutrition, and Allergies (NDA). Scientific opinion on dietary reference values for fats, including saturated fatty acids, polyunsaturated fatty acids, monounsaturated fatty acids, trans fatty acids, and cholesterol. 2010. doi:10.2903/j.efsa.2010.1461
^ FAO. Global recommendations for EPA and DHA intake (As of 30 June 2014)
^ Fumagalli M., Moltke I., Grarup N., Racimo F., Bjerregaard P., Jørgensen M.E., Korneliussen T.S., Gerbault P., Skotte L., Linneberg A., Christensen C., Brandslund I., Jørgensen T., Huerta-Sánchez E., Schmidt E.B., Pedersen O., Hansen T., Albrechtsen A., Nielsen R.. Greenlandic Inuit show genetic signatures of diet and climate adaptation. Science 2015;349(6254):1343-7. doi:10.1126/science.aab2319
^ Gladyshev M.I., Makhutova O.N., Gubanenko G.A., Rechkina E.A., Kalachova G.S., Sushchik N.N. Livers of terrestrial production animals as a source of long-chain polyunsaturated fatty acids for humans: an alternative to fish? Eur J Lipid Sci Technol 2015;117:1417-1421. doi:10.1002/ejlt.201400449
^ Gladyshev M.I., Popova O.N., Makhutova O.N., Zinchenko T.D., Golovatyuk L.V., Yurchenko Y.A., Kalachova G.S., Krylov A.V., Sushchik N.N. Comparison of fatty acid compositions in birds feeding in aquatic and terrestrial ecosystems. Contemp Probl Ecol 2016;9:503-513. doi:10.1134/S1995425516040065
^ abcd Gladyshev M.I. and Sushchik N.N. Long-chain omega-3 polyunsaturated fatty acids in natural ecosystems and the human diet: assumptions and challenges. Biomolecules 2019;9(9):485. doi:10.3390/biom9090485
^ Gladyshev M.I., Sushchik N.N., Tolomeev A.P., Dgebuadze Y.Y. Meta-analysis of factors associated with omega-3 fatty acid contents of wild fish. Rev Fish Biol Fish 2018;28,:277-299. doi:10.1007/s11160-017-9511-0
^ Kim H-Y. Novel metabolism of docosahexaenoic acid in neural cells. J Biol Chem 2007;282(26):18661-18665. doi:10.1074/jbc.R700015200
^ Kouba M., Mourot J. A review of nutritional effects on fat composition of animal products with special emphasis on n-3 polyunsaturated fatty acids. Biochimie 2011;93(1):13-7. doi:10.1016/j.biochi.2010.02.027
^ Kromann N., Green A. Epidemiological studies in the Upernavik district, Greenland. Incidence of some chronic diseases 1950-1974. Acta Med Scand 1980;208(5):401-6. doi:10.1111/j.0954-6820.1980.tb01221.x
^ Lauritzen L., Hansen H.S., Jørgensen M.H., Michaelsen K.F. The essentiality of long chain n-3 fatty acids in relation to development and function of the brain and retina. Prog Lipid Res 2001;40(1-2):1-94. doi:10.1016/s0163-7827(00)00017-5
^ ab Lee J.M., Lee H., Kang S. and Park W.J. Fatty acid desaturases, polyunsaturated fatty acid regulation, and biotechnological advances. Nutrients 2016;8(1):23. doi:10.3390/nu8010023
^ Mason R.P., Sherratt S.C.R. Omega-3 fatty acid fish oil dietary supplements contain saturated fats and oxidized lipids that may interfere with their intended biological benefits. Biochem Biophys Res Commun 2017;483(1):425-429. doi:10.1016/j.bbrc.2016.12.127
^ Mathieson I., Lazaridis I., Rohland N., Mallick S., Patterson N., Roodenberg S.A., Harney E., Stewardson K., Fernandes D., Novak M., et al. Genome-wide patterns of selection in 230 ancient Eurasians. Nature 2015;528:499-503. doi:10.1038/nature16152
^ ab McCann J.C., Ames B.N. Is docosahexaenoic acid, an n-3 long-chain polyunsaturated fatty acid, required for development of normal brain function? An overview of evidence from cognitive and behavioral tests in humans and animals. Am J Clin Nutr 2005;82(2):281-95. doi:10.1093/ajcn.82.2.281
^ ab Mensink R.P., Zock P.L., Kester A.D., Katan M.B. Effects of dietary fatty acids and carbohydrates on the ratio of serum total to HDL cholesterol and on serum lipids and apolipoproteins: a meta-analysis of 60 controlled trials. Am J Clin Nutr 2003;77(5):1146-55. doi:10.1093/ajcn/77.5.1146
^ Muller-Navarra D.C. Biochemical versus mineral limitation in Daphnia. Limnol Oceanogr 1995;40:1209-1214. doi:10.4319/lo.1995.40.7.1209
^ ab Niu S.L., Mitchell D.C., Lim S.Y., Wen Z.M., Kim H.Y., Salem N. Jr, Litman B.J. Reduced G protein-coupled signaling efficiency in retinal rod outer segments in response to n-3 fatty acid deficiency. J Biol Chem 2004;279(30):31098-104. doi:10.1074/jbc.M404376200
^ Oh D.Y., Talukdar S., Bae E.J., Imamura T., Morinaga H., Fan WQ, Li P., Lu W.J., Watkins S.M., Olefsky J.M. GPR120 is an omega-3 fatty acid receptor mediating potent anti-inflammatory and insulin-sensitizing effects. Cell 2010 142(5):687-698. doi:10.1016/j.cell.2010.07.041
^ Popova O.N., Haritonov A.Y., Sushchik N.N., Makhutova O.N., Kalachova G.S., Kolmakova A.A., Gladyshev M.I. Export of aquatic productivity, including highly unsaturated fatty acids, to terrestrial ecosystems via Odonata. Sci Total Environ 2017;581-582:40-48. doi:10.1016/j.scitotenv.2017.01.017
^ Salem N. Jr, Litman B., Kim H.Y., Gawrisch K. Mechanisms of action of docosahexaenoic acid in the nervous system. Lipids 2001;36(9):945-59. doi:10.1007/s11745-001-0805-6
^ abcd Simopoulos A.P. The importance of the omega-6/omega-3 fatty acid ratio in cardiovascular disease and other chronic diseases. Exp Biol Med 2008;233(6):6746-88. doi:10.1016/S0753-3322(02)00253-6
^ Smith W., Mukhopadhyay R. Essential fatty acids: the work of George and Mildred Burr. J Biol Chem 2012;287(42):35439-35441. doi:10.1074/jbc.O112.000005
^ ab Stubbs C.D., Smith A.D. The modification of mammalian membrane polyunsaturated fatty acid composition in relation to membrane fluidity and function. Biochim Biophys Acta 1984;779(1):89-137. doi:10.1016/0304-4157(84)90005-4
^ abc Tocher D.R., Betancor M.B., Sprague M., Olsen R.E., Napier J.A. Omega-3 long-chain polyunsaturated fatty acids, EPA and DHA: bridging the gap between supply and demand. Nutrients 2019;11(1):89. doi:10.3390/nu11010089
^ Yano K., MacLean C.J., Reed D.M., Shimizu Y., Sasaki H., Kodama K., Kato H., Kagan A. A comparison of the 12-year mortality and predictive factors of coronary heart disease among Japanese men in Japan and Hawaii. Am J Epidemiol 1988;127(3):476-87. doi:10.1093/oxfordjournals.aje.a114824
^ Williams C.M., Burdge G. Long-chain n-3 PUFA: plant v. marine sources. Proc Nutr Soc 2006;65(1):42-50. doi:10.1079/pns2005473
Animals cannot synthesize the two fatty acids due to the lack of delta-12 desaturase (E.C. 1.14.19.6) and delta-15 desaturase (EC 1.14.19.25).[1][9][15] These enzymes introduce cis double bonds beyond carbon 9, and are present in plants and some microorganisms such as some bacteria, fungi and molds.[10]
Delta-12 desaturase catalyzes the synthesis of linoleic acid from oleic acid, by introducing a double bond at delta-12 position, namely, between carbons 6 and 7 from the methyl end of the fatty acid.[15]
Delta-15 desaturase or omega-3 desaturase or fatty acid desaturase 3 catalyzes the synthesis of alpha-linolenic acid from linoleic acid by introducing a double bond at delta-15 position, namely, between carbons 3 and 4 from the methyl end of the fatty acid. The enzyme is only present in the plastids and in the endoplasmic reticulum of phytoplankton and vascular terrestrial plants.[1][9]
Synthesis of EFAs
Linoleic acid and alpha-linolenic acid are the precursors to omega-6 polyunsaturated fatty acids and omega-3 polyunsaturated fatty acids. In the absence of dietary EFAs, a rather rare condition, the other omega-3 and omega-6 fatty acids become essential, too. For this reason, these lipids are defined by some as conditionally essential fatty acids.[9]
It should be pointed out that all essential fatty acids are polyunsaturated fatty acids, but not all polyunsaturated fatty acids are essential, such as those belonging to the omega-7 and omega-9 families.
The first evidence of the existence of essential fatty acids dates back to 1918, when Hans Aron suggested that dietary fat could be essential for the healthy growth of animals and that, in addition to their caloric contribution, there was a inherent nutritive value due to the presence of certain lipid molecules.[2]
In 1927, Herbert M. Evans and George Oswald Burr demonstrated that, despite the addition of vitamins A, D, and E to the diet, a deficiency of fat severely affected both growth and reproduction of experimental animals. Therefore, they suggested the presence of an essential substance in the fat that they called vitamin F.[11]
Eleven years after Aron work, in 1929, Burr and his wife Mildred Lawson hypothesized that warm-blooded animals were not able to synthesize appreciable amounts of certain fatty acids.[7] One year later, they discovered that linoleic acid was essential for animals, and it was they who coined the term essential fatty acid.[8][19]
However, EFA deficiency in humans was first described by Arild Hansen only in 1958, in infants fed a milk-based formula lacking them.[14]
And in 1964, thanks to the research of Van Dorp and Bergstroem, one of their biological functions was discovered: being the precursors for the synthesis of prostaglandins.[3][21]
Role
Essential fatty acids play important biological functions.
Linoleic acid and alpha-linolenic acid can be used as an energy source through beta-oxidation.[22]
Linoleic acid and alpha-linolenic acid are the precursors to omega-6 polyunsaturated fatty acids and omega-3 polyunsaturated fatty acids. Indeed, many animals, including humans, can synthesize, although with variable efficiency, the other omega-3 and omega-6 polyunsaturated fatty acids, for example arachidonic acid, eicosapentaenoic acid, and docosahexaenoic acid.[5][6][18]
Essential fatty acids are structural components of cellular membranes, modulating, for example, their fluidity.[20][22]
They are essential in the skin, especially linoleic acid in sphingolipids of the stratum corneum, where they contribute to the formation of the barrier against water loss.[23]
They have a crucial role in the prevention of many diseases, particularly coronary heart disease.[12][16]
Food sources
Linoleic acid is the most abundant polyunsaturated fatty acid in the Western diet, and accounts for 85-90 percent of dietary omega-6 polyunsaturated fatty acids.[13] The richest dietary sources are vegetable oils and seeds of many plants.[4]
Linoleic acid content (mg/g) in main food sources for humans
Food sources
Linoleic acid
Safflower oil
~ 740
Sunflower oil
~ 600
Soybean oil
~ 530
Corn oil
~ 500
Cottonseed oil
~ 480
Walnuts
~ 340
Brazil nuts
~ 250
Peanut oil
~ 240
Rapeseed oil
~ 190
Peanuts
~ 140
Flaxseed oil
~ 135
Linoleic acid is present in fair amounts also in animal products such as chicken eggs or lard, because it is present in their feed.[9]
It should be noted that some of the major sources of linoleic acid, such as walnuts, flaxseed oil, soybean oil, and rapeseed oil are also high in alpha-linolenic acid.[17]
Some of the richest dietary sources of alpha-linolenic acid are flaxseed oil, ~ 550 mg/g, rapeseed oil, ~ 85 mg/g, and soybean oil, ~ 75 mg/g. Other foods rich in alpha-linolenic acid include nuts, ~ 70 mg/g, and soybeans, ~ 10 mg/g.[1]
References
^ abc Akoh C.C. and Min D.B. Food lipids: chemistry, nutrition, and biotechnology. 3th Edition. CRC Press, Taylor & Francis Group, 2008
^ Aron H. Uber den Nahrwert. Biochem Z 1918; 92: 211-33
^ Bergstroem S., Danielsson H., Klenberg D., Samuelsson B. The enzymatic conversion of essential fatty acids into prostaglandins. J Biol Chem 1964;239:PC4006-8. doi:10.1016/S0021-9258(18)91234-2
^ Blasbalg T. L., Hibbeln J. R., Ramsden C. E., Majchrzak S. F. & Rawlings R. R. Changes in consumption of omega-3 and omega-6 fatty acids in the United States during the 20th century. Am J Clin Nutr 2011;93(5):950-962. doi:10.3945/ajcn.110.006643
^ Burdge G.C, Jones A.E, Wootton S.A. Eicosapentaenoic and docosapentaenoic acids are the principal products of α-linolenic acid metabolism in young men. Br J Nutr 2002;88(4):355-364. doi:10.1079/BJN2002662
^ Burdge G.C., Wootton S.A. Conversion of α-linolenic acid to eicosapentaenoic, docosapentaenoic and docosahexaenoic acids in young women. Br J Nutr 2002;88(4):411-420. doi:10.1079/BJN2002689
^ Burr G. and Burr M. A new deficiency disease produced by the rigid exclusion of fat from the diet. J Biol Chem 1929;82:345-367. doi:10.1016/S0021-9258(20)78281-5
^ Burr G.O., Burr M.M., Miller E.S. On the fatty acids essential in nutrition. III. J Biol Chem 1932;97(1):1-9. doi:10.1016/S0021-9258(18)76213-3
^ abcd Chow Ching K. Fatty acids in foods and their health implication. 3th Edition. CRC Press, Taylor & Francis Group, 2008
^ Das U.N. Essential fatty acids: biochemistry, physiology and pathology. Biotechnol J 2006;1;420-439. doi:10.1002/biot.200600012
^ Evans H. M. and G. O. Burr. A new dietary deficiency with highly purified diets. III. The beneficial effect of fat in the diet. Proc Soc Exp Biol Med 1928;25:390-397. doi:10.3181/00379727-25-3867
^ Farvid M.S., Ding M., Pan A., Sun Q., Chiuve S.E., Steffen L.M., Willett W.C., Hu F.B. Dietary linoleic acid and risk of coronary heart disease: a systematic review and meta-analysis of prospective cohort studies. Circulation 2014;130:1568-1578. doi:10.1161/CIRCULATIONAHA.114.010236
^ Guyenet S.J., Carlson S.E. Increase in adipose tissue linoleic acid of US adults in the last half century. Adv Nutr 2015;6(6):660-664. doi:https://DOI.org/10.3945/an.115.009944
^ Hansen A.E., Haggard M.E., Boelsche A.N., Adam D.J., Wiese H.F. Essential fatty acids in infant nutrition. III. Clinical manifestations of linoleic acid deficiency. J Nutr 1958;66(4):565-76. doi:10.1093/jn/66.4.565
^ ab Malcicka M., Visser B., Ellers J. An evolutionary perspective on linoleic acid synthesis in animals. Evol Biol 2018;45:15-26. doi:10.1007/s11692-017-9436-5
^ Mensink R.P., Zock P.L., Kester A.D., Katan M.B. Effects of dietary fatty acids and carbohydrates on the ratio of serum total to HDL cholesterol and on serum lipids and apolipoproteins: a meta-analysis of 60 controlled trials. Am J Clin Nutr 2003;77(5):1146-55. doi:10.1093/ajcn/77.5.1146
^ Rajaram S. Health benefits of plant-derived α-linolenic acid. Am J Clin Nutr 2014;100 Suppl 1:443S-8S. doi:10.3945/ajcn.113.071514
^ Rett B.S., Whelan J. Increasing dietary linoleic acid does not increase tissue arachidonic acid content in adults consuming Western-type diets: a systematic review. Nutr Metab (Lond) 2011;8:36. doi:10.1186/1743-7075-8-36
^ Smith W., Mukhopadhyay R. Essential fatty acids: the work of George and Mildred Burr. J Biol Chem 2012;287(42):35439-35441. doi:10.1074/jbc.O112.000005
^ Stubbs C.D., Smith A.D. The modification of mammalian membrane polyunsaturated fatty acid composition in relation to membrane fluidity and function. Biochim Biophys Acta 1984;779(1):89-137. doi:10.1016/0304-4157(84)90005-4
^ Van Dorp D.A., Beerthuis R.K., Nugteren D.H. and Vonkeman H. Enzymatic conversion of all-cis-polyunsaturated fatty acids into prostaglandins. Nature 1964;203:839-841. doi:10.1038/203839a0
^ ab Whelan J. and Fritsche K. Linoleic acid. Adv Nutr 2013;4(3): 311-312. doi:10.3945/an.113.003772
^ Ziboh V.A. Prostaglandins, leukotrienes, and hydroxy fatty acids in epidermis. Semin Dermatol 1992;11(2):114-20
Invert sugar, also known as inverted sugar, is sucrose partially or totally cleaved into fructose and glucose and, apart from the chemical process used, the obtained solution has the same amount of the two carbohydrates.
Moreover, according to the product, not cleaved sucrose may also be present.
Invert sugar production
The breakdown of sucrose may happen in a reaction catalyzed by enzymes, such as:
sucrase-isomaltase (EC 3.2.1.48), actives at our own intestinal level where it is involved in carbohydrate digestion;
invertase, an enzyme secreted by honeybees into the honey and used industrially to obtain invert sugar.
Another process applies acid action, as it happens partly in our own stomach and as it happened in the old times, and still happens, at home-made and industrial level. Sulfuric and hydrochloric acids was used, heating the solution with caution for some time; in fact the reaction is as fast as the solution is acid, regardless of the type of acid used, and as higher the temperature is. The acidity is then reduced or neutralized with alkaline substances, as soda or sodium bicarbonate.
A chemical process as described occurs when acid foods are prepared; i.e. in the preparation of jams and marmalades, where both conditions of acidity, naturally, and high temperatures, by heating, are present. The situation is analogous when fruit juices are sweetened with sucrose.
The reaction develops at room temperature as well, obviously more slowly.
What is the practical outcome of that?
It means that, during storage, also sweets and acid foods, even those just seen, go towards a slow reaction of inversion of contained/residue sucrose, with consequent modification of the sweetness, since invert sugar at low temperatures is sweeter (due to the presence of fructose), and assumption of a different taste profile.
Properties and uses
It is principally utilized in confectionery and ice-cream industries thanks to some peculiar characteristics.
It has an higher affinity for water (hydrophilicity) than sucrose (see fructose) therefore it keeps food more humid: e.g. cakes made with invert sugar dry up less easily.
It avoids or slows down crystal formation (dextrose and fructose form less crystals than sucrose), property useful in confectionery industries for icings and coverage.
It has a lower freezing point.
It increases, just a bit, the sweetness of the product in which it has been added, as it is sweeter than an equal amount of sucrose (the sweetness of fructose depends on the temperature in which it is present).
It may take part to Maillard reaction (sucrose can’t do it) thus contributing to the color and taste of several bakery products.
It should be noted that honey, lacking in sucrose, has a fructose and glucose composition almost equal to that of 100% invert sugar (fructose is slightly more abundant than glucose). So, diluted honey, better if not much aromatic, may replace industrial invert sugar.
References
Belitz .H.-D., Grosch W., Schieberle P. “Food Chemistry” 4th ed. Springer, 2009
Bender D.A. “Benders’ Dictionary of Nutrition and Food Technology”. 8th Edition. Woodhead Publishing. Oxford, 2006
Jordan S. Commercial invert sugar. Ind Eng Chem 1924;16(3):307-310. doi:10.1021/ie50171a037
Stipanuk M.H., Caudill M.A. Biochemical, physiological, and molecular aspects of human nutrition. 3rd Edition. Elsevier health sciences, 2012
Biochemistry and Metabolism
Utilizziamo cookie tecnici necessari per il funzionamento del sito. Vorremmo anche utilizzare, ma con il tuo consenso, cookie diversi da quelli tecnici, quali cookie analitici non equiparabili ai cookie tecnici, cookie di marketing e di terze parti, al fine di analisi, di miglioramento della tua esperienza di navigazione, presentare specifici annunci pubblicitari.
Puoi esprimere il consenso all’utilizzo di tali cookie cliccando sul tasto “Accetto tutti i cookie” oppure selezionando le tue preferenze cliccando sull’apposito tasto.
Cliccando su “Rifiuta” verranno installati solo i cookie tecnici o questi equiparabili.
Potrai revocare il tuo consenso in qualsiasi momento.
 Age-related risk is a function of variables such as weight gain, low physical activity, excessive use of salt, fats and saturated fatty acids, alcohol, hypercholesterolemia, and low intake of fruits and vegetables, rather than of aging per se. For example, studies of vegetarians living in industrialized countries have shown that such dietary habits are associated with a lower increase in blood pressure with increasing age, and with a markedly lower blood pressure compared to non-vegetarians.

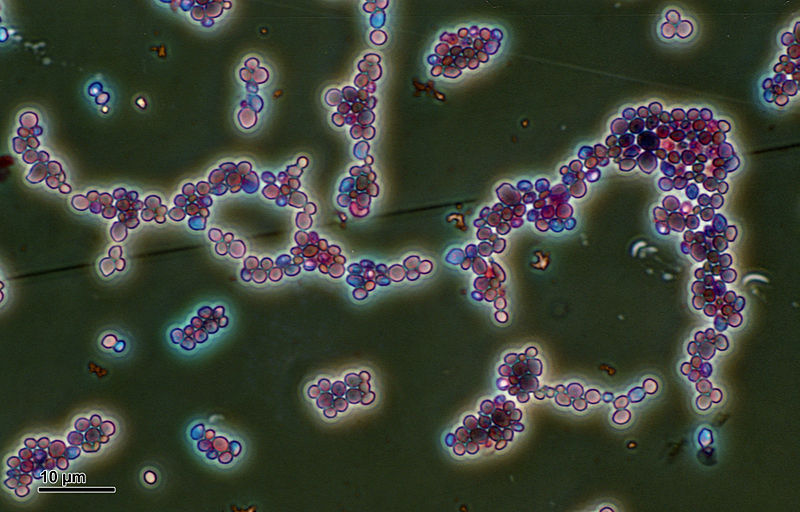

 Below we will analyze the energy expenditure of runners engaged in workouts on various distances, the amounts of
 The consumption limited to these quantities must be obtained by intake of drinks with low ethanol content, preferably at meals (drinking even lightly to moderately outside of meals increases the probability to have hypertension). This means no more than 680 ml or 24 oz of regular beer or 280 ml or 10 oz of wine (12% ethanol), especially in hypertension; for women and thinner subjects consumption should be halved1.