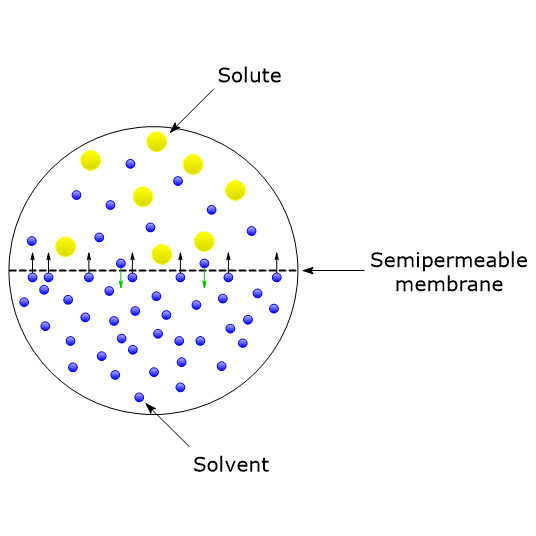
In a solution, solvent molecules tend to move from a region of higher concentration to one of lower concentration. When two different solutions are separated by a semipermeable membrane, namely, a membrane that allows certain ions or molecules to pass, in this case the solvent molecules, a net flow of solvent molecules from the side with higher concentration to the side with lower concentration will occur.[1] This net flow through the semipermeable membrane produces a pressure called osmotic pressure, denoted as Π, which can be defined as the force that must be applied to prevent the movement of solvent molecules through a semipermeable membrane.[2][3]
Summary: Key Points
- Definition: osmotic pressure stops solvent flow across a membrane and is measured via the van ’t Hoff equation.
- van ’t Hoff Factor: measures solute dissociation. It equals 1 for non-ionizable molecules and is greater than 1 for dissociating salts.
- Cellular tonicity: governs water movement. In hypotonic solutions, cells face osmotic lysis, which is prevented by cell walls or energy-dependent ion pumps.
- Glucose storage strategy: storing glucose as polymers (glycogen or starch), minimizes particle count, lowering intracellular osmolarity to prevent dangerous water influx.
- Clinical relevance: unabsorbed gut solutes retain water, causing osmotic diarrhea. In galactosemia, galactitol buildup inside the lens drives water influx, leading to cataracts.
Contents
- Osmotic pressure equation
- van ’t Hoff factor
- Osmotic pressure, osmosis, and plasma membranes
- Osmotic pressure, starch, and glycogen
- Osmotic diarrhea
- Osmotic pressure, galactosemia, and cataracts
- References
Osmotic pressure equation
Osmotic pressure, along with boiling point elevation, freezing point depression, and vapor pressure lowering, is one of the four colligative properties of solutions. These are properties that do not depend on the chemical nature of the solute particles, namely, ions, molecules, or supramolecular structures, but only on the number of solute particles present in the solution.[4]
For a solution containing n solutes, the equation that describes osmotic pressure is the sum of the contributions of each solute:
Π = RT(i1c1 + i2c2 + … + incn)
This equation is known as the van ’t Hoff equation, and it relates osmotic pressure (Π) to the following variables:
- T: the absolute temperature in Kelvin;
- R: the ideal gas constant = 8.314 J/mol·K;
- c: the molar concentration of the solute;
- i: the van ’t Hoff factor.[5][6]
van ’t Hoff factor
The van ’t Hoff factor is a measure of the degree of dissociation of solutes in solution. It is described by the equation:
i = 1 + α(n − 1)
where:
- α is the degree of dissociation of the solute, defined as the ratio between the number of moles of solute that have dissociated and the initial number of moles. Its value ranges from 0, for substances that do not ionize or dissociate in solution, to 1, for substances that completely dissociate or ionize;
- n is the number of ions formed per molecule of solute upon dissociation.[7]
Non-ionizable compounds, such as glucose, glycogen, or starch, have n = 1 and i = 1. In contrast, compounds that fully dissociate, like strong acids, strong bases, or salts, exhibit a van ’t Hoff factor greater than one, as their degree of dissociation is 1 and n is at least 2. A typical example can be found in dilute solutions.
NaCl → Na+ + Cl−
KCl → K+ + Cl−
CaCl2 → Ca2+ + 2 Cl−
In the first two cases, i = 2, while for calcium chloride, i = 3.
Finally, for substances that do not fully dissociate, such as weak acids and weak bases, i is not an integer.
The product of the van ’t Hoff factor and the molar concentration of solute particles (i·c) is called the osmolarity of the solution, namely, the concentration of osmotically active solute particles per liter of solution.[7]
Osmotic pressure, osmosis, and plasma membranes
Osmosis can be defined as the net movement of solvent molecules through a semipermeable membrane, driven by osmotic pressure differences across the membrane, in an attempt to equalize solute concentrations on both sides.[8]
In biological systems, water acts as the solvent, and plasma membranes serve as the semipermeable membranes. Plasma membranes permit the passage of water molecules through protein channels known as aquaporins, as well as small non-polar molecules that diffuse rapidly across the membrane. However, they are impermeable to ions and macromolecules.[9]
Inside the cell, there are macromolecules such as nucleic acids, proteins, glycogen, and supramolecular aggregates, for example, multienzyme complexes, as well as ions, often present at higher concentrations than in the extracellular environment. This difference in solute concentration causes osmotic pressure to drive water from the outside to the inside of the cell.[10]
If this net influx of water is not counterbalanced, the cell swells, and the plasma membrane becomes distended until the cell bursts, a process known as osmotic lysis. Under physiological conditions, this does not occur because, over the course of evolution, several mechanisms have developed to counteract, or in some cases exploit, these osmotic forces.[7] Two of the main strategies are energy-dependent ion pumps, and in plants, bacteria, and fungi, the cell wall.
Energy dependent ion pumps
Ion pumps lower, at the expense of ATP, the intracellular concentration of specific ions relative to their concentration in the extracellular environment, thereby establishing an unequal distribution of ions across the plasma membrane, an ion gradient. In doing so, the cell counterbalances the osmotic forces created by the ions and macromolecules trapped within it.
A classic example of an energy-dependent ion pump is the Na+/K+-ATPase, which actively reduces the intracellular concentration of Na⁺ compared to the outside.[8]
Cell wall
Plant cells are surrounded by an extracellular matrix known as the cell wall. This structure, being non-expandable and tightly associated with the plasma membrane, enables cells to resist the osmotic forces that would otherwise cause swelling and eventually lysis.[8]
How does it work?
In mature plant cells, vacuoles are the largest organelles, occupying approximately 80% of the total cell volume. These vacuoles accumulate large amounts of solutes, mostly organic and inorganic acids, that osmotically draw water into the cell, causing the vacuoles to swell.
As a result, the tonoplast (the membrane surrounding the vacuole) pushes the plasma membrane outward against the rigid cell wall. The cell wall mechanically resists this force, preventing osmotic lysis.[11]
This internal pressure is known as turgor pressure, which can reach values of up to 2 MPa (approximately 20 atmospheres), about ten times the air pressure in a car tire.[12] Turgor pressure is crucial for the rigidity of non-woody plant tissues and plays a role in:
- plant growth;
- the wilting of vegetables (due to turgor loss);
- plant movements, such as:
- circadian movements of leaves;
- the snapping shut of Dionaea muscipula (Venus flytrap),
- the folding of sensitive plants like Mimosa pudica.[11]
Similarly, in bacteria and fungi, the plasma membrane is surrounded by a cell wall that stably contains internal pressure, thereby preventing osmotic lysis.[12]
Isotonic, hypotonic, and hypertonic solutions
By comparing the osmotic pressure of two solutions separated by a semipermeable membrane, three types of relationships can be defined, as described below.
- Isotonic solutions have the same osmotic pressure.
- If the solutions have different osmotic pressures, the one with the higher osmotic pressure is termed hypertonic relative to the other.
- Conversely, the one with the lower osmotic pressure is termed hypotonic.[1]
In biological systems, the cytosol is typically used as the reference solution. When a cell is placed in a:
- Isotonic solution: no net movement of water occurs across the plasma membrane.
- Hypertonic solution: water flows out of the cell, leading to cell shrinkage.
- Hypotonic solution: water flows into the cell, causing it to swell and potentially burst, this process is known as osmotic lysis.
| Solution type | Relative osmotic pressure | Water movement | Effect on the Cell |
|---|---|---|---|
| Isotonic | Equal to cytosol | No net movement | Cell remains stable |
| Hypertonic | Higher than cytosol | Water flows out of the cell | Cell shrinks (crenation) |
| Hypotonic | Lower than cytosol | Water flows into the cell | Cell swells and may burst (lysis) |
In addition to ion pumps and the cell wall, multicellular organisms have evolved another strategy to counter osmotic forces: surrounding cells with a solution that is isotonic, or nearly isotonic, with respect to the cytosol.[13]
An example is plasma, the liquid component of blood, which, due to the presence of salts and proteins (primarily albumin in humans), has an osmolarity similar to that of the cytosol. This isotonic environment helps prevent excessive water movement into or out of cells.[14]
Osmotic pressure, starch and glycogen
Living organisms store glucose in polymeric forms, glycogen in animals, fungi, and bacteria, and starch in photoautotrophs, rather than as free glucose. This strategy prevents the osmotic pressure exerted by stored carbohydrates from becoming excessively high.
Since osmotic pressure, like the other colligative properties, depends solely on the number of solute particles rather than their mass or size, storing millions of glucose units as a much smaller number of polysaccharide molecules significantly reduces the resulting osmotic pressure.[4]
Here are some illustrative examples
- One gram of a polysaccharide (e.g., glycogen or starch) composed of ~1,000 glucose units exerts far less osmotic pressure than just one milligram of free glucose, because the polysaccharide counts as a single solute particle per macromolecule.[15]
- In hepatocytes, if all glucose currently stored as glycogen were instead present in its free form, the intracellular glucose concentration would rise to about 0.4 M, compared to the actual polysaccharide concentration of roughly 0.04 μM. This would create a steep osmotic gradient, causing a net inflow of water and potentially leading to osmotic lysis.[7]
- Even if cell lysis were avoided, glucose transport into the cell would become energetically unfavorable. In humans, normal blood glucose levels range from 3.33 to 5.56 mmol/L (60–100 mg/dL). If free glucose reached intracellular concentrations of 0.4 M, this would be 72 to 120 times higher than blood glucose levels, requiring significant active transport and energy expenditure to maintain.[16]
| Storage form | Molecular units | Approximate concentration | Osmotic effect | Cellular consequences |
|---|---|---|---|---|
| Free Glucose | ~1,000 individual molecules | ~0.4 M | Very high osmotic pressure | Water influx → Cell swelling → Risk of lysis |
| Glycogen/Starch | 1 macromolecule (polymer of 1,000 glucose units) | ~0.04 μM | Negligible osmotic pressure | Stable osmotic conditions |
Osmotic diarrhea
Osmotic diarrhea occurs when diseases lead to the accumulation of non-absorbed, osmotically active solutes in the distal small intestine and colon.[17]
Possible causes include bacterial infections, pancreatic diseases, and celiac disease, an autoimmune enteropathy triggered by gluten intake in genetically predisposed individuals, as well as congenital deficiencies in brush border disaccharidases, such as in lactose intolerance. In these conditions, incomplete carbohydrate digestion may occur due to deficiencies in alpha-amylase and/or one or more disaccharidases.[18] As a result, unabsorbed osmotically active solutes reach the colon, where they can also be fermented by the gut microbiota, part of the human microbiota, producing excess gas (such as hydrogen, carbon dioxide, and methane) and short-chain fatty acids, mainly butyric acid, acetic acid, and propionic acid. This leads to a condition known as osmotic-fermentative diarrhea.[19]
Osmotic diarrhea can also result from the use of osmotic laxatives, such as polyethylene glycol (PEG) or magnesium sulfate. Osmotically active solutes from incomplete digestion and osmotic laxatives increase intraluminal osmotic pressure and inhibit the normal absorption of water and electrolytes, leading to looser stools and increased intestinal motility.[20]
Osmotic pressure, galactosemia, and cataracts
Galactose, along with glucose and fructose, is one of the monosaccharides absorbed in the intestine.[21]
Galactose is metabolized primarily in the liver, and to a lesser extent in other organs and tissues. Through the Leloir pathway, it is converted into UDP-glucose and UDP-galactose, which can then be used for both anabolic and catabolic processes.[22]
Mutations in the genes encoding enzymes of the Leloir pathway lead to the accumulation of galactose and cause galactosemia, a genetic metabolic disorder whose only treatment is a galactose-restricted diet.[23] The accumulated galactose is redirected into alternative metabolic pathways, resulting in the production of galactose-related compounds such as galactitol and galactonate.[24]
One of the symptoms of galactosemia is cataracts, and the synthesis and accumulation of galactitol in the lens of the eye appears to be a contributing factor. Why? Galactitol is a poorly metabolized polyol. Due to its low lipophilicity, it does not readily diffuse across cell membranes and tends to accumulate inside the cell. Being osmotically active, its intracellular buildup increases osmotic pressure, leading to a net influx of water. This osmotic effect is believed to be one of the mechanisms through which galactitol contributes to the development of galactosemic cataracts.[25]
References
- ^ a b Zheng S., Li Y., Shao Y., Li L., Song F. Osmotic pressure and its biological implications. Int J Mol Sci 2024;25(6):3310. doi:10.3390/ijms25063310
- ^ Bowler M.G. The physics of osmotic pressure. Eur J Phys 2017;38:055102. doi:10.1088/1361-6404/aa7fd3
- ^ Osmotic pressure, in IUPAC Compendium of Chemical Terminology, 5th ed. International Union of Pure and Applied Chemistry; 2025. Online version 5.0.0, 2025. doi:10.1351/goldbook.O04344
- ^ a b Hammel H.T. Colligative properties of a solution. Science 1976;192(4241):748-56. doi:10.1126/science.1265478
- ^ van’t Hoff J.H. The role of osmotic pressure in the analogy between solutions and gases. J Membr Sci 1995;100:39-44. doi:10.1016/0376-7388(94)00232-N
- ^ Hoff J.H.v.t. Die rolle des osmotischen druckes in der analogie zwischen lösungen und gasen. Z Phys Chem 1887;1U:481-508. doi:10.1515/zpch-1887-0151
- ^ a b c d Nelson D.L., Cox M.M. Lehninger. Principles of biochemistry. 8th Edition. W.H. Freeman and Company, 2021.
- ^ a b c Berg J.M., Tymoczko J.L., Gatto J.G., Stryer L. Biochemistry. 9th Edition. W.H. Freeman and Company, 2019.
- ^ Agre P., Preston G.M., Smith B.L., Jung J.S., Raina S., Moon C., Guggino W.B., Nielsen S. Aquaporin CHIP: the archetypal molecular water channel. Am J Physiol 1993;265(4 Pt 2):F463-76. doi:10.1152/ajprenal.1993.265.4.F463
- ^ Phillips R., Kondev J., Theriot J., Garcia H.G. Physical Biology of the Cell. 2nd Edition. Garland Science. 2012. doi:10.1201/9781134111589
- ^ a b Heldt H-W. Plant biochemistry – 3th Edition. Elsevier Academic Press, 2005.
- ^ a b Beauzamy L., Nakayama N., and Boudaoud A. Flowers under pressure: ins and outs of turgor regulation in development. Ann Bot 2014;114(7):1517-1533. doi:10.1093/aob/mcu187
- ^ Alberts B., Heald B., Johnson A.D., Morgan D., Raff M., Roberts K., Walter P. Molecular Biology of the Cell. 7th Edition. Garland Science, 2022.
- ^ Brinkman J.E., Dorius B., Sharma S. Physiology, Body fluids. [Updated 2023 Jan 27]. In: StatPearls [Internet]. Treasure Island (FL): StatPearls Publishing; 2025 Jan-. Available from: https://www.ncbi.nlm.nih.gov/books/NBK482447/
- ^ Sadava D.E., Hillis D., Craig Heller H., Berenbaum M.R. Life: the science of biology. 10th Edition. Sinauer Associates. 2014.
- ^ Nakrani M.N., Wineland R.H., Anjum F. Physiology, Glucose Metabolism. [Updated 2023 Jul 17]. In: StatPearls [Internet]. Treasure Island (FL): StatPearls Publishing; 2025 Jan-. Available from: https://www.ncbi.nlm.nih.gov/books/NBK560599/
- ^ Bhutta Z., Syed S. Diarrheal diseases. Encyclopedia of food and health. 2016:361-72. doi:10.1016/B978-0-12-384947-2.00223-3
- ^ Viswanathan L., Rao S.S. Intestinal disaccharidase deficiency in adults: evaluation and treatment. Curr Gastroenterol Rep 2023;25(6):134-139. doi:10.1007/s11894-023-00870-z
- ^ Binder H.J. Role of colonic short-chain fatty acid transport in diarrhea. Annu Rev Physiol 2010;72:297-313. doi:10.1146/annurev-physiol-021909-135817
- ^ Bashir A., Sizar O. Laxatives. [Updated 2024 Jan 30]. In: StatPearls [Internet]. Treasure Island (FL): StatPearls Publishing; 2025 Jan-. Available from: https://www.ncbi.nlm.nih.gov/books/NBK537246/
- ^ Wright E.M., Martín M.G., Turk E. Intestinal absorption in health and disease–sugars. Best Pract Res Clin Gastroenterol 2003;17(6):943-56. doi:10.1016/s1521-6918(03)00107-0
- ^ National Center for Biotechnology Information. PubChem Pathway Summary for Pathway R-HSA-70370, Galactose catabolism, Source: Reactome. https://pubchem.ncbi.nlm.nih.gov/pathway/Reactome:R-HSA-70370. Accessed June 17, 2025.
- ^ Daenzer J.M., Fridovich-Keil J.L. Drosophila melanogaster models of galactosemia. Curr Top Dev Biol 2017;121:377-395. doi:10.1016/bs.ctdb.2016.07.009
- ^ Coelho A.I., Rubio-Gozalbo M.E., Vicente J.B., Rivera I. Sweet and sour: an update on classic galactosemia. J Inherit Metab Dis 2017;40(3):325-342. doi:10.1007/s10545-017-0029-3
- ^ Pintor J. Sugars, the crystalline lens and the development of cataracts. Biochem Pharmacol 2012;1:4. doi:10.4172/2167-0501.1000e119
Domande Frequenti
How do you calculate osmotic pressure using the van 't Hoff equation?
Osmotic pressure is calculated by multiplying the solution molarity by the gas constant, absolute temperature in Kelvin, and the van 't Hoff dissociation factor. This coefficient adjusts the formula based on the exact number of ionic particles released by the solute into the water.
Why do living cells store glucose as glycogen or starch instead of monomers?
Storing free glucose would spike intracellular osmolarity to 0.4 M, drawing excess water and causing osmotic cell lysis. Polymerizing glucose into glycogen or starch dramatically drops the osmotic concentration to 0.04 µM, safely preserving cell volume and structural integrity.
How does galactosemia lead to the development of osmotic cataracts?
The metabolic defect in galactosemia triggers a severe buildup of galactitol inside the eye lens. Since this polyol cannot cross membranes, it exerts a strong osmotic pull that draws water in. The resulting overhydration disrupts lens protein organization, leading to opacity.